|
- Small Phage
- March-April
- May-June
- July-August
- September-October
|
7.27 Bacteria Growth Curve After Dilution
I) Purpose
- Determine the growth curve of bacteria after dilution. This information will be used to estimate the amount of bacterial growth during incubation in mutagenesis experiments.
II) Expected Outcome
- A sigmoidal growth curve for each dilution.
- The bigger the initial dilution factor, the longer it takes for bacteria to reach its growth plateau.
III) Reagants Used
- E. Coli BL21 overnight from 5.26; LB stock; uracil solution (2.5mg/mL); adenine solution (5mg/mL)
IV) Actual Procedure
1. Bacteria preparation
- 3mL of BL21 liquid culture overnight was prepared on 7.26. Its OD600 was measured before any dilution (used 2mL).
- Three test tubes were labeled 1:50, 1:100, and 1:500 respectively. These ratios indicate the intended dilution ratios for these test tubes. To each of these three test tubes, 10mL of LB was then added. Each was also supplemented with 40uL of adenine and 80uL of uracil to mimic incubation during mutagenesis
- To the 1:50, 1:100, and 1:500 test tubes, 200uL, 100uL, and 20uL of BL21 liquid culture overnight was then added.
2. Measurements using spectrophotometer
- Spectrophotometer was warmed up and set to take measurements at 600nm.
- Pure LB was used to as blank
- 1mL of E coli solution at various concentration and time points was pipetted into each cuvette for measurement.
- The time points include 0, 0.5, 1, 1.5, 2, 2.5, and 3.5 hours
V) Results
1. Raw data
OD600 of the BL21 liquid culture overnight was 1.063. Surprisingly, this is different than our results from 5.13 Determining E coli Concentration With Spectrophotometer. This implies that we'll have to take several more measurements with overnight liquid culture to determine whether the concentration of bacteria in liquid culture is stable.
Data From Spectrophotometer Reading
| Time Point
| 1:50 dilution
| 1:100 dilution
| 1:200 dilution
|
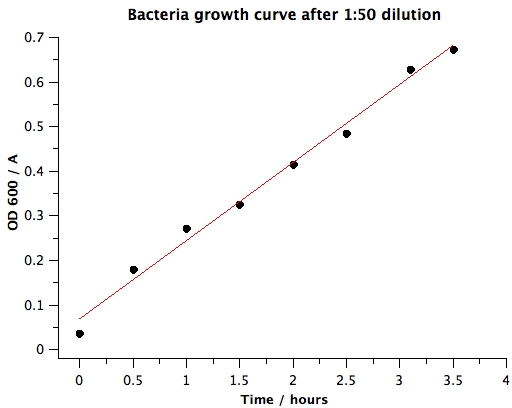
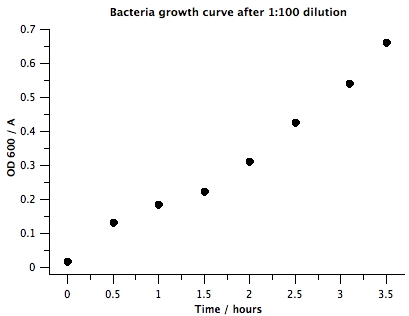
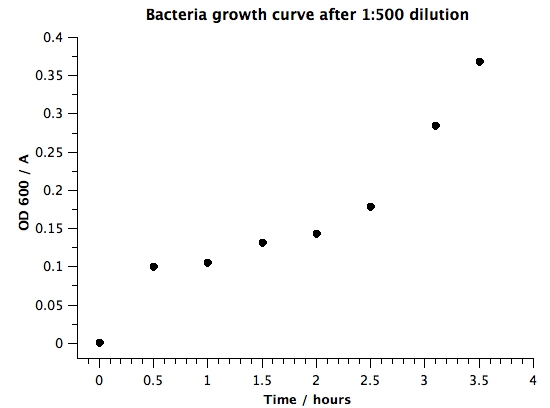
| 0 h
| 0.037
| 0.017
| 0.001
|
| 0.5 h
| 0.179
| 0.132
| 0.100
|
| 1 h
| 0.271
| 0.185
| 0.105
|
| 1.5 h
| 0.326
| 0.223
| 0.132
|
| 2 h
| 0.416
| 0.311
| 0.144
|
| 2.5 h
| 0.485
| 0.426
| 0.179
|
| 3.1 h
| 0.629
| 0.542
| 0.285
|
| 3.5 h
| 0.674
| 0.661
| 0.368
|
2. Plots
VI) Conclusion
- This experiment indicates that BL21 overnight liquid culture might not have the same concentration of bacteria. We'll need to measure bacterial concentration using spectrophotometer every time during mutagenesis to get an accurate estimate of the number of bacteria we are adding. However, to get approximately OD 0.5, for our dilution step in our mutagenesis protocol, we will use 1:50.
|
 "
"