 "
"
Team:Penn/MaGellinSoftware
From 2013.igem.org
The MaGellin Software Package
Open Source Automated, Quantifiable DNA Analysis for our Assay
For a detailed, graphical explanation of the MaGellin work flow, please download the MaGellin Workflow Specifications Sheet, which includes all of the steps in the MaGellin workflow.
The MaGellin Software Package is a MATLAB script that uses computer vision algorithms to calculate the location and intensity of DNA bands. It also has a bioinformatics module to compare the lengths of bands with the expected lengths, based on the methylation sensitivity of the enzymes and the sequence of the plasmid. So, this program is more than another gel quantifier - it interprets the biological meaning of the band lengths and returns experimentally relevant analyses. The MaGellin Software Package is crucial for our workflow because it allows for clear input/output. Since our restriction digests always yield bands in predictable locations, user bias is eliminated and data sets are standardized across trials and labs, accelerating the pace of discovery.
Protocol
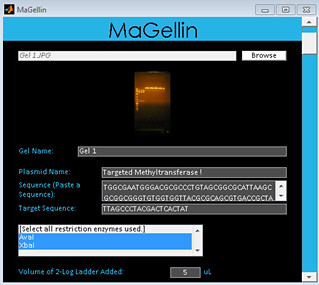
1. Upload gel picture from restriction enzyme digest. Fill out all relevant information on the graphical user interface. Enter plasmid and target sequences and select restriction enzymes used. Enter descriptive names for gel and lanes if desired.
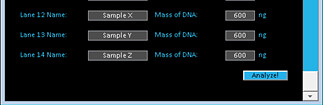
2. Press the Analyze button.
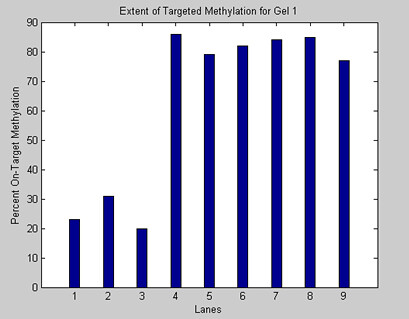
3. The Magellin Software Package will calculate the intensity and position of each band and produce a graph. Save your results.
 >
>
4. Collaborate with your fellow scientists by sharing your results on SkyDrive.
Details on the Software's Inner Workings
Before the analysis is performed, the image is subject to various procedures intended to remove ambient noise in the data. These methods include determining the average amount of noise bias per row, and convolving the image with several standard filters. Next, the MaGellin software finds the lanes in the gel. This is accomplished by running an edge detection algorithm that uses the location of edges of individual bands to infer the location of the center of each lane. The edge detection algorithm functions by treating edges as solutions to variational equations. Once the center of each lane is determined, MaGellin is ready to perform its analysis. The user inputs the plasmid sequence in question, and MaGellin converts these values into vertical coordinates on the gel by performing a logarithmic regression on the length of the user input sequences, relying on the factory-included values for the lengths of the bands of the 2-Log ladder. Now MaGellin knows where to look, and it knows what it is looking for. All that’s left to do is run the analysis. MaGellin searches in the locations in question, and if a band of suitably high intensity is found, Magellin records the intensity at this location. If no such band is found, Magellin records the intensity as 0 to indicate that no band was found in the area. The data is then extrapolated into a graph with the relevant biological meaning. Usually, we perform our experiments in triplicate, so we can run a 2-way ANOVA.
Next→
1. Upload gel picture from restriction enzyme digest. Fill out all relevant information on the graphical user interface. Enter plasmid and target sequences and select restriction enzymes used. Enter descriptive names for gel and lanes if desired.
2. Press the Analyze button.
3. The Magellin Software Package will calculate the intensity and position of each band and produce a graph. Save your results.
>4. Collaborate with your fellow scientists by sharing your results on SkyDrive.
Before the analysis is performed, the image is subject to various procedures intended to remove ambient noise in the data. These methods include determining the average amount of noise bias per row, and convolving the image with several standard filters. Next, the MaGellin software finds the lanes in the gel. This is accomplished by running an edge detection algorithm that uses the location of edges of individual bands to infer the location of the center of each lane. The edge detection algorithm functions by treating edges as solutions to variational equations. Once the center of each lane is determined, MaGellin is ready to perform its analysis. The user inputs the plasmid sequence in question, and MaGellin converts these values into vertical coordinates on the gel by performing a logarithmic regression on the length of the user input sequences, relying on the factory-included values for the lengths of the bands of the 2-Log ladder. Now MaGellin knows where to look, and it knows what it is looking for. All that’s left to do is run the analysis. MaGellin searches in the locations in question, and if a band of suitably high intensity is found, Magellin records the intensity at this location. If no such band is found, Magellin records the intensity as 0 to indicate that no band was found in the area. The data is then extrapolated into a graph with the relevant biological meaning. Usually, we perform our experiments in triplicate, so we can run a 2-way ANOVA.