 "
"
Team:Edinburgh/Project/Results/Bioethanol Results
From 2013.igem.org
Hristianita (Talk | contribs) m (moved Team:Edinburgh/Bioethanol Results to Team:Edinburgh/Project/Results/Bioethanol Results: Organising) |
|||
| Line 6: | Line 6: | ||
<h3>Generation of pET fusion:</h3> | <h3>Generation of pET fusion:</h3> | ||
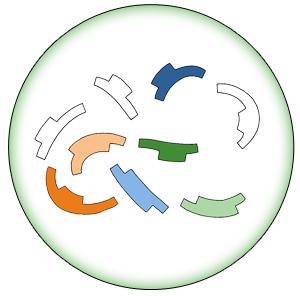
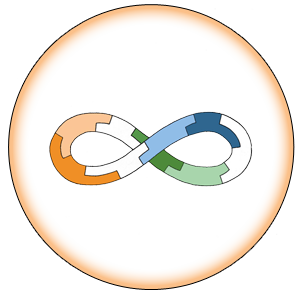
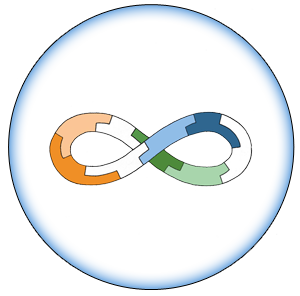
| - | In order to generate fusion of | + | In order to generate fusion of Pyruvate decarboxylase (pdc) and Alcohol dehydrogense B (adhB) Mutagenesis with Blunt- Ended Ligation (MABEL) was used. |
A pair of primers was designed complementary with 3' end of pdc and 5' end of adhB. Figure 1 represents the MABEL process. | A pair of primers was designed complementary with 3' end of pdc and 5' end of adhB. Figure 1 represents the MABEL process. | ||
Revision as of 22:44, 4 October 2013

Contents |
Generation of pET fusion:
In order to generate fusion of Pyruvate decarboxylase (pdc) and Alcohol dehydrogense B (adhB) Mutagenesis with Blunt- Ended Ligation (MABEL) was used.
A pair of primers was designed complementary with 3' end of pdc and 5' end of adhB. Figure 1 represents the MABEL process.

Figure 1. Represents MABEL process used for generation of fused pdc-adhB construct. Primer sequences used: Forward: GCATCAAGCACCTTTTATATCC; Reverse: CAGCAGTTTATTCACCGGTTTAC. See appendix figure 1 for full details on the part sequence, primer binding sites and deleted region.
Generated PCR product (see Figure 1.) was analysed on an agarose gel (Figure 2.):

Figure 2. Presence of a single PCR product of correct size (app. 6000 bp) on a 0.8% agarose gel. 1kb NEB DNA ladder was used. Several replicates of the reaction were loaded on a gel.
Evidence for presence of fused pdc-adhB:
DNA level evidence:
Primers were designed to amplify the region of fusion (region with deleted RBS). Those primers were used for PCR on fused and non-fused pdc and adhB.

Figure 3. 2.5% agarose gel analysing PCR product created using primers amplifying the region of putative gene fusion. As expected fusion product (first 3 lanes) is smaller than non-fusion (last 3 lanes).
The same set of primers was used for sequencing of pdc-adhB fusion construct. Obtained results indicate that the fused state was present on a DNA level:
uploaded chromatogram data Presence of following DNA sequence: GTAAACCGGTGAATAAACTGCTGGCATCAAGCACCTTTTATATCC corresponding to reverse complement of reverse primer followed by forward primer sequences indicates that gene fusion was obtained.
Protein level evidence:
In order to express fused pdc-adhB the construct was placed under the control of J33207 – IPTG inducible promoter combined with LacZ reporter.
Full grown cultures expressing pdc-adhB fusion and non-fusion were lysed and analysed on SDS-PAGE:

Figure 4. Scan of SDS-PAGE following Coomassie Brilliant Blue G250 staining. Within induced non-fusion lanes two intense bands are present (with size corresponding to pdc and adhB). Within induced fusion lanes described bands are missing and an additional band of increased size is observed. In vector only lane none of above described bands is present. To see full SDS-PAGE go to Appendix figure 2
In order to present that functionality of adhB is attributed to a peptide of a different mass in fusion state than in non-fusion state a native PAGE was performed.

Figure 5. Native PAGE stained for AdhB activity. Enzymatic activity can be attributed to a peptide of an increased mass in the fusion state than in non-fusion state.
Moreover, it was presented that pdc and adhB activity can be attributed to same gel band showing that fusion state was indeed obtained:

Figure 6. Native pages with adhB and pdc staining. Both activities are present in a band just below the well. Due to different acrylamide concentration used the fused protein was unable to migrate into the gel as opposed to PAGE present on figure 5.
Ethanol production using fused pdc and adhB:
Pdc and adhB catalyse conversion of pyruvate to ethanol via acetaldehyde intermediate (link to K173003).
It was hypothesized that generation of pdc-adhB fusion will increase ethanol yields. This suggestion was based on two observations: 1. Flow of substrate from one enzyme to another should be facilitated in fused protein state; 2. Due to better flow of intermediate product less of it should be released into the cell. As this intermediate is a toxic acetaldehyde moiety the fusion state could decrease toxicity of ethanol production to bacterial cell;
It was established that highest ethanol yields can be achieved in glucose as a carbon source. LB+ 4% glucose was used for ethanol production. Following ethanol levels were achieved in the experiment:

Figure 7. Ethanol production graph. Cultures were first incubated for 24h in aerobic environment. Following that they were switched into fermentative conditions for 48 hours. For statistical analysis considering multiple runs of the experiment see figure 3 and 4 in Appendix
Analysis of adhB activity in the fusion protein state:
It was observed that the adhB activity seems to be lower in the fusion state than in non-fused state (see Figure 5). To quantify this an NAD+ reduction assay was performed.

Figure 8. OD340 readings over time correspond to ctivity of adhB in fused (blue) and non-fused (red) state. From those measurements and protein concentration data obtained using Pierce assay specific activity was calculated: AdhB – fusion: 0.091 U/mg. AdhB – non-fusion: 1.79 U/mg
Those indicate that the adhB has lower activity in the fusion state. Despite this an increased ethanol concentration is obtained. Thus this observation provides an evidence that the fusion itself is the reason for increased ethanol production, not i.e. highier activity of one enzyme in fusion state.
Microscopy of cells expressing fusion and non-fusion constructs :
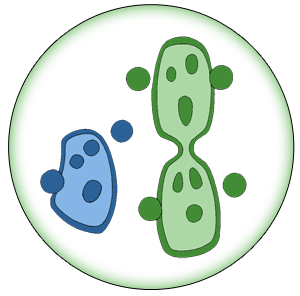
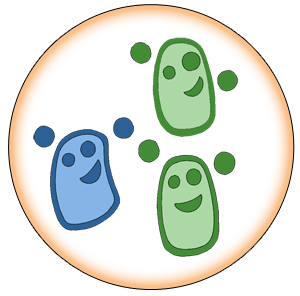
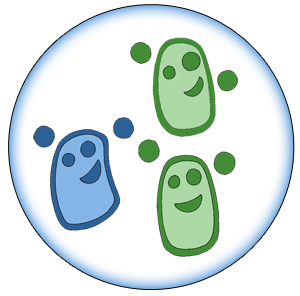
Phase contrast microscopy of cell cultures (Figure 9.) indicates that cells expressing fused pdc-adhB constructs are more likelly to be elongated.

Figure 9. Phase contrast microscopy images (x100) obtained for selected cultures. To see full microscopy slides go to Appendix figures 5 to 7.
This might be explained by possible formation of long clusters of fused proteins. This pheomenon could be achieved due to dimeric nature of active adhB and tetrameric nature of active pdc.
Ethanol production from waste :
In order to facilitate ethanol production we have decided to build a device which will convert D or L lactate straight to ethanol. The process is presented on figure 10 :

Figure 10. Direct conversion of lactic acid to ethanol using LDH and our fusion protein. Note that NADH cofactor is recycled over the course of reaction what directionates the reversible steps catalysed by LDH and ADHB.
In order to achieve direct conversion of lactatate to ethanol L-LDH and D-LDH were cloned with their native RBS (Figure 11)

Figure 11. PCR products have an expected size of about 1kb.
Genes were placed under the control of BBa_J33207 and transformed into competent E. coli cells expressing PDC-ADHB fusion protein (in pSB1K3). Double-transformed cells were plated out on CML+KAN plates. Phenotypic differences were observed in resulting colony apperance (figure 12)

Figure 12. Cells overexpressing the L-LDH (right) are much smaller than those overexpressing D-LDH (left). We hypothesise that this could be attributed to increased ethanol production using this enzyme.
Production of ethanol in B. subtilis :
The pLac_LacZ_fused_PDC_ADHB construct would not enable expression of the thanol production module in B. subtilis due to low activity of E. coli pLac promoter in this bacterium. In order to overcome that MABEL primers were designed which will convert the pLac promoter into pSpac promoter (see Appendix for details).
Following a sucesfull PCR and a blunt-ended ligation the construct was transferend into pTG262 vector and used for transformation of competent B. subtilis 168. Ethanol production was induced using IPTG.

| 
| | | | 
|
| This iGEM team has been funded by the MSD Scottish Life Sciences Fund. The opinions expressed by this iGEM team are those of the team members and do not necessarily represent those of MSD | |||||