 "
"
Team:Grenoble-EMSE-LSU/Project/Instrumentation/Fluo
From 2013.igem.org
(Difference between revisions)
(Created page with "{{:Team:Grenoble-EMSE-LSU/Templates/Project}} <html> <head> <title>Grenoble-EMSE-LSU, iGEM</title> <meta http-equiv="content-type" content="text/html;charset=utf-8" /> <...") |
|||
| Line 22: | Line 22: | ||
<li> | <li> | ||
| - | <h2></h2> | + | <h2 id="Photodiode">The photodiode and Arduino</h2> |
| - | <p></p> | + | <h3>The photodiode</h3> |
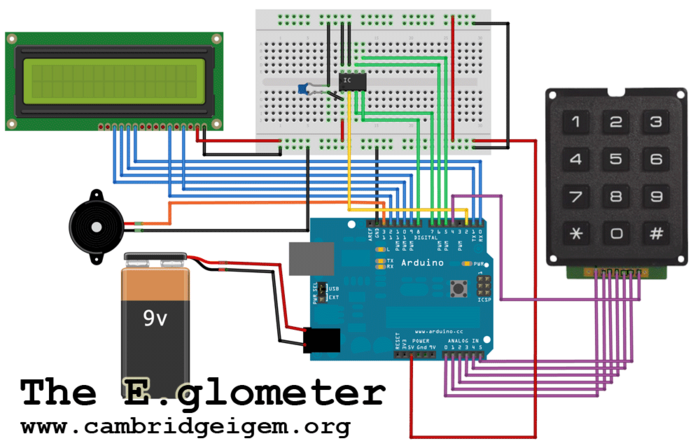
| + | <p>To record light intensity, we were inspired by the E. glometer of the Cambridge team of iGEM 2010.</br></br></p> | ||
| + | |||
| + | <p align="center"><img src="https://static.igem.org/mediawiki/2013/a/a7/Eglometer.png" alt="The Eglometer" width="500px" /></p> | ||
| + | <p id="legend"><strong><em>The E. glometer of Cambrige team (iGEM 2010)</em></strong></br> | ||
| + | Device built by Cambrige team in 2010 to measure the light intensity of their LuxBrick</br> | ||
| + | <em><strong>Source:</strong></em><a href="https://2010.igem.org/Team:Cambridge/Tools/Eglometer">https://2010.igem.org/Team:Cambridge/Tools/Eglometer</a></br></br> | ||
| + | </p> | ||
| + | |||
| + | <p> | ||
| + | We use a similar photodiode (TSL230RD) – the same as the TSL230RP-LF but as a surface mounted device (SMD) – and an Arduino Uno. Arduino is a single-board microcontroller created to make electronics more accessible. The main asset of the photodiode is that the output can be either a pulse train or a square wave (50% duty cycle) with its frequency directly proportional to light intensity. Since we are using a microcontroller, it is easy to calculate the frequency with the digital input of the microchip thanks to high or low level detection and we will have a better resolution because low frequencies are easier to measure than low voltages at low light levels.</br> | ||
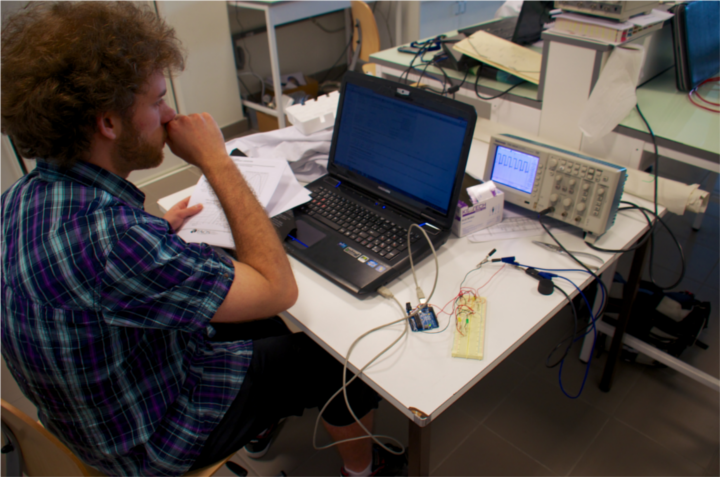
| + | However before measuring with the photodiode, we need to know if the photodiode works as indicated in the datasheet. The photodiode was plugged in on a 5V stabilized power supply.</br></br></p> | ||
| + | |||
| + | <p align="center", style="margin:20px"><img src="https://static.igem.org/mediawiki/2013/5/5f/IGEMerworkphotodiode.png" alt="memberworkingonphotodiode" width="500px"></p> | ||
| + | <p id="legend"><strong><em>A member of the team working on the photodiode</em></strong></br></br></p> | ||
| + | |||
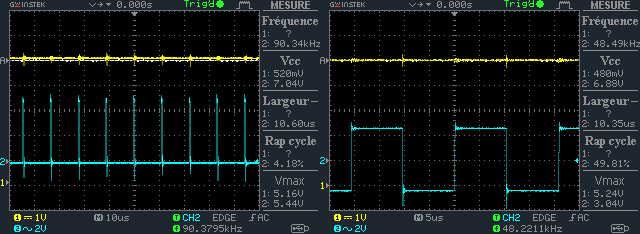
| + | <p>For the same amount of light, we measure the frequency at the output of the photodiode for a pulse train or a square wave (50% duty cycle). According to the datasheet, when using a pulse train the linear relation between the frequency and the irrandiance is given by 1kHz=1µW/cm². When using a square wave (50% duty cycle) it is 1kHz=2µW/cm². This is what we can see on the figure below. | ||
| + | </br></br></p> | ||
| + | <p align="center"><img src="https://static.igem.org/mediawiki/2013/5/51/Oscilloscope.png" alt="Oscillogram" width="650px" /></p> | ||
| + | <p id="legend"><strong><em>Oscillograms showing the two different mode of the photodiode.</em></strong></br>The first oscillogramm shows the pulse train mode and the second the 50% duty cycle mode</br></br></p> | ||
| + | |||
| + | <p>Since this frequency will be calculated by the Arduino controller, it may cause some trouble to the program to use a pulse train because the duration of the pulse is always 500ns and can be missed by the controller. The square wave (50% duty cycle) seems to be a better solution because of the 50% duty cycle. It means that the pulse duration depend on the frequency. Its duration is equal to 1/2f and since the light intensity we want to measure will be low this type of signal can be easily detected by Arduino.</br></br></p> | ||
| + | |||
| + | <h3>Arduino</h3> | ||
| + | |||
| + | <p> Arduino is an (easily) programmable microcontroller. It is used here to convert the frequency given by the photodiode in irradiance that gives us the light intensity. In | ||
| + | addition, it will communicate with the computer and control the lamp intensity to act of | ||
| + | the bacterial suspension. To measure the frequency of the peaks emitted by the photodiode, the Arduino | ||
| + | algorithm is quite simple. It counts the number of high levels (samples) and the duration of the measurement (length) and with these two elements it makes this calculation:</br></br> | ||
| + | <strong>Irradiance=frequency/(frequency scaling)= samples/(frequency scaling × length)</strong></br></br></p> | ||
| + | |||
| + | <p align="center"><img src="https://static.igem.org/mediawiki/2013/2/22/Algo_photodiode.PNG" alt="algo_photodiode" width="500px" /></br></br></p> | ||
| + | |||
| + | <p> | ||
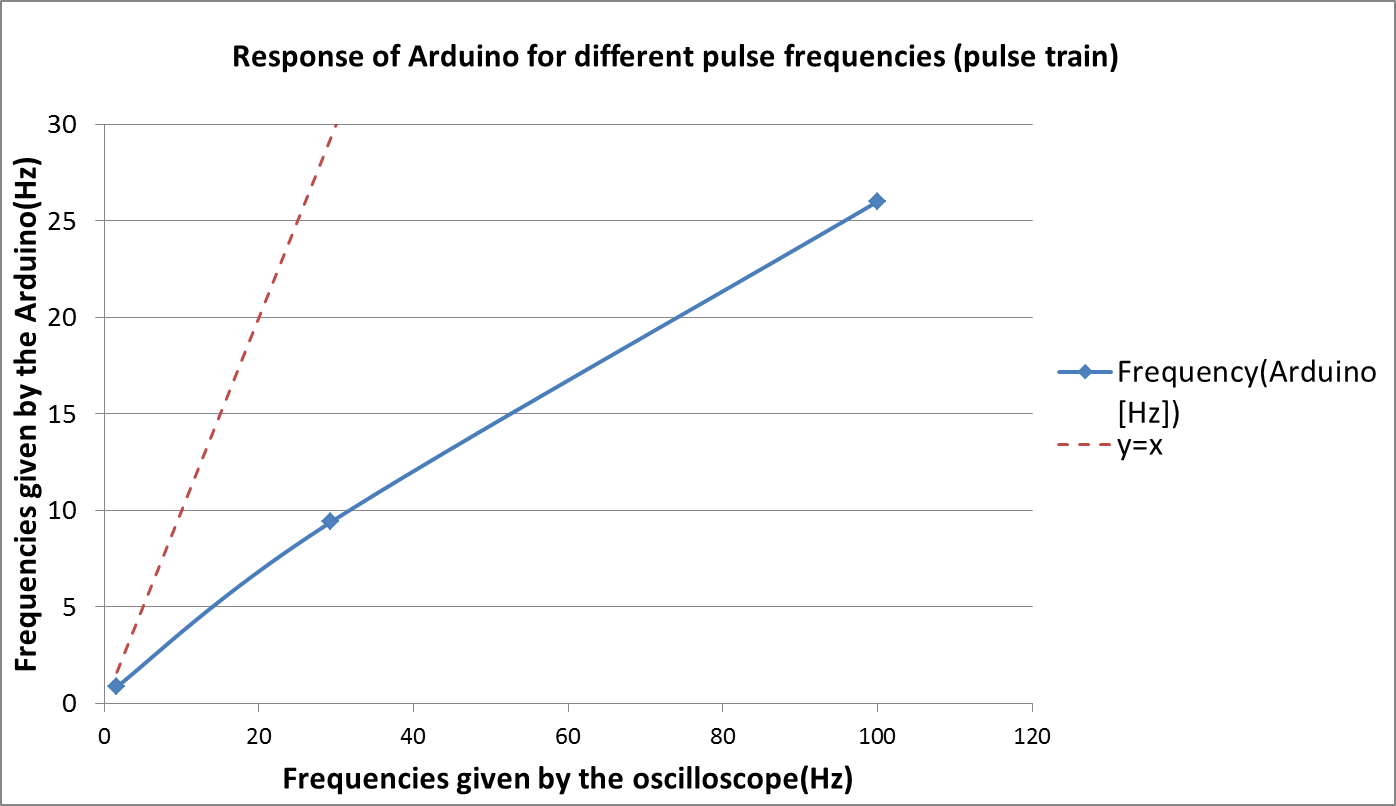
| + | To know if this program works, a function generator was plug in one of the digital input of Arduino instead of the photodiode. By changing the frequency of the square signal sent by the generator and measuring several times the frequency with Arduino and compare the measures to the frequency given by an oscilloscope, we can calculate the accuracy of the program.</br> | ||
| + | If the algorithm is right, the curve should follow the equation x=y, which means that Arduino and the oscilloscope measure the same frequencies.</br></p> | ||
| + | |||
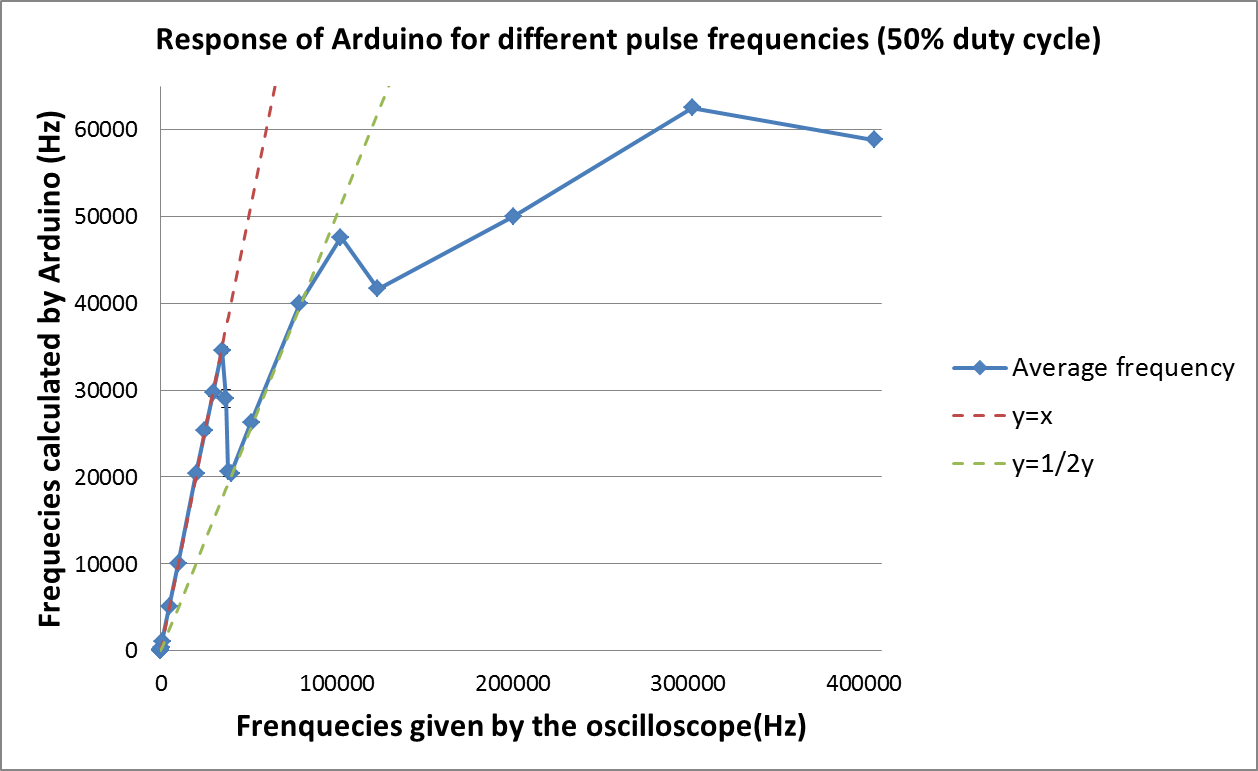
| + | <p align="center", style="margin:30px"><img src="https://static.igem.org/mediawiki/2013/3/31/Arduino_mode1.png" alt="Arduino Mode1" width="550px"> | ||
| + | <img src="https://static.igem.org/mediawiki/2013/8/86/Arduino_mode2.png" alt="Arduino Mode2" width="550px"> | ||
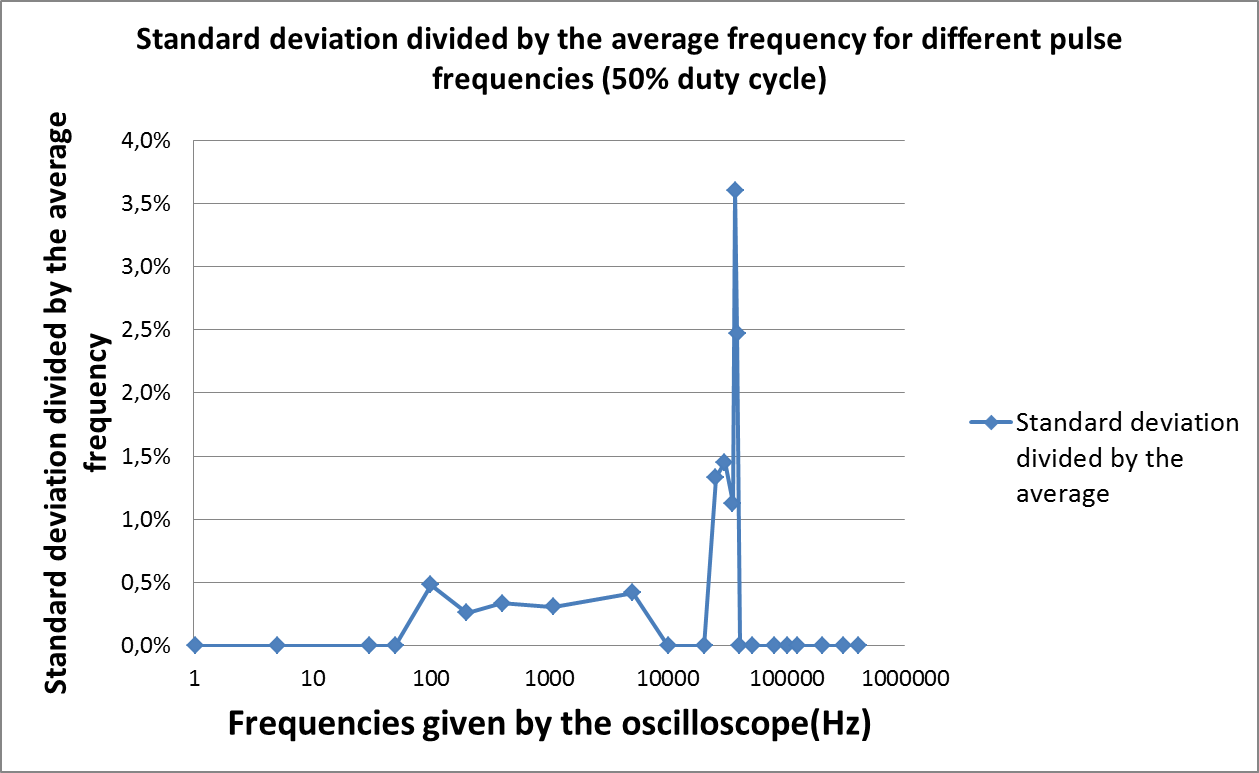
| + | <img src="https://static.igem.org/mediawiki/2013/4/40/Arduino_std.png" alt="Arduino Mode2 standard deviation" width="550px"> | ||
| + | </br></p> | ||
| + | |||
| + | <p id="legend"><strong><em>Characterization of the algorithm in Arduino</em></strong></br> | ||
| + | The first graph shows us the reponse of Arduino in pulse train mode, the second one shows us the response of Arduino in 50% duty cycle mode, and the last one gives us the standard deviation of the 50% duty cycle mode</br></br></p> | ||
| + | |||
| + | |||
| + | <p>According our the experience, the pulse train mode is not a good option since the curve doesn’t follow at all the x=y curve. Only three points are shown here because the others are worst. On the other hand, the 50% duty cycle mode seems to work better, at least at the low frequency. For frequencies under 35kHz the curve fits the equation y=x. However above this critical frequency, the response of the microcontroller seems to break down and follows the equation y=x/2. For frequencies over 100kHz, the system does not give reliable results. This is explained by the time of the "while loop" in the microcontroller program. At the end of this loop the program jump back to the beginning of the loop, but when the photodiode emits peaks at increasing frequencies, the microcontroller is not fast enough and misses one pulse out of two which explains the curves y=x then y=x/2. efficient at all, that makes us believe this is the right explanation. In addition, the plot of the standard deviation as a function of the frequency demonstrates that the system is very precise for low light intensities. The errors are below 0.5% when 100 pulses are recorded. At the lowest illuminations, the device will measure the fluorescence of the bacterial culture every 5 min, which is enough for this kind of sample. In the next paragraph, we are going to see that the device is efficient enough to measure low light intensity like fluorescence. | ||
| + | </p> | ||
</li> | </li> | ||
| + | <li> | ||
| + | <h2 id="Fluo">Fluorescence Measurement</h2> | ||
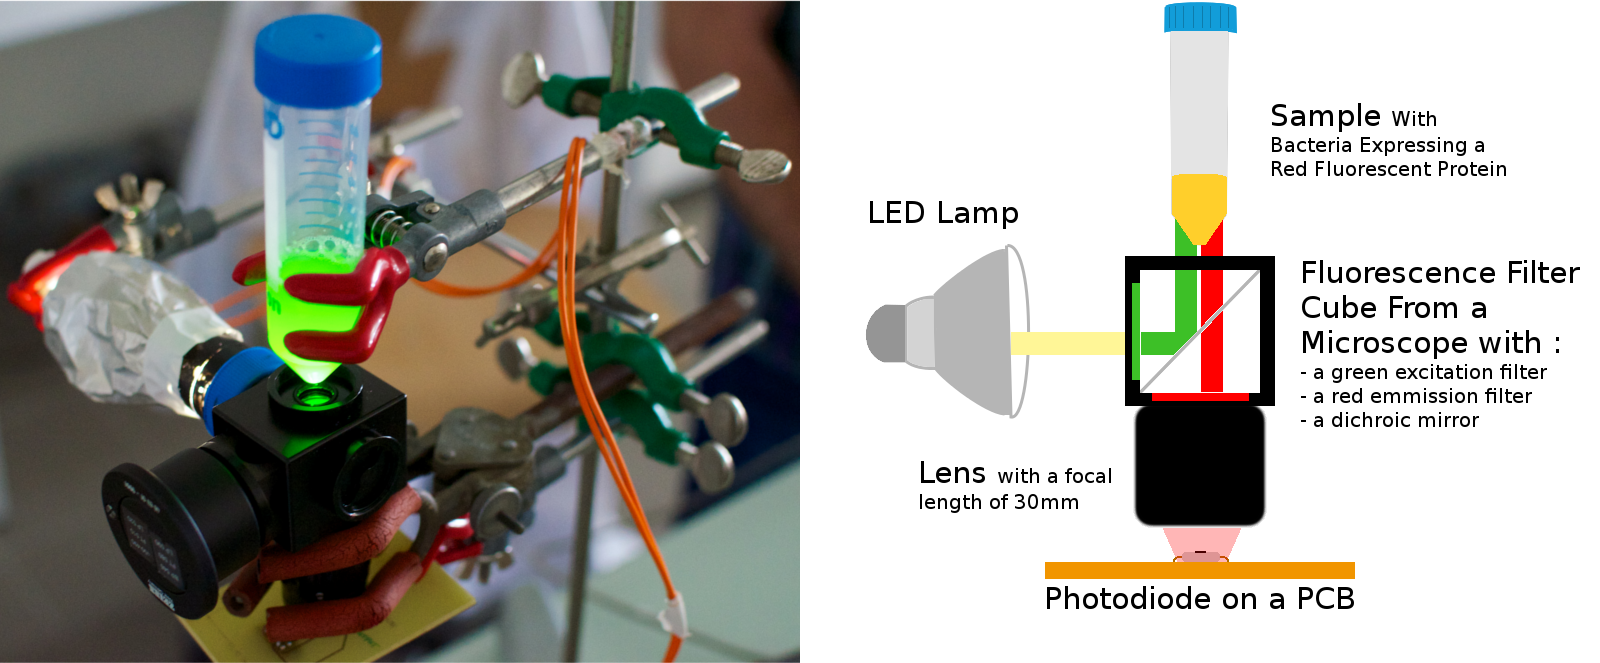
| + | <p>For the proof of concept of the optical part we use a LED lamp and a cube filter from a fluorescence microscope with excitation and emission filters and an adjustable lens. The LED lamp was chosen so that we didn't have to buy high-power LEDS and build a card with heat sinks. This lamp illuminates with 520 lumens in a 40° cone under 12V and 6W. The low voltage was chosen as a safety measure and the small angle to avoid losing too much light. The excitation filter is a green interferential filter to excite the red fluorescent protein and the red emission filter is only a colored filter to collect all the red light in order to have a more precise measure. In the cube there is also a dichroic mirror that reflects all the green light and transmits all the red light. This mirror enables us to separate the photodiode from the light source completely.</br></br></p> | ||
| + | <p align="center"><img src="https://static.igem.org/mediawiki/2013/c/ca/Optique.png" alt="Fluorometer_igem2013_Grenoble-EMSE-LSU" width="600px" /></p> | ||
| + | <p id="legend"><strong><em>TALKE'coli: C2M part</em></strong><br> | ||
| + | on the left: the real device, on the right: functional schematic<br> | ||
| + | The light from the LED lamp goes through the green excitation filter and illuminate the sample thanks to a dichroic mirror. Then the red fluorescent protein is now excited and re-emits red light that goes through a lens that concentrate it on the photodiode. | ||
| + | </p> | ||
| + | </p> | ||
| + | </li> | ||
| + | |||
| + | <li> | ||
| + | <h2 id="Electronic">Electronic circuit</h2> | ||
| + | <p>To kill more or less cell, our device needs to control light intensity. To do so, we make this electronic circuit shown below.</br></br> | ||
| + | </p> | ||
| + | |||
| + | <p align="center"><img src="https://static.igem.org/mediawiki/2013/f/f2/Highpowerled.png" alt="our electronic circuit" width="350px" /></p> | ||
| + | <p id="legend"><strong><em>Electronic circuit that enables us to control light intensity</em></strong></br> | ||
| + | This circuit stabilizes the amperage of the LED lamp at 0.5A thanks to a bipolar transistor, three diodes and the R3 and R4 resistors. | ||
| + | </br>The MOS transistor is controlled by Arduino and is used like a switch. It allows us to control the average light intensity of the LED lamp.</br></br> | ||
| + | </p> | ||
| + | <p>The first part of this circuit – all components above the MOS transistor BS170 - stabilizes the amperage of the LED lamp and the second – composed by the MOS transistor and Arduino - allows us to control the average light intensity of the LED lamp.</br> | ||
| + | The nominal power of the LED is 6W when 12V is applied. That means that the amperage going through the LED lamp is 0.5A.</br> | ||
| + | Since we cannot be sure that our alimentation is completely stable, we need to stabilize it thank to a bipolar transistor, three diodes and two resistors.</br></br> | ||
| + | We know that:</br></br> | ||
| + | <p align="center"><img src="https://static.igem.org/mediawiki/2013/3/34/Eq_i_transistor.PNG" alt="law intensity transistor" /></br></br></p> | ||
| + | <p>Therefore</br></br></p> | ||
| + | <p align="center"><img src="https://static.igem.org/mediawiki/2013/a/ab/Eq_V_circuit.PNG" alt="Voltage applied resistors"/></br></br></p> | ||
| + | <p>The value of the resistor is also:<img src="https://static.igem.org/mediawiki/2013/9/92/Eq_R_circuit.PNG" alt="Determination_of_R"/></br></br> | ||
| + | In order for the resistor not to burn, the power dissipated due to the Joule effect need to be under 0.25W.</br> | ||
| + | But it is not the case here!<img src="https://static.igem.org/mediawiki/2013/6/6d/Joule_effect.PNG" alt="Joule_effect"/></br> | ||
| + | To solve this issue we use a little trick. We put two resistors in parallel that have <strong>2xR=2.8 Ω</strong></br> | ||
| + | So that we divide the power dissipated due to the Joule effect by two but keep the same intensity Ie.</br></br> | ||
| + | |||
| + | This first part enables us to stabilize the current in the LED lamp. But to control the light intensity, we plug an MOS transistor between the first part and the ground whose gate is plug into a Pulse Width Modulation (PWM) output of Arduino. In this configuration, the transistor work as a switch; it is opened when the gate is at Low level (the ground here) and it is closed when the gate is at a high level (5V here). By modulating the time the circuit is opened per periods we can change the average intensity of the light. The figure below gives 3 examples of this system.</br></br></p> | ||
| + | <p align="center"><img src="https://static.igem.org/mediawiki/2013/0/01/PWM_arduino.PNG" alt="PWM_explanation" width="500px" /></p> | ||
| + | <p id="legend"><strong><em>Influence of Pulse Width Modulation(PWM) on the Average Light Intensity</em></strong></br> | ||
| + | T: period of the signal; I0: maximum light intensity.</br> | ||
| + | The three examples above shows that when the duty cycle of the pulse width modulation changes, the average light intensity changes too. The percentage of the light intensity compared to the maximum I0 is given by the percentage of the duty cycle of the PWM.</br></br> | ||
| + | </p> | ||
| + | <p> | ||
| + | We are now able to control light intensity thanks to this circuit, but to plug all the electronic parts - the photodiode and this circuit - a Printed circuit board (PCB) need to be printed. To do so, we used the software called Altium.</br></br> | ||
| + | |||
| + | We can finally create the box to finish the device. | ||
| + | |||
| + | |||
| + | </p> | ||
| + | |||
| + | </li> | ||
| + | <li> | ||
| + | <h2 id="Servo">Servomotor</h2> | ||
| + | <p>The servomotor is used to change the filter in front of the LED Lamp. Arduino actually possesses a library that provides a lot of functions to control the servomotor. We were inspired by <a href="http://www.mon-club-elec.fr/pmwiki_mon_club_elec/pmwiki.php?n=MAIN.ArduinoExpertServoControlePositionClavierPC">this tutorial on a french website</a>.</br> | ||
| + | After knowing how to control the servomotor, we needed to make some calculation to find the right size of the radius of the servomotor ans the arm that moves the filter rack. Since we are only using 3 different wavelengths, green for the fluorescence, red for inducing KillerRed and white light to kill the cell, we just need 3 slots. To be easier to calculate, we assign the first slot to the first position and the third slot to the last position.</p> | ||
| + | <p align="center"> | ||
| + | <img src="https://static.igem.org/mediawiki/2013/d/da/Servo_pos1.png" alt="Position1_servo" width="450px" /> | ||
| + | <img src="https://static.igem.org/mediawiki/2013/a/a8/Servo_pos2.png" alt="Position2_servo" width="450px" /></p> | ||
| + | <p id="legend"><strong><em>On the left, the first position of the servomotor and on the right, the second position of the servomotor </em></strong></br> | ||
| + | Known dimensions :</br></p> | ||
| + | <p align="left"><strong>L</strong>: distance between the center of the servomotor S and the center of the hole in the box A (6.5cm)</br> | ||
| + | <strong>h</strong>: height from A to S (2cm)</br> | ||
| + | <strong>R</strong>: radius of the filter and also the hole in the box (1cm)</br> | ||
| + | <strong>X</strong>: distance between one part of the arm and the filter rack (0.2cm)</br> | ||
| + | <strong>b</strong>: distance between the beginning of the filter rack and the filter (0.2cm) – 2b is the distance between each filters</br> | ||
| + | Dimensions to determine::</br> | ||
| + | <strong>a</strong>: radius of the servomotor</br> | ||
| + | <strong>l</strong>: length of the arm that moves the filter rack</br></br> | ||
| + | </p> | ||
| + | |||
| + | <p>A rotating servomotor was used to move a sliding filter holder in front of the light and the photodiode. Geometrical considerations explained above allowed us to dimension the lever arm that translates the rotating movement of the motor in the translation of the filter rack.</br></br> | ||
| + | It is known that: </br></br></p> | ||
| + | <center style="font-size:200%"> $L=a+\sqrt{l^2-h^2}+X+b+R$</center> | ||
| + | <br> | ||
| + | <center style="font-size:200%"> $L=\sqrt{l^2-h^2}+X+5.(b+R)-a$</center> | ||
| + | <br> | ||
| + | <p align="center"><img src="https://static.igem.org/mediawiki/2013/c/cd/Equations1-2.PNG" alt="position_eq_servo" /></p> | ||
| + | <p></br>That means: </br></br></p> | ||
| + | <p align="center"><img src="https://static.igem.org/mediawiki/2013/1/11/Equations_a.PNG" alt="a_radius_servo" /></p> | ||
| + | <p></br>To have enough power to push and pull the filter rack the angle <strong>α</strong> need to be bigger than 45°, that means:</br></br></p> | ||
| + | <p align="center"><img src="https://static.igem.org/mediawiki/2013/7/7f/Equations_condition.PNG" alt="condition_servo" /></p> | ||
| + | <p></br>But knowing <strong>a</strong> we can calculate <strong>l</strong> with [1]:</br></br></p> | ||
| + | <p align="center"><img src="https://static.igem.org/mediawiki/2013/7/74/Equations_l.PNG" alt="l_length_arm_servo" /></p> | ||
| + | </li> | ||
<li id="next"><a href="/Team:Grenoble-EMSE-LSU/Project/Attribution">Next Page</a></li> | <li id="next"><a href="/Team:Grenoble-EMSE-LSU/Project/Attribution">Next Page</a></li> | ||
Revision as of 00:12, 3 October 2013


 In order for the resistor not to burn, the power dissipated due to the Joule effect need to be under 0.25W.
But it is not the case here!
In order for the resistor not to burn, the power dissipated due to the Joule effect need to be under 0.25W.
But it is not the case here! To solve this issue we use a little trick. We put two resistors in parallel that have 2xR=2.8 Ω
So that we divide the power dissipated due to the Joule effect by two but keep the same intensity Ie.
This first part enables us to stabilize the current in the LED lamp. But to control the light intensity, we plug an MOS transistor between the first part and the ground whose gate is plug into a Pulse Width Modulation (PWM) output of Arduino. In this configuration, the transistor work as a switch; it is opened when the gate is at Low level (the ground here) and it is closed when the gate is at a high level (5V here). By modulating the time the circuit is opened per periods we can change the average intensity of the light. The figure below gives 3 examples of this system.
To solve this issue we use a little trick. We put two resistors in parallel that have 2xR=2.8 Ω
So that we divide the power dissipated due to the Joule effect by two but keep the same intensity Ie.
This first part enables us to stabilize the current in the LED lamp. But to control the light intensity, we plug an MOS transistor between the first part and the ground whose gate is plug into a Pulse Width Modulation (PWM) output of Arduino. In this configuration, the transistor work as a switch; it is opened when the gate is at Low level (the ground here) and it is closed when the gate is at a high level (5V here). By modulating the time the circuit is opened per periods we can change the average intensity of the light. The figure below gives 3 examples of this system.


