 "
"
Team:HUST-China/Modelling
From 2013.igem.org
HUST Oshyn (Talk | contribs) |
HUST LiChen (Talk | contribs) |
||
| (10 intermediate revisions not shown) | |||
| Line 73: | Line 73: | ||
<li><a href="https://2013.igem.org/Team:HUST-China/Modelling/DDE_Model"></i>Delay Differential Equations</a></li> | <li><a href="https://2013.igem.org/Team:HUST-China/Modelling/DDE_Model"></i>Delay Differential Equations</a></li> | ||
<li><a href="https://2013.igem.org/Team:HUST-China/Modelling/MCOS"></i>Multi Cells Oscillation Simulation</a></li> | <li><a href="https://2013.igem.org/Team:HUST-China/Modelling/MCOS"></i>Multi Cells Oscillation Simulation</a></li> | ||
| - | <li><a href="https://2013.igem.org/Team:HUST-China/Modelling/ | + | <li><a href="https://2013.igem.org/Team:HUST-China/Modelling/Wet-lab_data_analysis">Wet-lab Data Analysis</a></li> |
<!------------------------------------------Left side navigator end----------------------------------------------------> | <!------------------------------------------Left side navigator end----------------------------------------------------> | ||
</ul> | </ul> | ||
| Line 81: | Line 81: | ||
<!----------------------------------------------Main content start------------------------------------------------------> | <!----------------------------------------------Main content start------------------------------------------------------> | ||
<div id="Part-1"> | <div id="Part-1"> | ||
| - | < | + | <h3 class="page-header"><strong>Overview</strong></h3> |
</div> | </div> | ||
<p> | <p> | ||
| - | + | The genetic pathway we used in modelling work is described as below. | |
<div style="float:right;"> | <div style="float:right;"> | ||
<img src="https://static.igem.org/mediawiki/2013/a/ab/Pathway_HUST.png" width="350px;" /> | <img src="https://static.igem.org/mediawiki/2013/a/ab/Pathway_HUST.png" width="350px;" /> | ||
<p class="small">Fig 1.The pathway of genetic oscillator used in our project.</p | <p class="small">Fig 1.The pathway of genetic oscillator used in our project.</p | ||
></div> | ></div> | ||
| - | + | <h4>Approach and Result</h4> | |
| - | (1)Feasibility of genetic oscillator and its | + | Our modeling work includes 3 parts: |
| - | (2) | + | <strong> |
| - | (3) | + | (1)Feasibility, stability and sensitivity of single genetic oscillator and its parameters;<br> |
| - | + | (2)Feasibility of multi cells’ oscillator made up by a group of single genetic oscillators and comparison with experiment data;<br> | |
| + | (3)Statistically analyzing our wet-lab result. | ||
| + | </strong><br> | ||
| + | <p> To finish part (1), we construct DDEs model, which superb model using <acronym title="Ordinary Differential Equation">ODEs</acronym> because it is capable of describing time interval between expression of regulating protein and their binding to promoters; in other words, our model is much more precise than ODEs model. Moreover, DDEs model is more flexible than ODEs model, as we can degrade it into an ODEs one by setting lag equal to 0. Result of our model is satisfying, as our oscillator is stable while circumstance(Arabinose and IPTG) varies, and sensitive when itself($\tau$) changes. That is to say, it is easy for manipulate, which is good for further application.</p> | ||
| + | <p> To accomplish part (2), we use data from part (1) and simulate using Agent-Based Model. We then compare simulation outcome with our wet-lab data. There comes a promising result, as florescent intensity linearly related to expression of AraC of these two groups of data match each other well, namely our model is supported by our experiment. This model is extendable because it has capability simulating other problem in large population. Also method that used to compar wetlab and drylab data, which is Q-Q plot, provides a quick way for analyzing groups of data correspondent time interval remained unknown.</p> | ||
| + | <p> To fulfill part (3), we use Q-Q plot and <acronym title="Kolmogorov-Smirnov">K-S</acronym> test to confirm that single transformed cells and co-transformed cells are different. We then use <acronym title="Shapiro-Wilk">S-W</acronym> test to demonstrate that the oscillatory behavior of our oscillator is not a Brownian motion, which is often neglected regardless of its importance.</p> | ||
| + | <h4>Notes</h4> | ||
| + | Throughout the whole modelling work, we choose to study AraC instead of mRFP since they are in the same plasmid and we assumed that the expression rate of both protein is similar. By doing this, we can reduce the number of equations. | ||
</p> | </p> | ||
| Line 104: | Line 111: | ||
<div class="modal-footer footer"> | <div class="modal-footer footer"> | ||
| - | < | + | <br/> |
| - | + | ||
| - | + | ||
| - | + | ||
| - | + | ||
| - | + | ||
| - | + | ||
| - | + | ||
| - | + | ||
| - | + | ||
| - | + | ||
| - | + | ||
<div> | <div> | ||
CopyRight ©<a href="https://2013.igem.org">2013.igem.org</a> All Rights Reserved! | CopyRight ©<a href="https://2013.igem.org">2013.igem.org</a> All Rights Reserved! | ||
| Line 134: | Line 130: | ||
var futurework= $("#Future-Work").outerHeight(); | var futurework= $("#Future-Work").outerHeight(); | ||
var judge= $("#Judging-Criteria").outerHeight();*/ | var judge= $("#Judging-Criteria").outerHeight();*/ | ||
| - | if(scroll > | + | if(scroll > 204){ |
$("#up").slideDown("ease-out"); | $("#up").slideDown("ease-out"); | ||
$("#mainNavBar").addClass("navbar-fixed-top"); | $("#mainNavBar").addClass("navbar-fixed-top"); | ||
| Line 140: | Line 136: | ||
/* if (scroll < 454 + part1){ | /* if (scroll < 454 + part1){ | ||
navli.removeClass("active").eq(0).addClass("active"); | navli.removeClass("active").eq(0).addClass("active"); | ||
| - | }else if (! | + | }else if (!(scroll < 454 + part1|| scroll > 454 + part1+ part2)){ |
| + | navli.removeClass("active").eq(1).addClass("active"); | ||
| + | }else if (!(scroll < 454 + part1 + part2 || scroll > 454 + part1+ part2 + part3)){ | ||
| + | navli.removeClass("active").eq(2).addClass("active"); | ||
| + | }else if (!(scroll < 454 + part1 + part2 + part3 || scroll > 454 + part1+ part2 + part3 + futurework)){ | ||
| + | navli.removeClass("active").eq(3).addClass("active"); | ||
| + | }else if (!(scroll < 454 + part1 + part2 + part3 + futurework || scroll > 454 + part1+ part2 + part3 + judge)){ | ||
| + | navli.removeClass("active").eq(4).addClass("active"); | ||
| + | }*/ | ||
| + | }else{ | ||
| + | $("#up").slideUp("ease-in"); | ||
| + | $("#mainNavBar").removeClass("navbar-fixed-top"); | ||
| + | $(".bs-docs-sidenav").removeClass("affix").addClass("affix-top"); | ||
| + | //navli.removeClass("active").eq(0).addClass("active"); | ||
| + | } | ||
| + | }); | ||
| + | $("#up").click(pageScroll); | ||
| + | $.backstretch("https://static.igem.org/mediawiki/2013/6/6f/HUST-bghust.png"); | ||
| + | |||
| + | }); | ||
| + | |||
| + | function pageScroll() { | ||
| + | var top = $(document).scrollTop(); | ||
| + | window.scrollBy(0,-25); | ||
| + | scrolldelay = setTimeout('pageScroll()',3); | ||
| + | if (top == 0) clearTimeout(scrolldelay); | ||
| + | } | ||
| + | </script> | ||
Latest revision as of 02:50, 29 October 2013


Overview
The genetic pathway we used in modelling work is described as below.
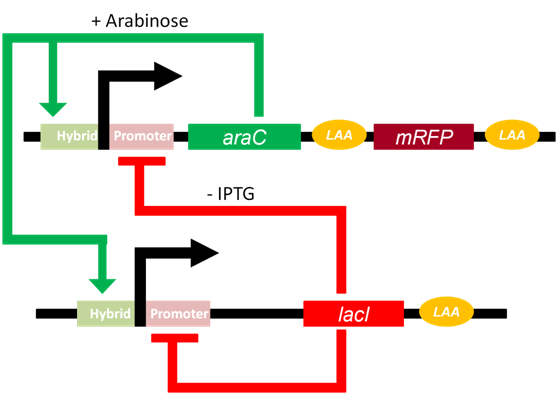
Fig 1.The pathway of genetic oscillator used in our project.
Approach and Result
Our modeling work includes 3 parts: (1)Feasibility, stability and sensitivity of single genetic oscillator and its parameters;(2)Feasibility of multi cells’ oscillator made up by a group of single genetic oscillators and comparison with experiment data;
(3)Statistically analyzing our wet-lab result.
To finish part (1), we construct DDEs model, which superb model using ODEs because it is capable of describing time interval between expression of regulating protein and their binding to promoters; in other words, our model is much more precise than ODEs model. Moreover, DDEs model is more flexible than ODEs model, as we can degrade it into an ODEs one by setting lag equal to 0. Result of our model is satisfying, as our oscillator is stable while circumstance(Arabinose and IPTG) varies, and sensitive when itself($\tau$) changes. That is to say, it is easy for manipulate, which is good for further application.
To accomplish part (2), we use data from part (1) and simulate using Agent-Based Model. We then compare simulation outcome with our wet-lab data. There comes a promising result, as florescent intensity linearly related to expression of AraC of these two groups of data match each other well, namely our model is supported by our experiment. This model is extendable because it has capability simulating other problem in large population. Also method that used to compar wetlab and drylab data, which is Q-Q plot, provides a quick way for analyzing groups of data correspondent time interval remained unknown.
To fulfill part (3), we use Q-Q plot and K-S test to confirm that single transformed cells and co-transformed cells are different. We then use S-W test to demonstrate that the oscillatory behavior of our oscillator is not a Brownian motion, which is often neglected regardless of its importance.