 "
"
Team:SCUT/Modeling/Diacetyl producer
From 2013.igem.org


ODE pathway analysis
Aim: To model the feasibility of the diacetyl producer pathway.
Steps:
- Build up the equations
- Investigate reasonable parameter sets from previous learning and researches
- Run the model and simulation
- Verify the feasibility of the pathway model
- Simulation for diacetyl producer
Background:
One of the most ambitious and challenging goals of metabolic engineering is the design of biological systems base on quantitative predictions with the aid of mathematical models. This is particularly because of the well-known difficulties in assessing enzyme kinetics under in vivo conditions as a prerequisite for a quantitative analysis of the reaction pathway.
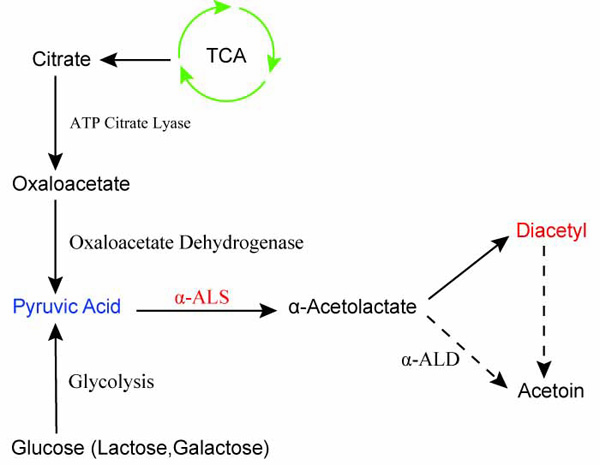
Figure 1. Diacetyl production pathway
Model Structure:
The dynamic model of the Embden-Meyerhof-Parnas pathway(EMP) of Escherichia coli consists of mass balance equations for extracellular glucose and for the intracellular metabolites. These mass balances take the following form:
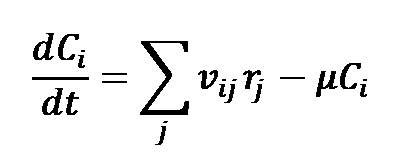
Where Ci denotes the concentration of metabolite i, μ is the specific growth rate, and vij is the stoichiometric coefficient for this metabolite in reaction j, the rate of which is rj.
The balance equation for extracellular glucose is expressed as:
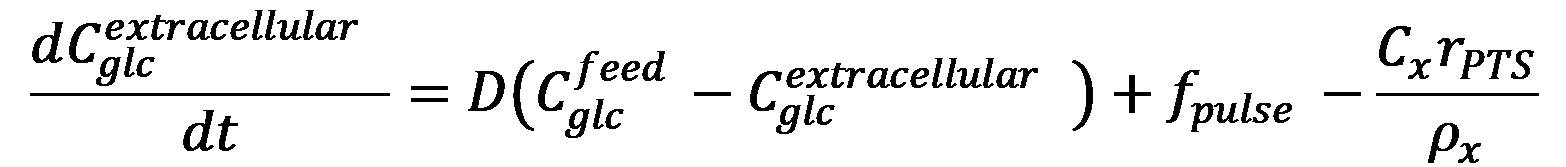
Where Cglcfeed is the glucose concentration in the feed, Cglcextracellular is the extracellular glucose concentration, Cx is the biomass concentration, and ρx is the specific weight of the biomass. The term fpulse provides allowance for the sudden change of glucose concentration caused by the glucose pulse.
Mass balance equations:

Estimation of Maximum Reaction Rates:
The rate of the enzyme i at steady state is given by:

Where  is the parameter vector and
  is the steady-state concentration vector of the metabolites involved in the reaction. Steady-state concentrations are required for the estimation of the maximal rate, rmax and as initial conditions for the integration of the dynamic model. Some of concentrations are available from the measurements of intracellular metabolites.
The remaining concentrations are estimated from a near-equilibrium assumption for the reaction. The near-equilibrium constant for the jth reaction:

Where Keq,j is the equilibrium constant of the jth reaction, is the steady-state concentration of the compound i , and vi,j is the stoichiometric coefficient of compound i in reaction j.
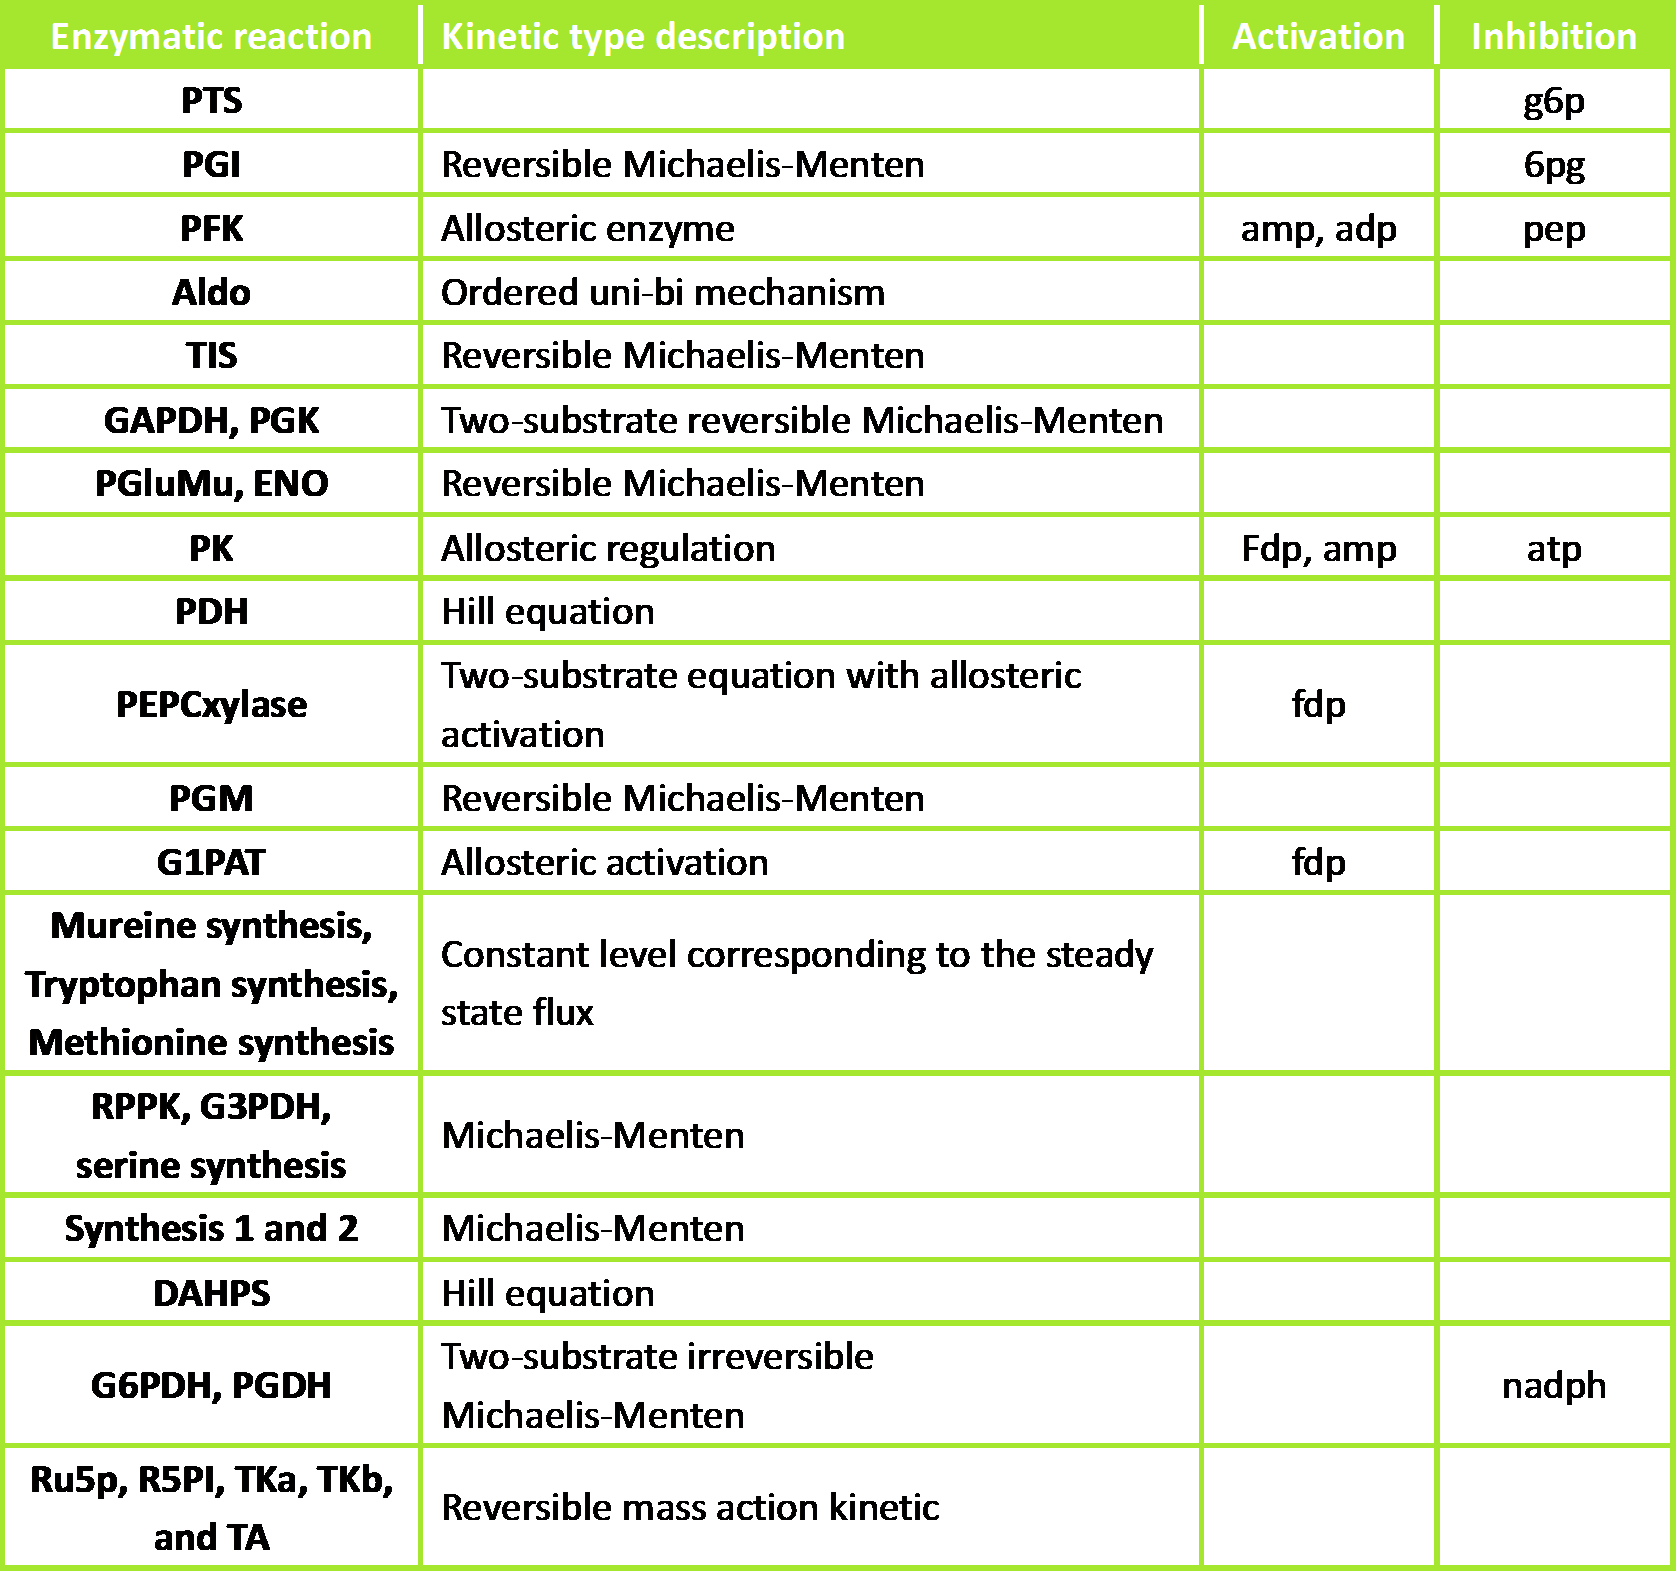
Figure 2. Kinetic types and regulations of the different enzymatic reactions
Result:
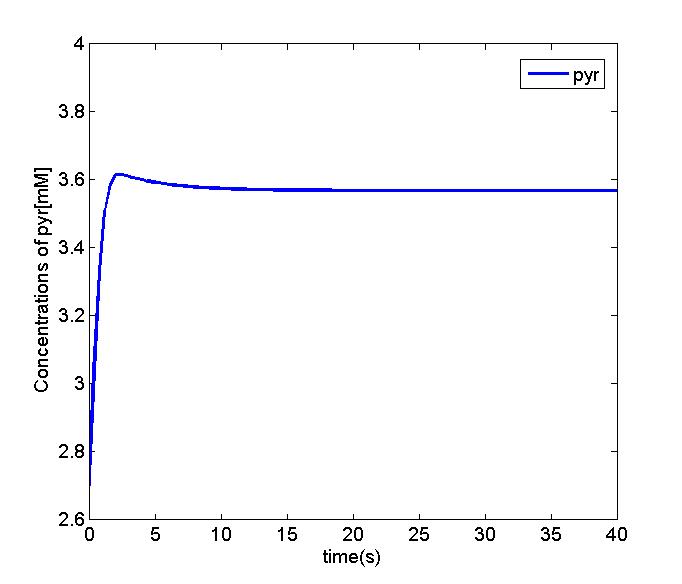
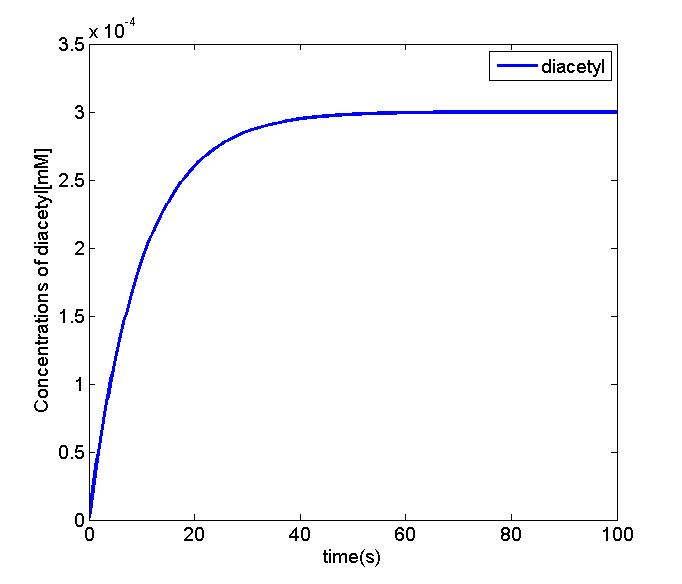
Figure 3 and 4. The simulation result shows that concentration of pyruvate in the EMP pathway will be stable. And we can simplify the equation of diacetyl producer with the Michaelis-Menten equation. We will use the parameter set and the equation to perform the oscillation and odr-10 pathway analysis.
Reaction Rate sensitivity analysis
Aim: To figure out the sensitive value of Reaction Rates in the model.
Steps:
- Reaction Rates determination
- Analyze the sensitivity of reaction rate with local sensitivity method
- Analysis reaction rates sensitivity
Background: stability analysis
A stable steady state is an essential prerequisite for mathematical model of living cells as well as for application of metabolic control analysis. With the envisaged application of the model for tasks of metabolic design, it is important to emphasize that enzyme with negligible flux control coefficients could strongly influence the stability of a steady state exposed to noise perturbation.
Our dynamic model is an investigation of promising strategies for improvement of diacetyl production process. As a primary step, flux control coefficients (FCC) on the glucose uptake by the phosphotransferase system are determined from the dynamic model. The results of these calculations are summarized.
Result:
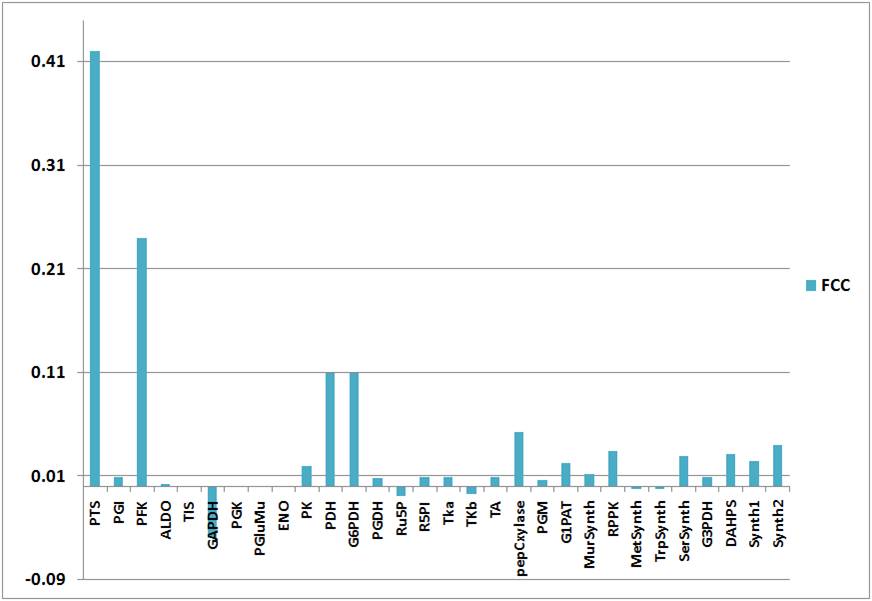
Figure 5. Flux control coefficients (FCC) of the reactions in the system
The highest control on glucose uptake is exerted by the PTS as indicated by FCC = 0.42. This outstanding role for the PTS is expected, as glucose uptake is irreversible and represents the first step in the model network, and it’s not depending on a potential precedent reaction.
Besides the PTS, there are further enzymes that exercise considerable control on glucose uptake. According to the FCC, the most important of these enzymes is the PFK (FCC = 0.24). It degrades F6P, which is in near equilibrium with the PTS inhibitor G6P because of the fast reversible reaction of PGI.
On the other hand, G6PDH exerts a high control on glucose uptake (FCC = 0.11). it is a G6P-consuming reaction. The PTS is also inhibited by its product, pyruvate. Accordingly, the pyruvate-degradating enzyme, PDH, also has a high control on the network (FCC = 0.11).
Reference:
[1] Christophe Chassagnole, Dynamic modeling of the central carbon metabolism of Escherichia coli, Biotechnology AND Bioengineering, 2002, Vol. 79, No. 1.
[2] Z.Zi, Sensitivity analysis approaches applied to systems biology models, IET Syst. Biol, 2011, Vol. 5, Iss. 6, pp. 336-346.