 "
"
Team:SydneyUni Australia/Modelling Model
From 2013.igem.org

Table of Contents
1 - Schematic of Engineered Metabolic pathway
2 - ODE Model
3 - General Information regarding the Enzymes Involved in the Metabolic Pathway
A Schematic of the Engineered Metabolic Pathway:
<img src="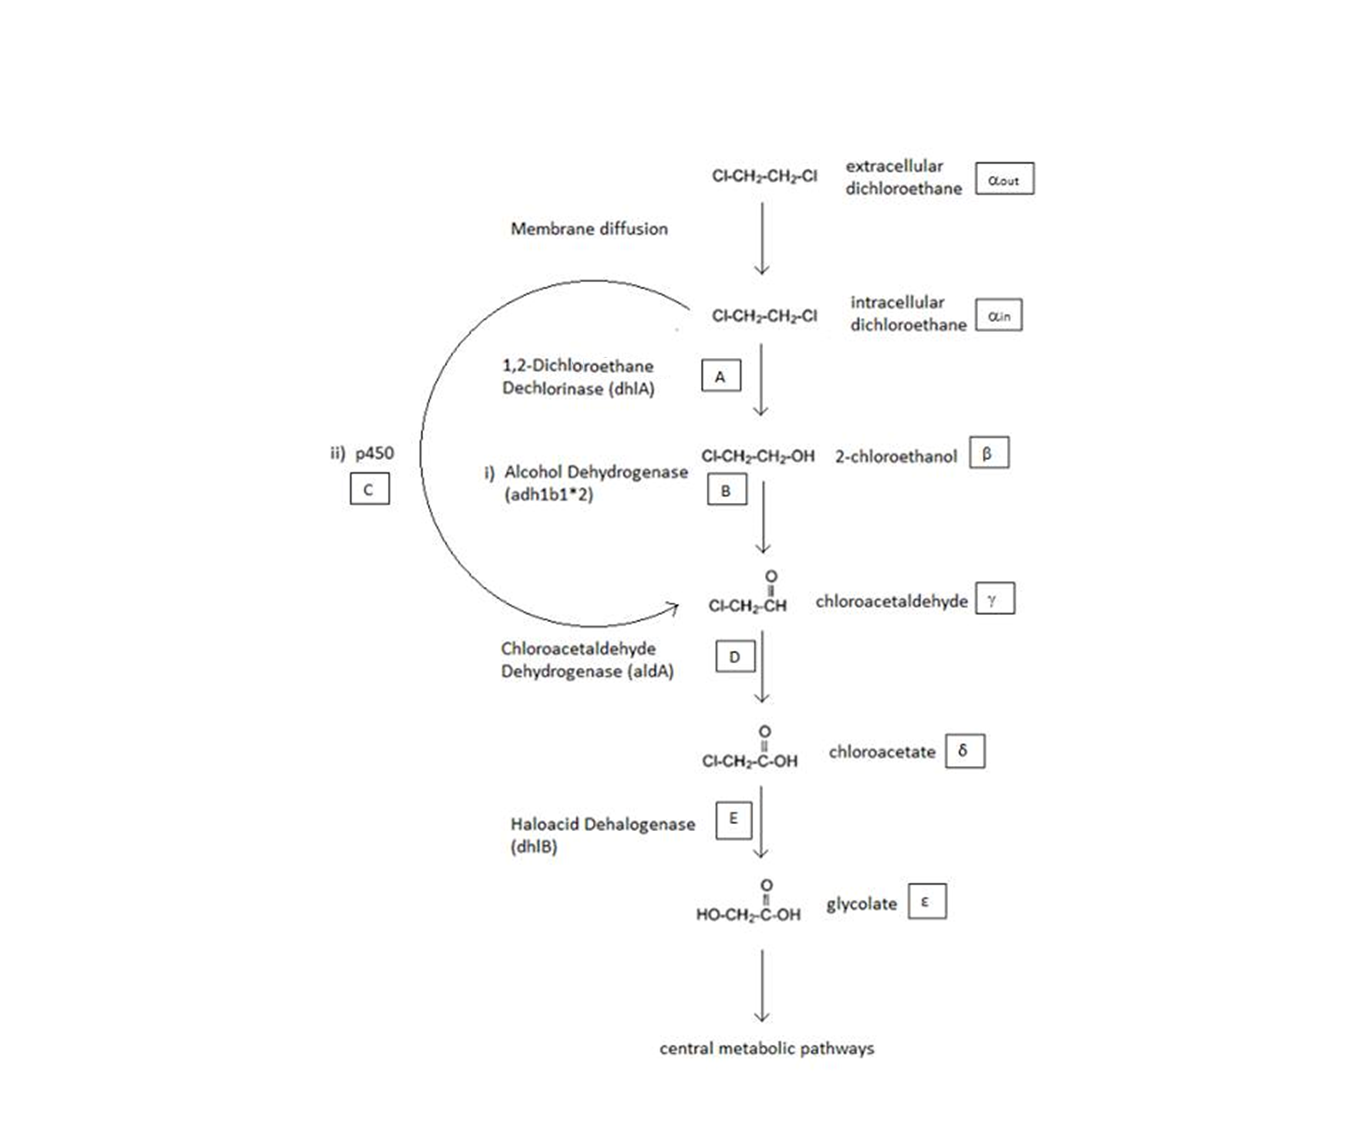 " width="900"></html>
ODE Model
Shown below are the two systems of ODEs we used to model each pathway.
The non-monooxygenase pathway (with dhlA (A) and adh1b1*2 (B)).

The monooxygenase pathway (with p450 (C)).

Generally, each line represents how a metabolic intermediate changes over time; this is dictated by the relative rate at which the intermediate is formed vs. the rate at which it is removed.
The two above systems of ODEs were used to model two things:
1. The rate at which extracellular DCA is removed from solution (given the number of cells in solution). This is considering the rate at which DCA crosses the plasma membrane (from solution to cytoplasm) of all cells in solution.
2. The rate at which the intracellular concentrations of the metabolic intermediates change over time within a single cell. This considers the relative activities of the enzymes of the metabolic pathway.
Notation
- The symbols A, B, C, D & E represent the intracellular enzyme concentrations of 1,2-Dichloroethane Dechlorinase, Alcohol Dehydrogenase, Cytochrome p450, Chloroacetaldehyde Dehydrogenase and Haloacetate Dehydrogenase respectively. They have units of mM.
- The symbols αin, β, γ, δ and ε represent the intracellular concentrations of the metabolic intermediates DCA, 2-chloroethanol, chloroacetaldehyde, chloroacetate and glycolate respectively. They have units mM. αout represents the extracellular concentration of DCA, i.e. the concentration of DCA in solution. It has units mM.
- The symbol Ψ represents the concentration of cells in solution and has units cells/mL.
- The function J(αout,αin) represents the rate which extracellular DCA moves across the plasma membrane and into the single cell (the flux rate). It is a function of the extra and intracellular concentrations of DCA and has a value of surface area per time m2s-1. The value S represents the average surface area of the cellular membrane of E. coli. By multiplying S by J one achieves the total amount of DCA flowing into a single cell per unit time. The total amount of DCA flowing from solution is achieved by multiplying Ψ by S and J.
General Information regarding the Enzymes Involved in the Metabolic Pathway
| Enzyme | Gene | Symbol | Constants | Substrate | Product | Ref |
|---|---|---|---|---|---|---|
| 1,2-Dichloroethane Dechlorinase | dhlA | A | KM A = 0.53 mM, kcat A = 3.3 s-1 | DCA (αin) | 2-chloroethanol (β) | [1] |
| Alcohol Dehydrogenase | Adhlb 1/2* | B | KM B = 0.94 mM, kcat B = 0.0871 s-1 | 2-chloroethanol (β) | chloroacetaldehyde (γ) | [2] |
| p450 | p450 | C | KM C = 0.120 mM, kcat C = 0.0113 s-1 | DCA (αin) | chloroacetaldehyde (γ) | [3] |
| Chloroacetaldehyde Dehydrogenase | aldA | D | KM D = 0.06 mM, kcat D = 0.60 s-1 | chloroacetaldehyde (γ) | chloroacetate (δ) | [4] |
| Haloacetate Dehydrogenase | dhlB | E | KM E = 20 mM, kcat E = 25.4 s-1 | chloroacetate (δ) | glycolate (ε) | [5] |
With thanks to:

