 "
"
File:4cmh2.jpg
From 2013.igem.org
Size of this preview: 504 × 600 pixels
Full resolution (1,220 × 1,452 pixels, file size: 139 KB, MIME type: image/jpeg)
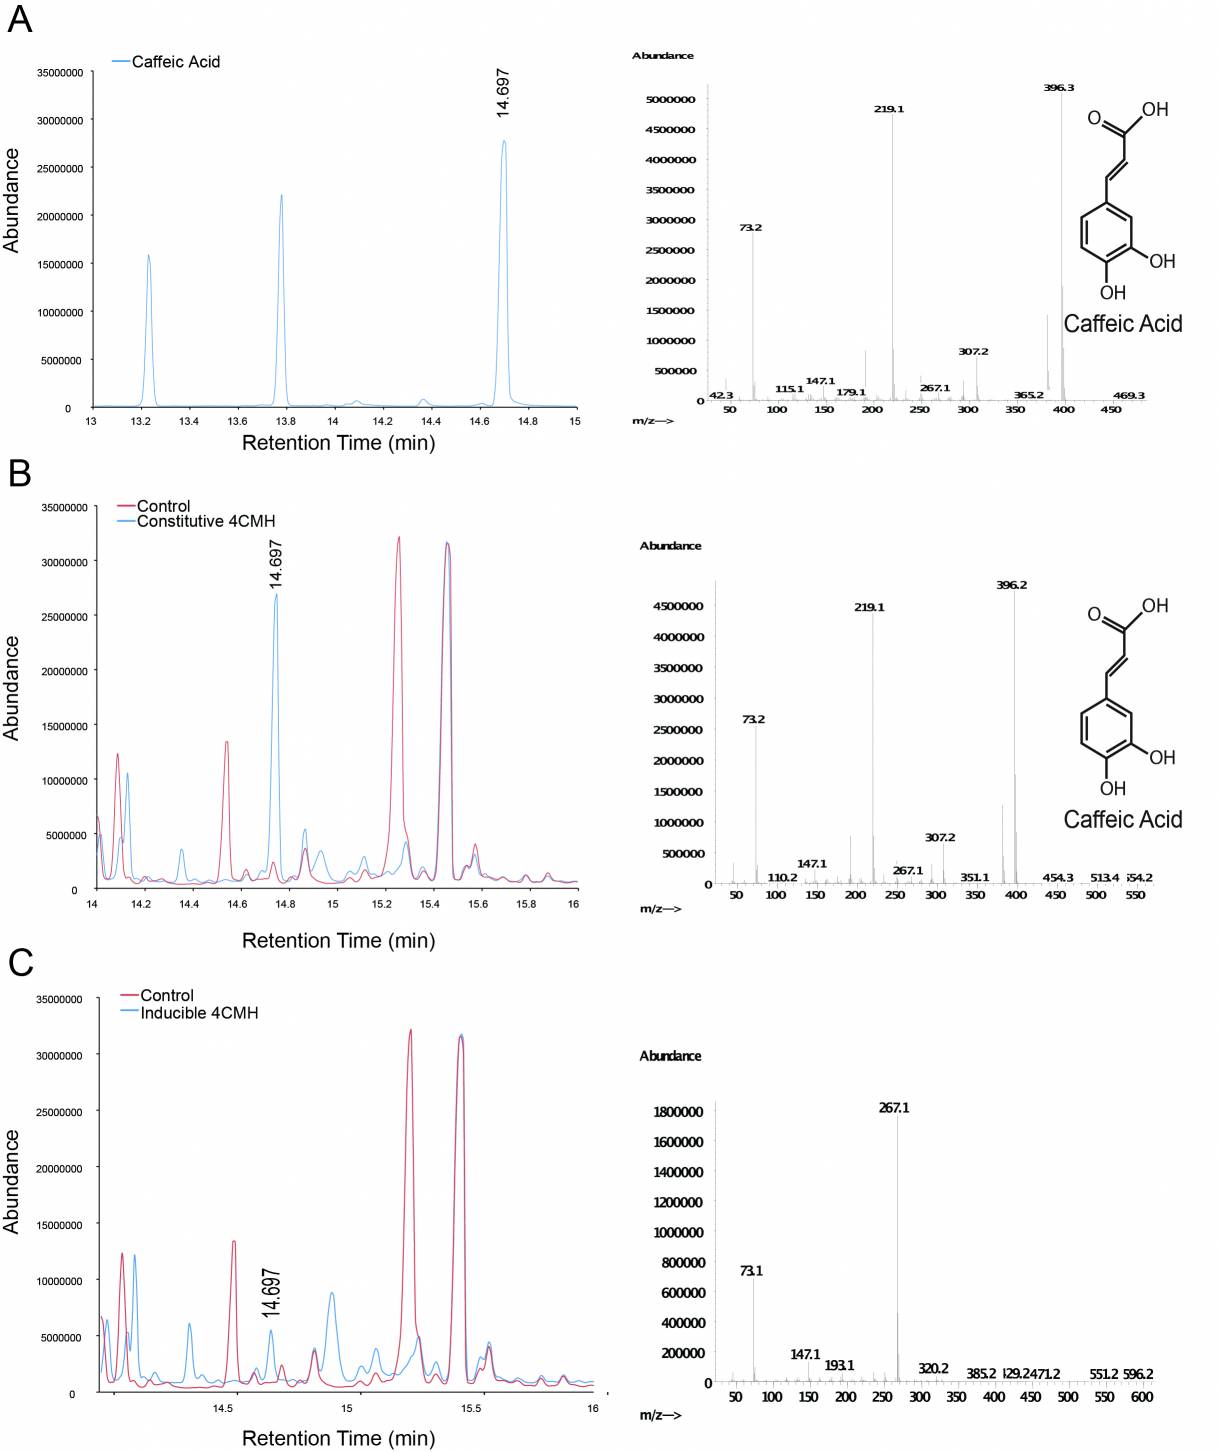
Figure 3. Compound generation identification by GC-MS. Chromatograms and mass spectra for select peaks are shown. Structures represent predictions based on library matching or comparison to standards. Controls represent plasmids missing the gene of interest. A) Internal control using caffeic acid. B) Conversion of p-coumaric acid to caffeic acid by constitutive expressed 4CMH. C) Possible conversion of p-coumaric acid to caffeic acid by inducibly expressed 4CMH. The mass spectrum however is confounded by another compound.
File history
Click on a date/time to view the file as it appeared at that time.
| Date/Time | Thumbnail | Dimensions | User | Comment | |
|---|---|---|---|---|---|
| current | 00:26, 28 September 2013 | | 1,220×1,452 (139 KB) | Fisal (Talk | contribs) | ( Figure 3. Compound generation identification by GC-MS. Chromatograms and mass spectra for select peaks are shown. Structures represent predictions based on library matching or comparison to standards. Controls represent plasmids missing the gene of inte) |
File links
There are no pages that link to this file.