 "
"
File:LSSmOrange Diagramm.png
From 2013.igem.org
Size of this preview: 800 × 394 pixels
Full resolution (864 × 426 pixels, file size: 45 KB, MIME type: image/png)
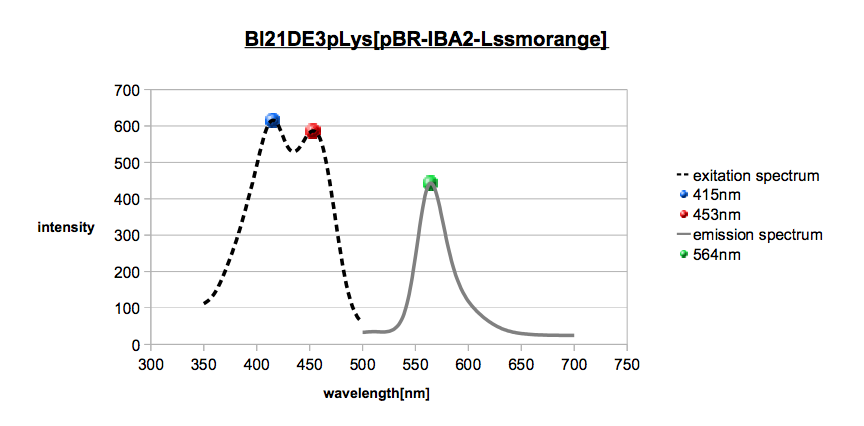
Excitation Spectrum (dashed line) and emission spectrum (solid line) from LssmOrange with marked maximums.
File history
Click on a date/time to view the file as it appeared at that time.
| Date/Time | Thumbnail | Dimensions | User | Comment | |
|---|---|---|---|---|---|
| current | 19:20, 4 October 2013 | | 864×426 (45 KB) | Kai15 (Talk | contribs) | (Excitation Spectrum (dashed line) and emission spectrum (solid line) from LssmOrange with marked maximums. ) |
File links
There are no pages that link to this file.