Team:Clemson/Notebook
From 2013.igem.org
m |
m |
||
| Line 83: | Line 83: | ||
|} | |} | ||
<br> | <br> | ||
| - | Figures 3A and 3B show the response of the UB and USAB, respectively, to AHL (5nM), “model pathogen” ( | + | Figures 3A and 3B show the response of the UB and USAB, respectively, to AHL (5nM), “model pathogen” (1x10^5 cells/mL), or RFP strain (the non-AHL-producing model pathogen at 1x10^5 cells/mL). Unexpectedly, the relative GFP emission appears to increase over time regardless of whether the strain present produces AHL. This could mean the fluorescence is increasing only as the biosensor strain grows, with GFP expression per cell remaining relatively constant. However, the presence of AHL does seem to increase the slope of fluorescence. |
<br> | <br> | ||
{| | {| | ||
Revision as of 03:49, 28 September 2013
Notebook
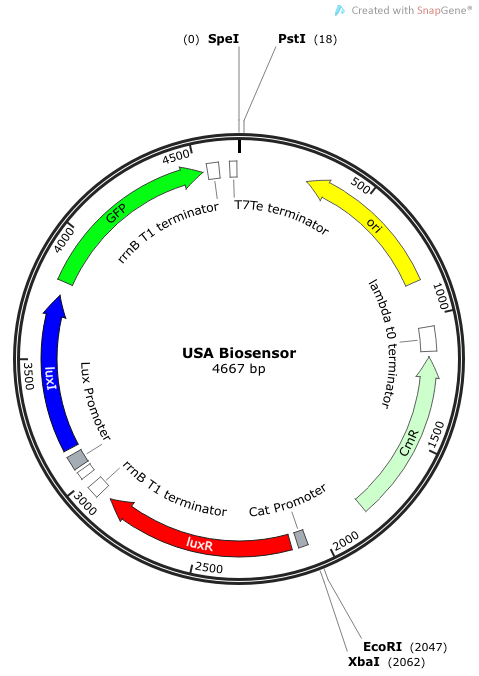
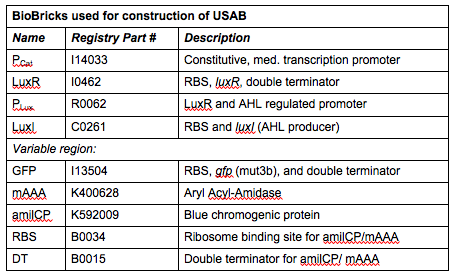
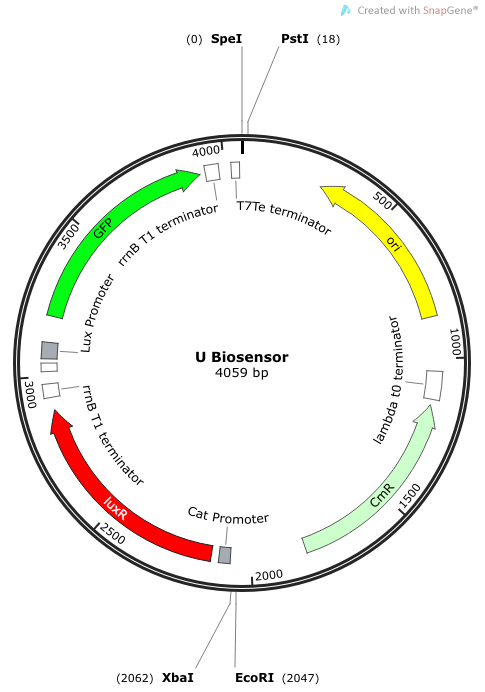
Rationale: I14033 was used because the medium transcription rate would be less energetically burdensome on the cell, and this seemed reasonable for a transcriptional regulator. The purpose of having I0462, R0062, and C0261 was to create a positive feedback loop. I0462 would be activated by an outside source of AHLs thereby activating R0062. R0062 would then drive transcription of C0261 to express LuxI, which is responsible for synthesizing more AHLs to drive I0462. This positive feedback loop is what makes the sensor self-amplifying, thus making a very minute signal from a pathogen become more detectable in smaller concentrations. Detection is made possible by GFP or the colorimetric proteins amilCP and mAAA.
Note: We also constructed prototype operons composed of the BioBrick parts R0010 (lac promoter) and I13504 (RBS-GFP-DT), or B0034-K400628-B0015 (mAAA version), or B0034-K592009-B0015 (amilCP version). We qualitatively determined that ligation of R0010 and I13504 and the subsequent transformation of R0010 + I13504 into E. coli was functional due to green florescence under UV light. We were never able to see blue color formation from amilCP or red color formation from mAAA. There may have been a mistake in our process for amilCP (e,g, missing RBS perhaps) to account for our results. See our “Experience” page for mAAA for more info on that.
Phase II: Construction of “Model Pathogen”
We needed a bacterium that would produce an initial AHL signal to stimulate the USAB. Eventually a similar construct would be delivered via phage to specific pathogens, but for now we needed an easy way to test the self-amplifiying ability of our USAB.
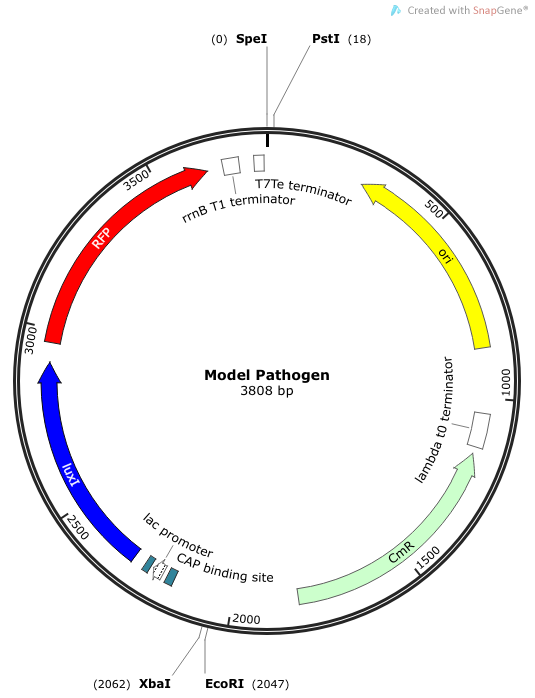
Rationale: The “model pathogen” provides the exogenous AHL source that functions to drive the positive feedback loop in the USA Bio-sensor. Due to time constraints, this was the only viable option. The “model pathogen” is supposed to represent a target pathogen infected by a bacteriophage engineered with the R0010-C0261-I13507 sequence that would later go into a lysogenic state allowing the target pathogen to express the prophage’s foreign DNA containing C0261. The construction of the modified phage is for future work. The RFP serves as a reporter gene to indirectly verify and measure the expression of LuxI and AHL.
Construction of luxI— “model pathogen”
This is very similar to the “model pathogen” described above, but lacking the C0261 BioBrick part.
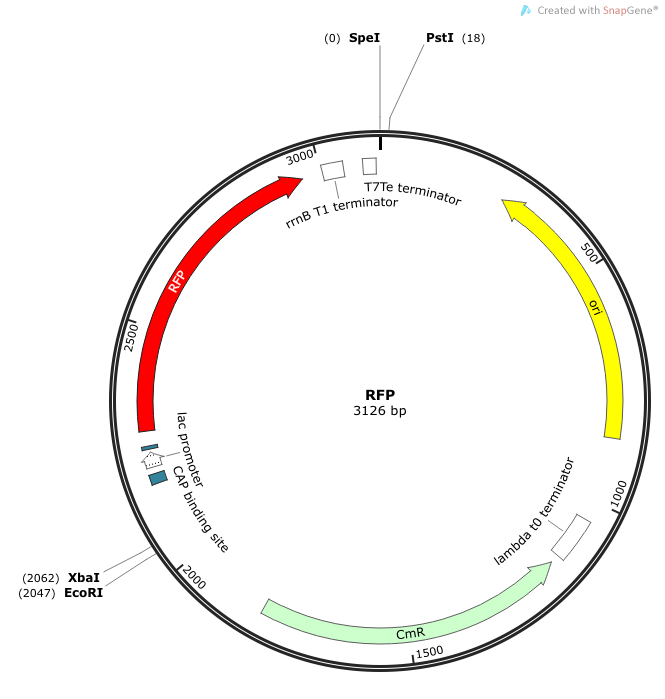
Rationale: The luxI-- “model pathogen” construct serves as a negative control for the sake of testing the sensitivity and functionality of the USAB. We wanted to see a high signal output only for the AHL producing model pathogen, but no signal output for the non-AHL-producing strain.
Phase III: Construction of Non-Self-Amplifying Bio-Sensor
We synthesized a construct for a non-self-amplifying bio-sensor. This would be identical to the USAB but without luxI. This would remove the positive feedback/self-amplifying nature, and the biosensor would then depend wholly on the exogenous source of AHL from the model pathogen for induction.
Rationale: A non-amplifying bio-sensor was created in order to compare and test the effectiveness of the self-amplifying module from our USAB. We expect to see a marked increase of signal strength of the USAB over the non-self-amplifying biosensor.
Phase IV: Testing the Biosensors
E. coli DH10B cultures hosted all the plasmid constructs. A total of four cultures were used: the universal sef-amplified biosensor (USAB), the universal non-self-amplified biosensor (UB), the “model pathogen” (MP), and the negative control non-AHL-producing “model pathogen” (RFP). See above for details on the plasmid constructs of each culture.
Cultures of USAB, UB, MP, and RFP were inoculated into M9 Miller medium supplemented with glucose, thiamine, casamino acids, and IPTG. These cultures were grown overnight at 37oC with shaking. The following day, the cultures were harvested by centrifugation, washed, and resuspended in fresh medium. They were then diluted 1:100 into fresh medium and incubated further. The OD600 was not allowed to surpass 0.1 to keep them in very early log phase. After a few generations of growth (determined via increase in OD600) the cultures were again harvested and resuspended in fresh medium to set concentrations—1x10^7 cells/mL of the biosensor cultures (UB and USAB), and 1x10^3 cells/mL or a maximum of 1x10^5 cells/mL for the MP and RFP cultures.
(Previously, serial dilutions of all cultures were tested for GFP fluorescence to determine the optimal concentration of various cultures—data not shown.)
Serial 50% dilutions of MP, RFP (negative control), and AHL (positive control) were set up in a black 96-well plate. The final concentrations would range from 1x10^5 – 7.8x10^2 cells/mL for MP and RFP or 5nM – 39µM for AHL. The purified AHL (3-oxohexanoyl-homoserine lactone) was obtained from Sigma-Aldrich. USAB or UB was added to all wells to a final concentration of 1x10^7 cells/mL.
GFP fluorescence was measured periodically with an excitation wavelength of 395nm and emission of 509nm. (Note: The peak excitation of GFP mut3b (BBa_E0040) has been measured at 501nm, but our fluorescent plate reader would not read emission properly so close to the excitation value.) We took readings up to about 20 hours.
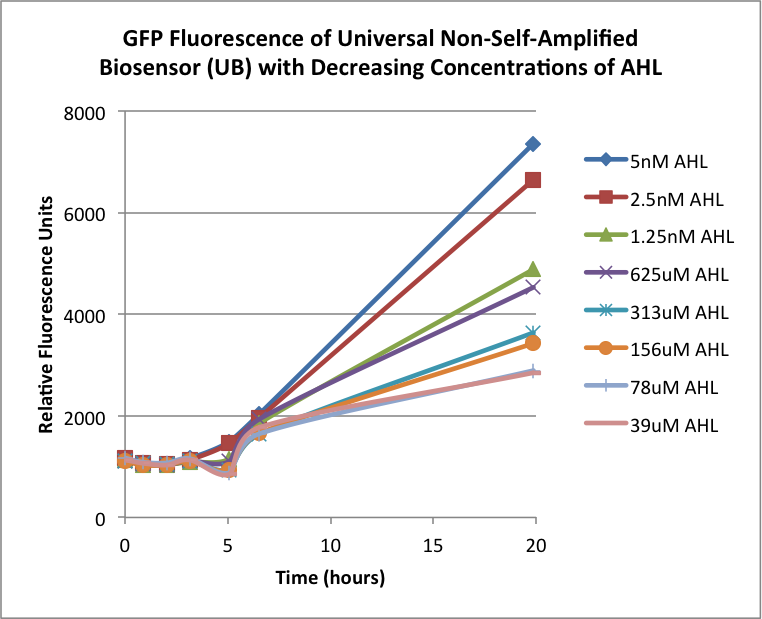
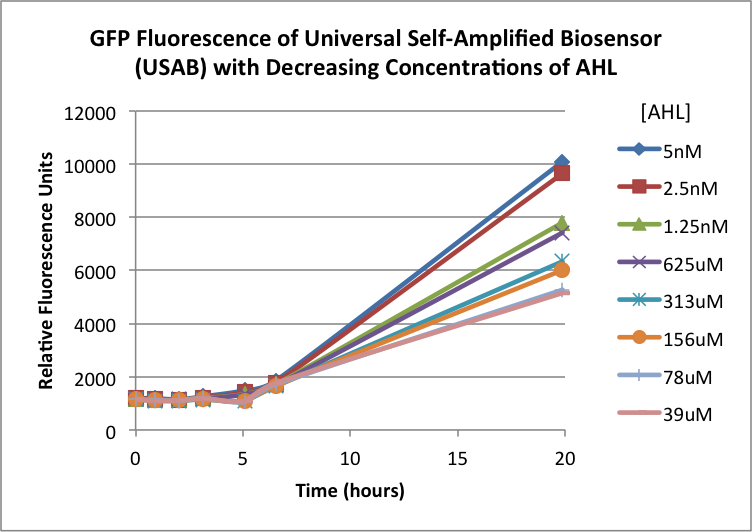
The first graphs (Figure 1A and 1B) show the response of the UB and USAB, respectively, to different concentrations of AHL. As expected, higher concentrations of AHL cause relatively higher GFP emission over time.
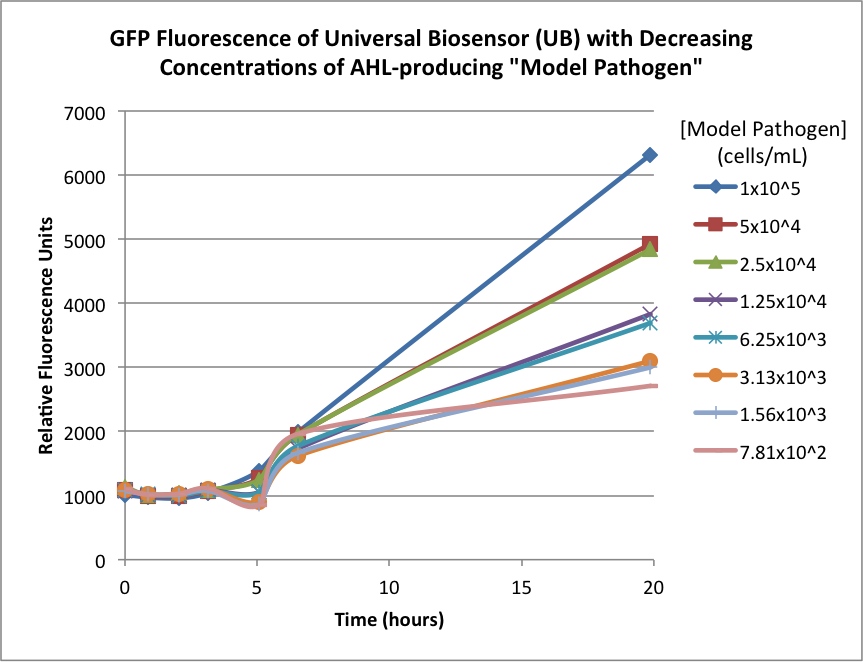
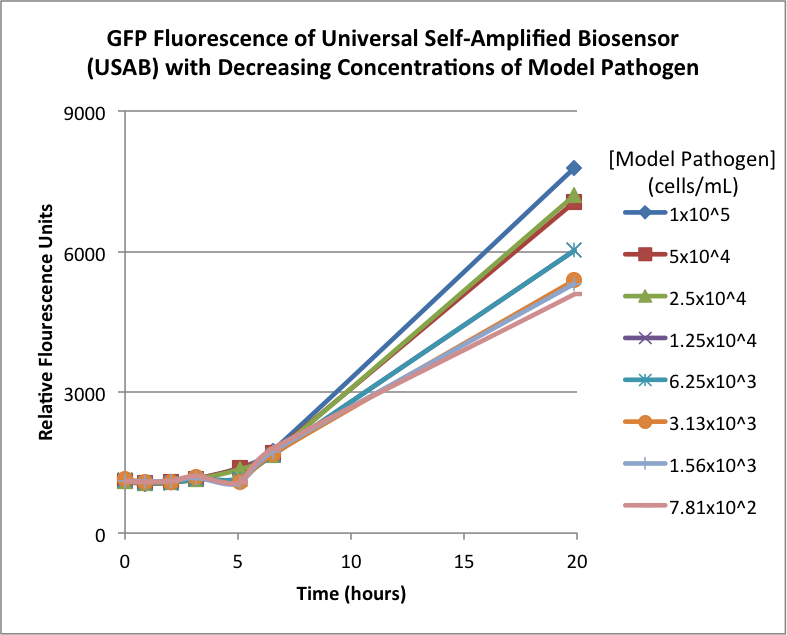
Figures 2A and 2B show the response of the UB and USAB, respectively, to different concentrations of the “model pathogen.” As expected, higher concentrations of the “model pathogen,” which produces AHL, cause relatively higher GFP emission over time.
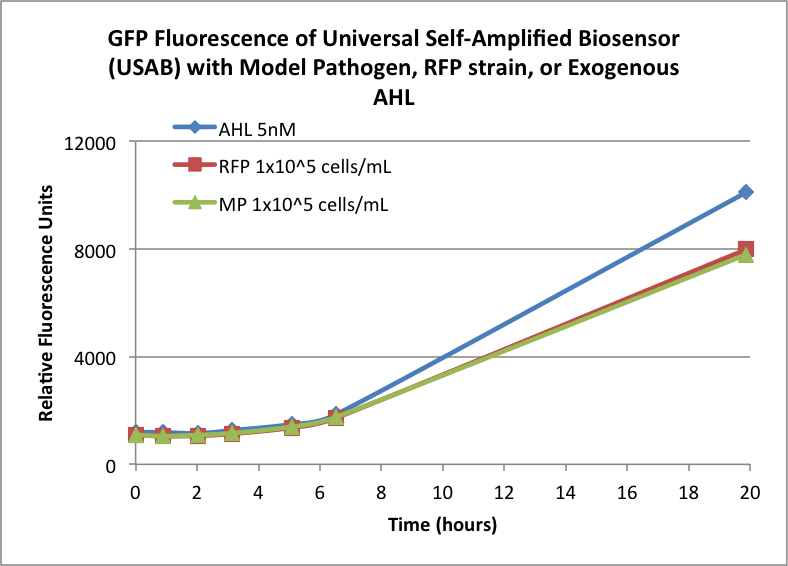
Figures 3A and 3B show the response of the UB and USAB, respectively, to AHL (5nM), “model pathogen” (1x10^5 cells/mL), or RFP strain (the non-AHL-producing model pathogen at 1x10^5 cells/mL). Unexpectedly, the relative GFP emission appears to increase over time regardless of whether the strain present produces AHL. This could mean the fluorescence is increasing only as the biosensor strain grows, with GFP expression per cell remaining relatively constant. However, the presence of AHL does seem to increase the slope of fluorescence.
 "
"

