Team:DTU-Denmark/Notebook/22 August 2013
From 2013.igem.org
(→Main purpose) |
(→Conclusion) |
||
| (17 intermediate revisions not shown) | |||
| Line 1: | Line 1: | ||
{{:Team:DTU-Denmark/Templates/StartPage|22 August 2013}} | {{:Team:DTU-Denmark/Templates/StartPage|22 August 2013}} | ||
| - | + | Navigate to the [[Team:DTU-Denmark/Notebook/21_August_2013|Previous]] or the [[Team:DTU-Denmark/Notebook/23_August_2013|Next]] Entry | |
=lab 208= | =lab 208= | ||
<hr/> | <hr/> | ||
==Main purpose== | ==Main purpose== | ||
<hr/> | <hr/> | ||
| + | *USER reaction | ||
| + | *PCR for biobrick parts | ||
| + | *gel purification of pZA21::ara with USER endings | ||
| + | *colony PCR | ||
==Who was in the lab== | ==Who was in the lab== | ||
| Line 55: | Line 59: | ||
Gel purified the linearized plasmid pZA21::ara with USER endings | Gel purified the linearized plasmid pZA21::ara with USER endings | ||
| - | ===colony | + | ===colony PCR to verify AMO insert=== |
Picked 10 colonies from yesterday's cloning for colony PCR. Diluted cells in 50 uL of MilliQ and took 1 uL as template | Picked 10 colonies from yesterday's cloning for colony PCR. Diluted cells in 50 uL of MilliQ and took 1 uL as template | ||
| Line 89: | Line 93: | ||
<hr/> | <hr/> | ||
| + | Purification of plasmids containing the araBAD SPL and RFP successful but with varying concentration. | ||
=lab 115= | =lab 115= | ||
| Line 104: | Line 109: | ||
<hr/> | <hr/> | ||
| - | Adjusting the temperature at | + | Adjusting the temperature at 36 degrees and calibrating the probes as described in [[Team:DTU-Denmark/Methods/Calibrating_Electrodes|Calibration protocol]]. |
| Line 111: | Line 116: | ||
Changing the steps : | Changing the steps : | ||
| - | 6. | + | 6. 4 ml of the overnight culture growing in DM minimal medium |
| - | + | 12. The OD was measured OD=0.261 in sample A and OD=0.263 in sample B. | |
| - | + | 19. | |
| + | * For sample A after taking the first sample, we continue with two more samples after 5 and 10 minutes. Then we add 2 ml of nitrite solution and continue by taking a sample after spiking. Then we took three more samples and after 15 minutes we spike with 2 ml of nitrite, and finally we took a last sample. The final OD measurement was OD=0.244 and the temperature was 36.8 degrees. | ||
| - | + | * For sample B after taking the first sample, we continue with two more samples after 5 and 10 minutes. Then we add 1 ml of nitrite solution and continue by taking a sample after spiking. Then we took two more samples and after 10 minutes we spike with 4 ml of nitrite, and then there was a response after 12 minutes were finally we took one sample and after 5 minutes the last. The final OD measurement was OD=0.248 and the temperature was 36.4 degrees. | |
==Results== | ==Results== | ||
| Line 123: | Line 129: | ||
===Colorimetric results=== | ===Colorimetric results=== | ||
| - | |||
| - | ''Measuring range 2-75 mg/L NH<sub>4</sub>-N'' | + | '''Ranges''' |
| + | * ''Measuring range 2-75 mg/L NH<sub>4</sub>-N'' | ||
| + | * ''Measuring range 1-25 mg/L NO<sub>3</sub>-N'' | ||
| + | * ''Measuring range 0.02-1 mg/L NO<sub>2</sub>-N'' | ||
| - | |||
| - | + | Standard solutions | |
| + | * Ammonium - 66.6 mg/L (expected 39 mg/L) | ||
| + | * Nitrite - 0.72 mg/L (expected 0.5 mg/L) | ||
| + | * Nitrate - | ||
| - | |||
| + | '''For Sample A''' | ||
| + | {| class="wikitable" style="text-align: right" | ||
| + | ! time !! nitrite (mg/L)!! nitrate (mg/L) !! ammonium (mg/L) | ||
| + | |- | ||
| + | | 0 || <0.02 || <1 || 3.8 | ||
| + | |- | ||
| + | | 5 || <0.02 || <1 || <2 | ||
| + | |- | ||
| + | | 10|| <0.02 || <1 || 0.3 | ||
| + | |- | ||
| + | | spike || 0.7 || <1 || <2 | ||
| + | |- | ||
| + | | 15 || 0.7 || <1 || 0.7 | ||
| + | |- | ||
| + | | 20 || 0.71 || <1 || 0.2 | ||
| + | |- | ||
| + | | 25 || 0.72 || <1 || <2 | ||
| + | |- | ||
| + | | second spike || 1.46 || 1.7 ||2.7 | ||
| + | |- | ||
| + | | 35|| 1.42 || 1.6 || <2 | ||
| + | |- | ||
| + | |} | ||
| - | ''' | + | '''For Sample B''' |
| + | {| class="wikitable" style="text-align: right" | ||
| + | ! time !! nitrite (mg/L)!! nitrate (mg/L) !! ammonium (mg/L) | ||
| + | |- | ||
| + | | 0 || <0.02 || - || <2 | ||
| + | |- | ||
| + | | 5 || <0.02 || - || <2 | ||
| + | |- | ||
| + | | 10|| <0.02 || - || <2 | ||
| + | |- | ||
| + | | spike || 0.36 || - || <2 | ||
| + | |- | ||
| + | | 15 || 0.4 || - || <2 | ||
| + | |- | ||
| + | | 20 || 0.4 || <1 || <2 | ||
| + | |- | ||
| + | | second spike || 2.12 || 2.3 || <2 | ||
| + | |- | ||
| + | | 30 || 1.78 || 2.6 || 0.4 | ||
| + | |- | ||
| + | | 35 || 1.74 || 2.7 || <2 | ||
| + | |- | ||
| + | |} | ||
| - | + | === N<sub>2</sub>O measurement=== | |
| - | |||
| - | + | [[File:Dtu Experiment 2 round 2 --sample A.png|600px]] | |
| + | [[File:Dtu Experiment 2 round 2 -- sample B.png|600px]] | ||
| - | + | ==Conclusion== | |
| + | There was no response from native ''E.coli''. | ||
| - | |||
| - | |||
| - | |||
| - | |||
| - | |||
| - | |||
| - | |||
| - | |||
| - | |||
| - | |||
| - | |||
| - | |||
| - | |||
| - | |||
| - | |||
| - | |||
| - | |||
Latest revision as of 17:53, 28 September 2013
22 August 2013
Contents |
lab 208
Main purpose
- USER reaction
- PCR for biobrick parts
- gel purification of pZA21::ara with USER endings
- colony PCR
Who was in the lab
Kristian, Henrike
Procedure
USER ligation and transformation
Redid for HAO and cyc in arabinose inducible pZA21::araBAD and for Nir fragments
PCR for Biobrick parts
Set up a new PCR reaction for Biobrick parts using HF buffer and 5% DMSO but no MgCl2. PCR was run on a touchdown program
primers: 53a, 53b
template: Sec2 miniprep
program:
| temperature | time | cycles |
|---|---|---|
| 98C | 2:00 | - |
| 98C | 0:10 | 10 |
| 63C | 1:00 | 10 |
| -0.5C per cycle | ||
| 72C | 1:00 | 10 |
| 98C | 0:10 | 25 |
| 53C | 1:00 | 25 |
| 72C | 1:00 | 25 |
| 72C | 5:00 | - |
| 10C | hold | - |
Gel purification
Gel purified the linearized plasmid pZA21::ara with USER endings
colony PCR to verify AMO insert
Picked 10 colonies from yesterday's cloning for colony PCR. Diluted cells in 50 uL of MilliQ and took 1 uL as template
primers: 53a, 53b
program:
| temperature | time | cycles |
|---|---|---|
| 98C | 10:00 | - |
| 98C | 0:10 | 36 |
| 56C | 0:30 | 36 |
| 72C | 2:00 | 36 |
| 72C | 5:00 | - |
| 10C | hold | - |
Results
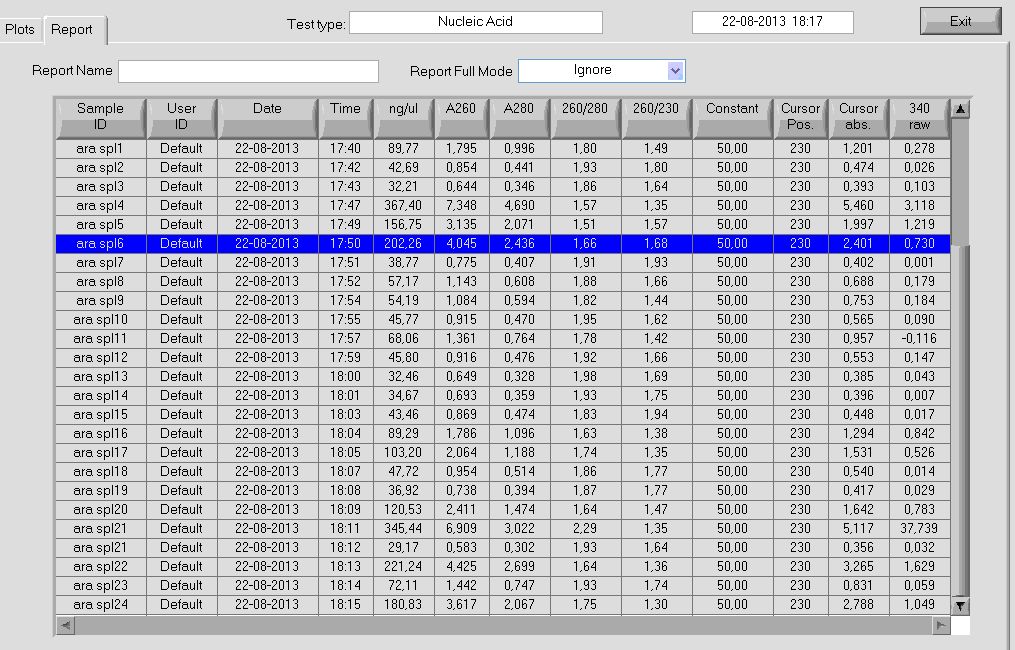
nanodrop measurement of ara spl plasmids
Conclusion
Purification of plasmids containing the araBAD SPL and RFP successful but with varying concentration.
lab 115
Main purpose
Run Experiment 2 in two different samples anaerobically in order to characterize the behavior of E.coli.
Who was in the lab
Ariadni, Helen
Procedure
Adjusting the temperature at 36 degrees and calibrating the probes as described in Calibration protocol.
Following the protocol Experiment 2
Changing the steps :
6. 4 ml of the overnight culture growing in DM minimal medium
12. The OD was measured OD=0.261 in sample A and OD=0.263 in sample B.
19.
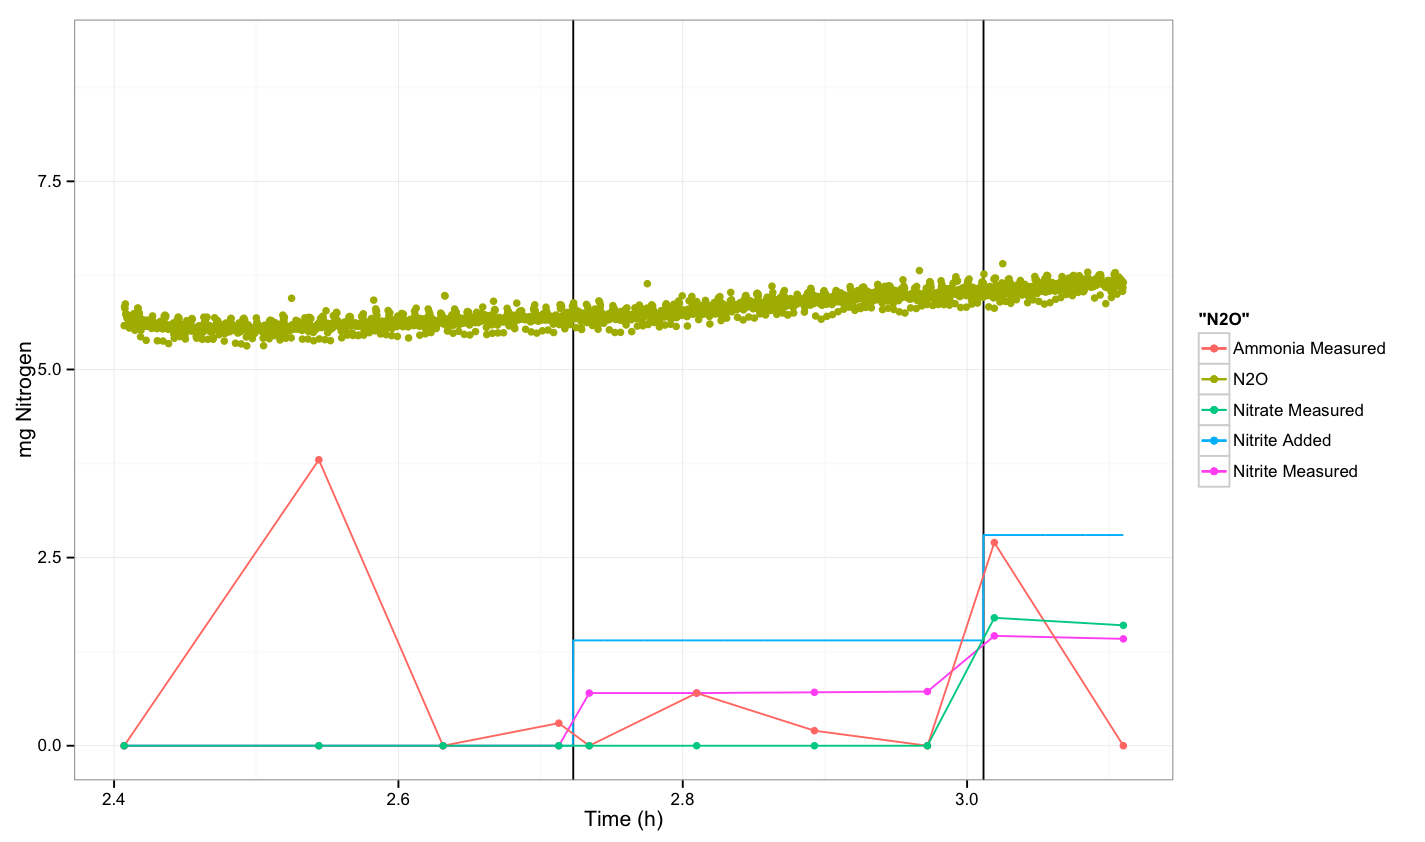
- For sample A after taking the first sample, we continue with two more samples after 5 and 10 minutes. Then we add 2 ml of nitrite solution and continue by taking a sample after spiking. Then we took three more samples and after 15 minutes we spike with 2 ml of nitrite, and finally we took a last sample. The final OD measurement was OD=0.244 and the temperature was 36.8 degrees.
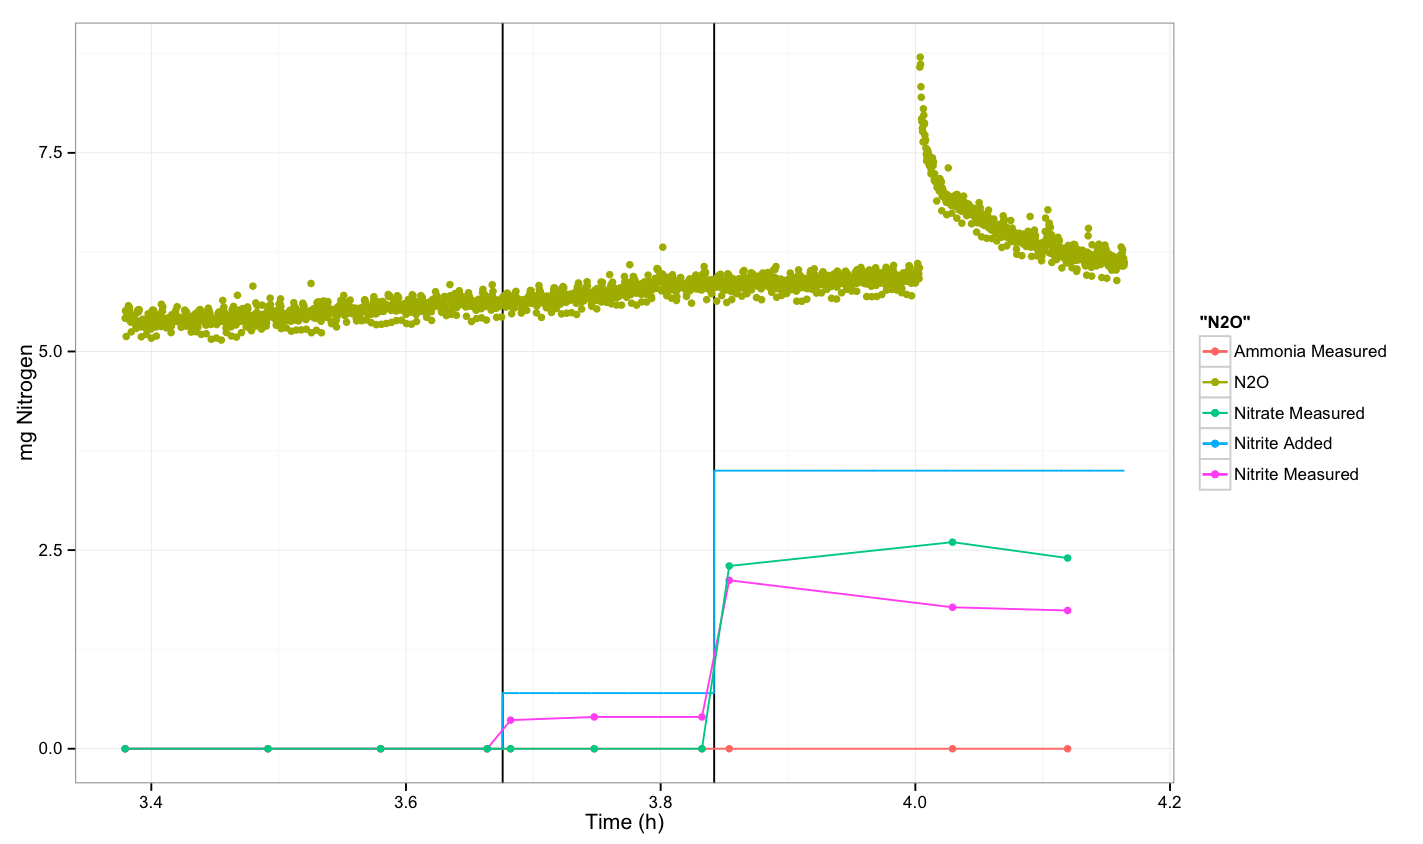
- For sample B after taking the first sample, we continue with two more samples after 5 and 10 minutes. Then we add 1 ml of nitrite solution and continue by taking a sample after spiking. Then we took two more samples and after 10 minutes we spike with 4 ml of nitrite, and then there was a response after 12 minutes were finally we took one sample and after 5 minutes the last. The final OD measurement was OD=0.248 and the temperature was 36.4 degrees.
Results
Colorimetric results
Ranges
- Measuring range 2-75 mg/L NH4-N
- Measuring range 1-25 mg/L NO3-N
- Measuring range 0.02-1 mg/L NO2-N
Standard solutions
- Ammonium - 66.6 mg/L (expected 39 mg/L)
- Nitrite - 0.72 mg/L (expected 0.5 mg/L)
- Nitrate -
For Sample A
| time | nitrite (mg/L) | nitrate (mg/L) | ammonium (mg/L) |
|---|---|---|---|
| 0 | <0.02 | <1 | 3.8 |
| 5 | <0.02 | <1 | <2 |
| 10 | <0.02 | <1 | 0.3 |
| spike | 0.7 | <1 | <2 |
| 15 | 0.7 | <1 | 0.7 |
| 20 | 0.71 | <1 | 0.2 |
| 25 | 0.72 | <1 | <2 |
| second spike | 1.46 | 1.7 | 2.7 |
| 35 | 1.42 | 1.6 | <2 |
For Sample B
| time | nitrite (mg/L) | nitrate (mg/L) | ammonium (mg/L) |
|---|---|---|---|
| 0 | <0.02 | - | <2 |
| 5 | <0.02 | - | <2 |
| 10 | <0.02 | - | <2 |
| spike | 0.36 | - | <2 |
| 15 | 0.4 | - | <2 |
| 20 | 0.4 | <1 | <2 |
| second spike | 2.12 | 2.3 | <2 |
| 30 | 1.78 | 2.6 | 0.4 |
| 35 | 1.74 | 2.7 | <2 |
N2O measurement
Conclusion
There was no response from native E.coli.
Navigate to the Previous or the Next Entry
 "
"


