Team:DTU-Denmark/pBAD SPL
From 2013.igem.org
(→Experimental procedure) |
(→Experimental procedure) |
||
| Line 18: | Line 18: | ||
# The constitutive promoter TODO:which was used as a reference. | # The constitutive promoter TODO:which was used as a reference. | ||
| - | [[File:AraSPL primer.png | + | [[File:AraSPL primer.png|thumb|center|Reverse primer sequence]] |
=== Data analysis === | === Data analysis === | ||
Revision as of 09:20, 3 October 2013
pBAD SPL
Contents |
pBAD synthetic promoter library
As a tool for expressing lethal proteins in E. coli we made a synthetic promoter library (SPL, [http://dspace.mit.edu/handle/1721.1/60080 RFC 63]) with the pBAD arabinose inducible promoter. The concept was taken from the DTU iGEM team from 2010.
Methods
Experimental procedure
- Random promoter sequences were ordered matching the sequence CTGACGNNNNNNNNNNNNNNNNNNTAWWATNNNNA.
- USER cloning to add RFP downstream of promoter.
- Colonies were plated.
- Plates were induced by spraying them with an aqueous arabinose solution.
- Colonies that were not red prior to induction with arabinose but that did turn red after induction with arabinose were selected and re-innoculated as liquid cultures.
- Biolector: Wells were inoculated from overnight cultures of each of the selected colonies. All wells were run in duplicate.
- All duplicate colonies were run twice -- once with arabinose added at t=0, and again without arabinose.
- The constitutive promoter TODO:which was used as a reference.
Data analysis
- Data was collected from the Biolector, and analyzed using a series of R scripts written by Chris Workman (unpublished).
- The maturation and degradation times for mCherry were both assumed to be 40 min. TODOref
- The growth rate, mu, was estimated to be 1.28 (from an average of all wells on all plates) since we expect each strain to grow at the same rate.
- A time window representing exponential growth was selected (between 1 and 4.5 hours).
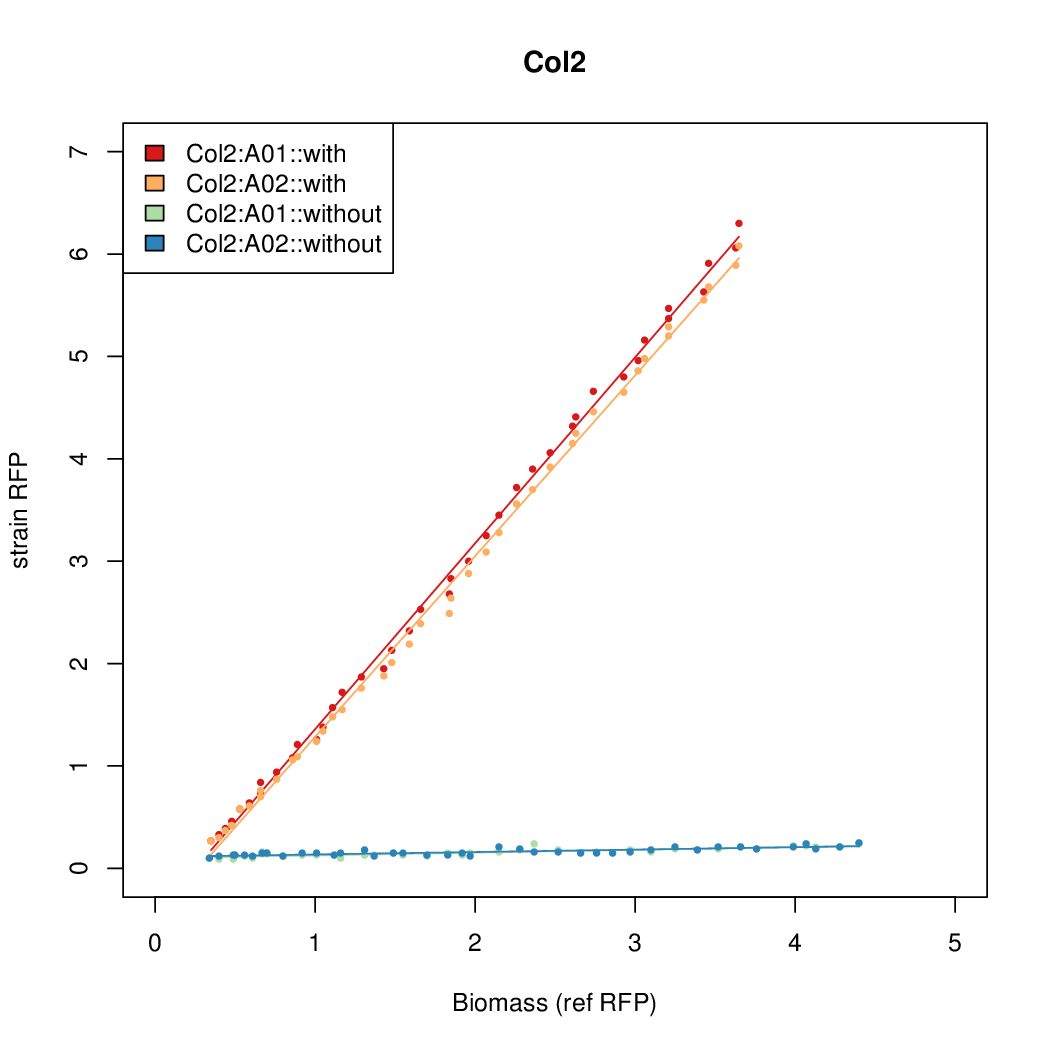
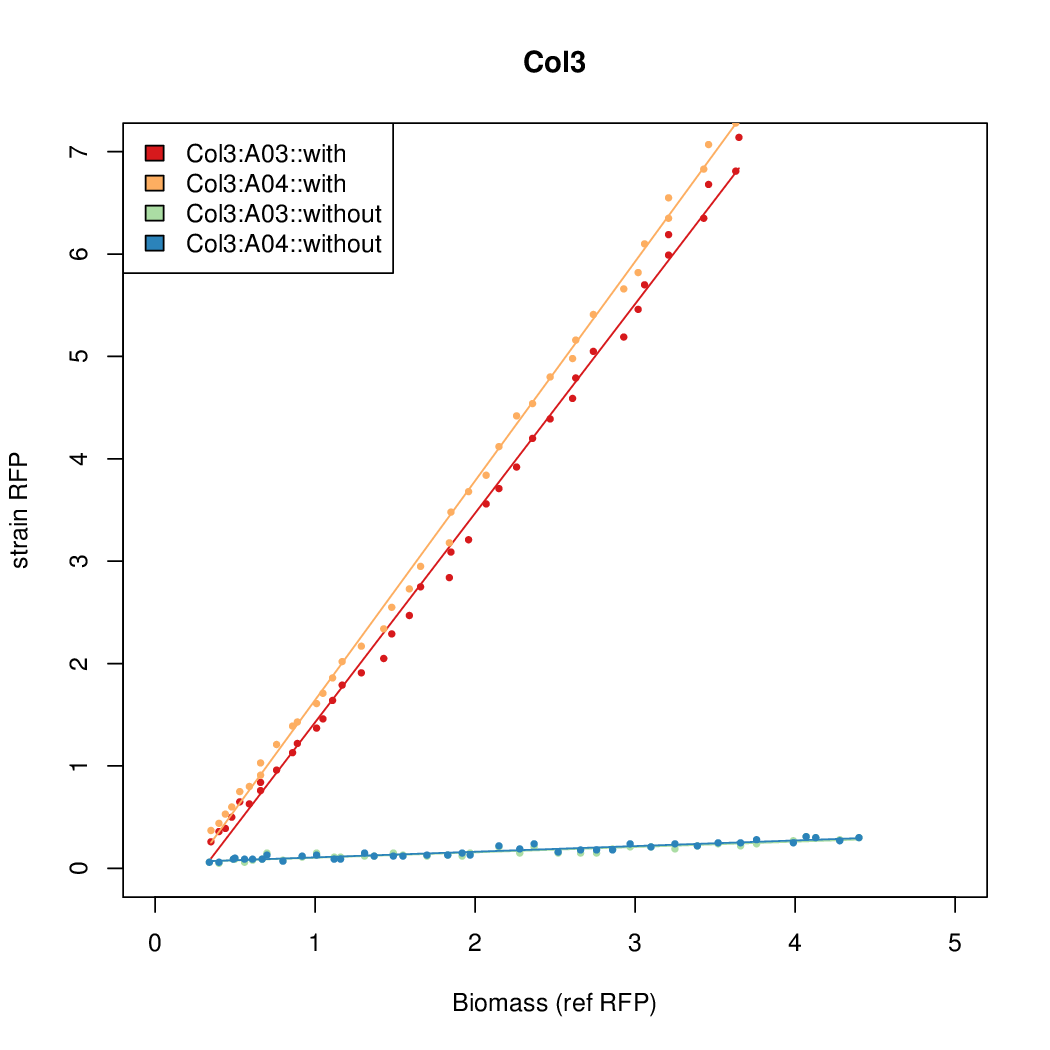
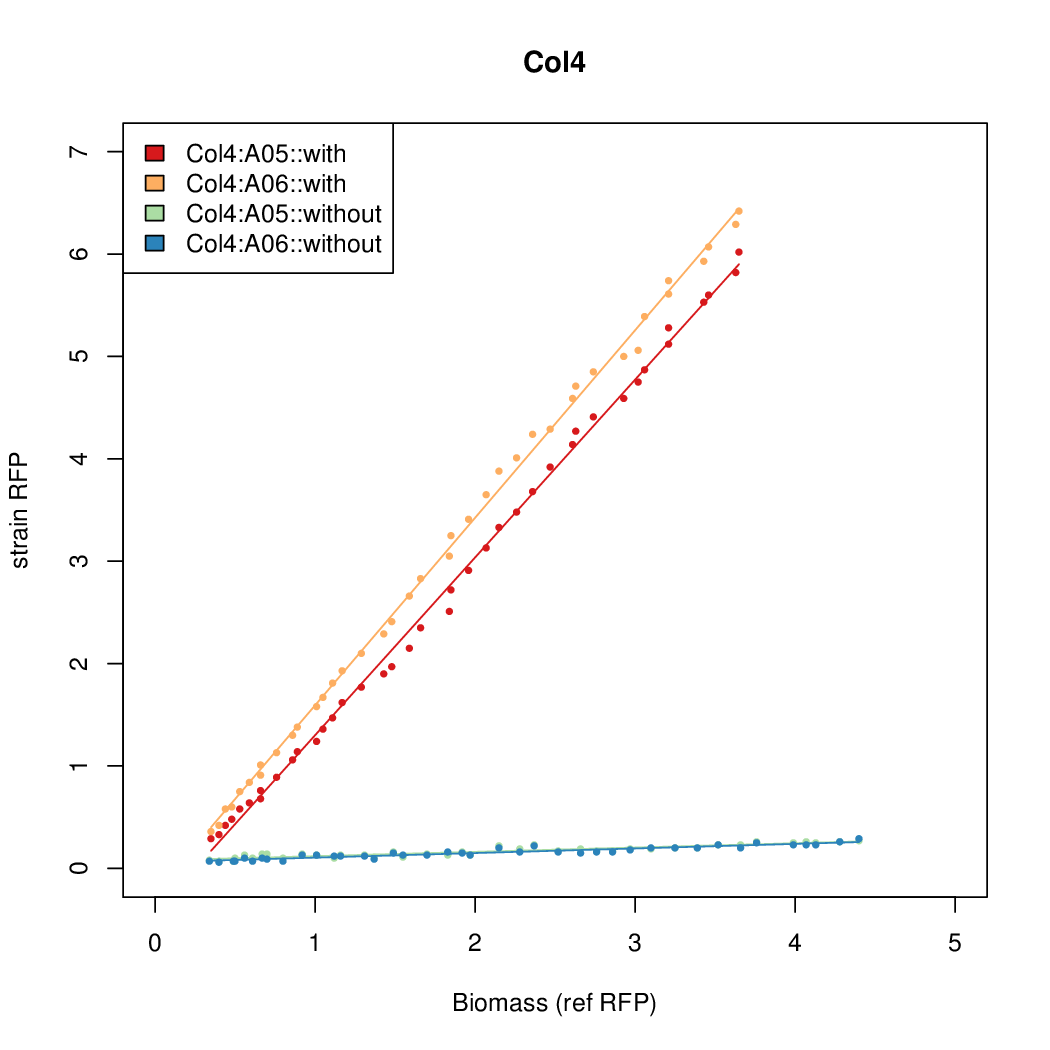
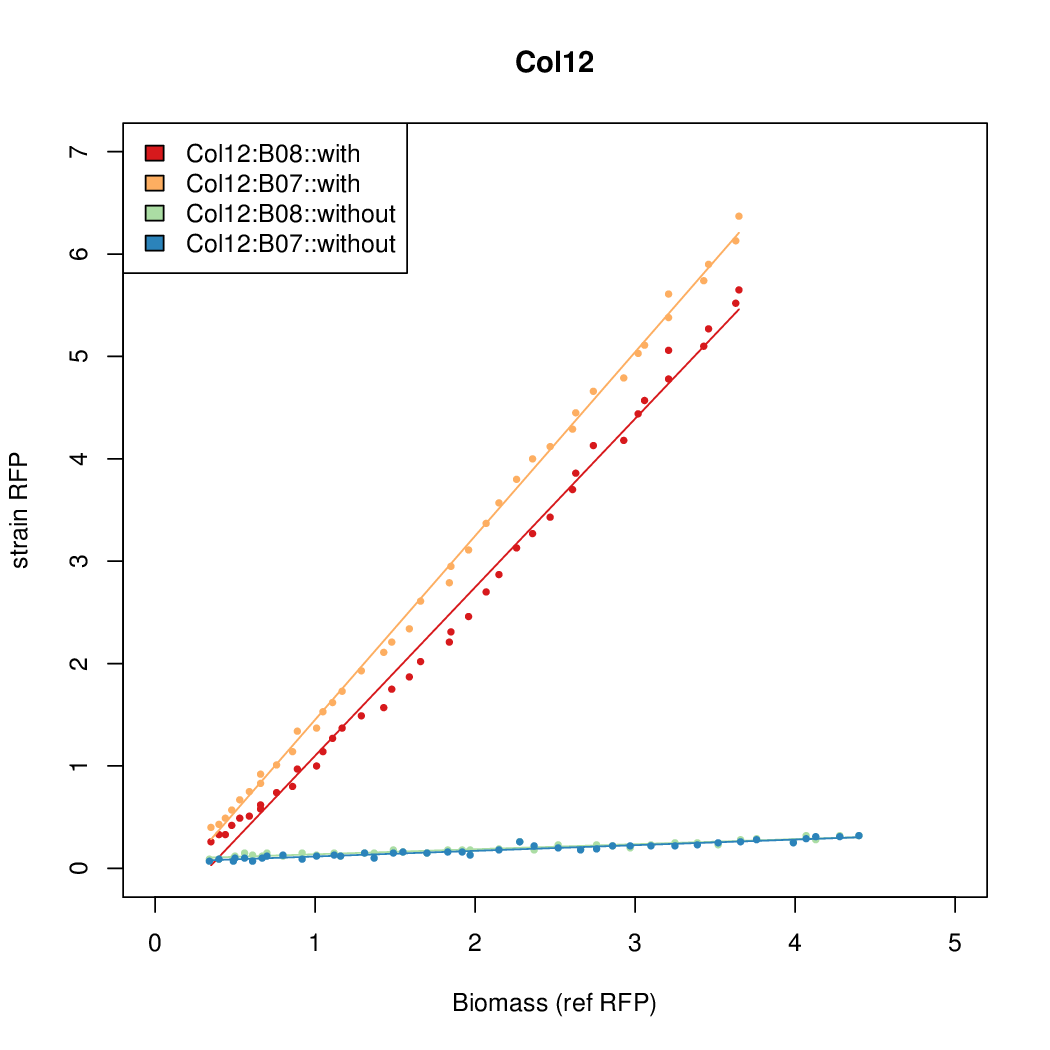
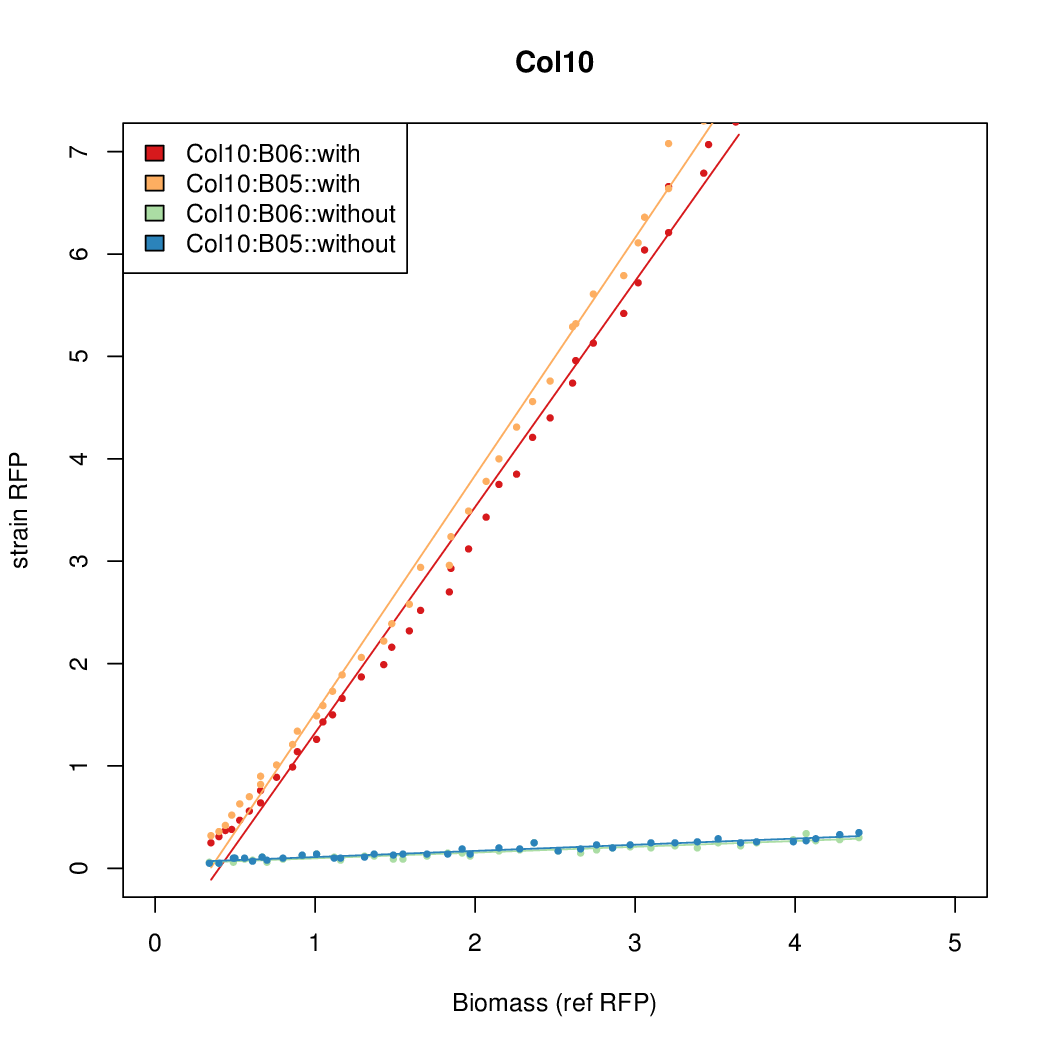
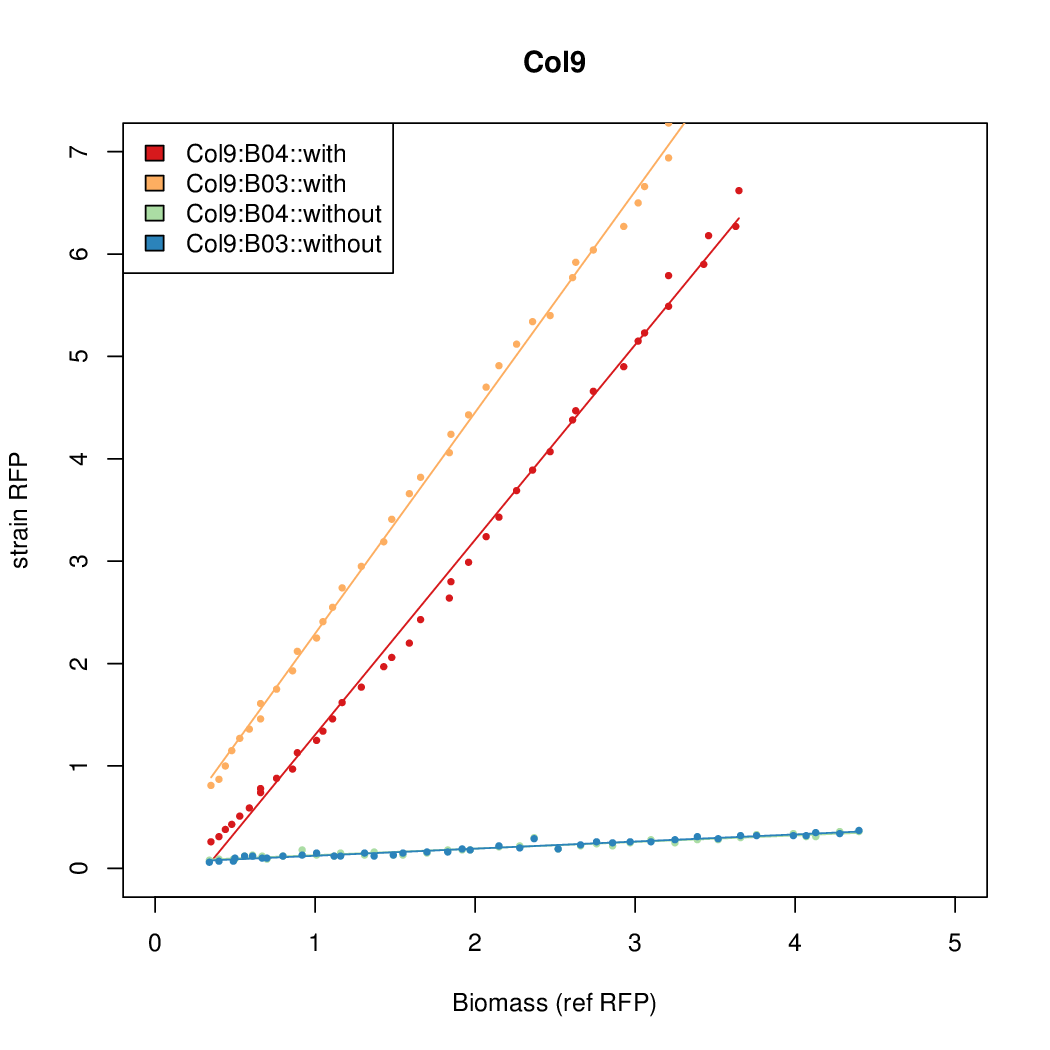
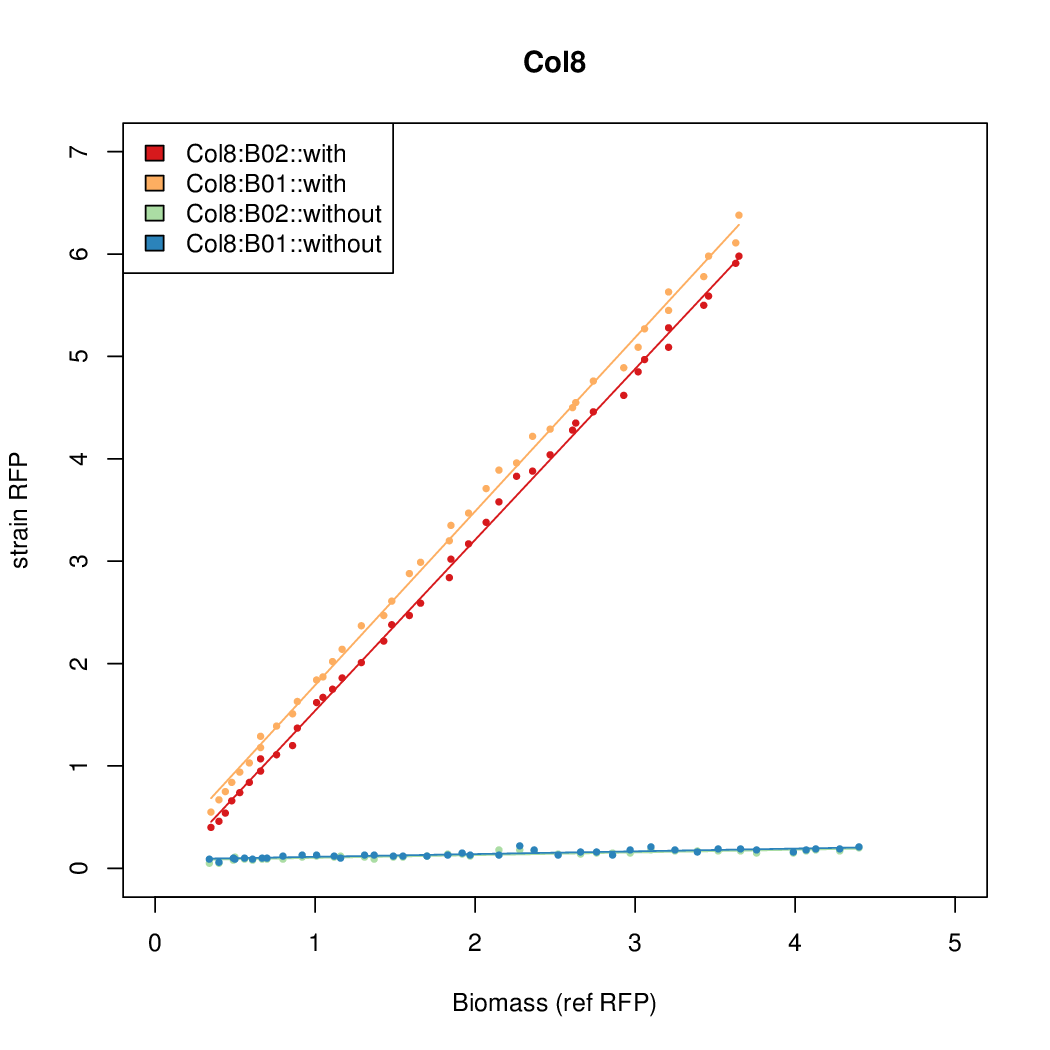
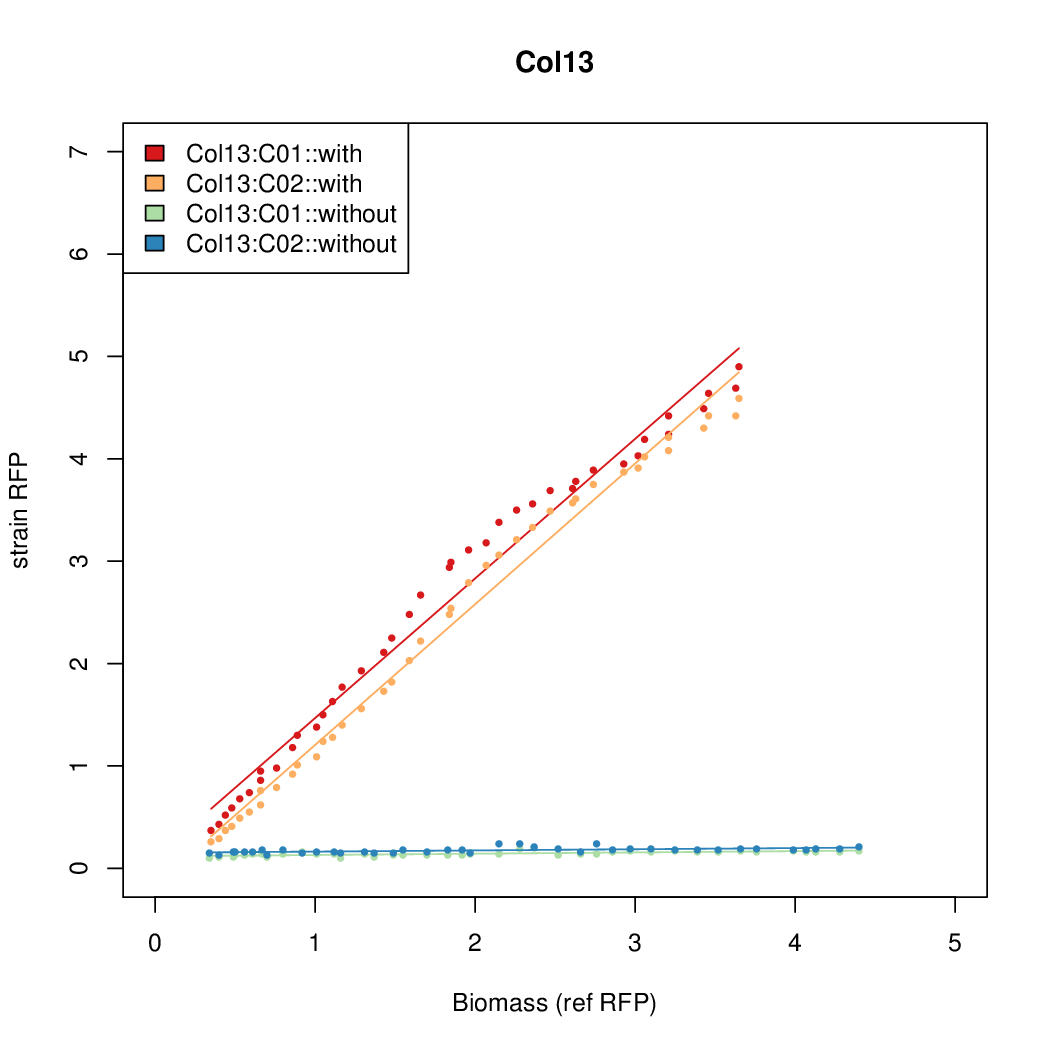
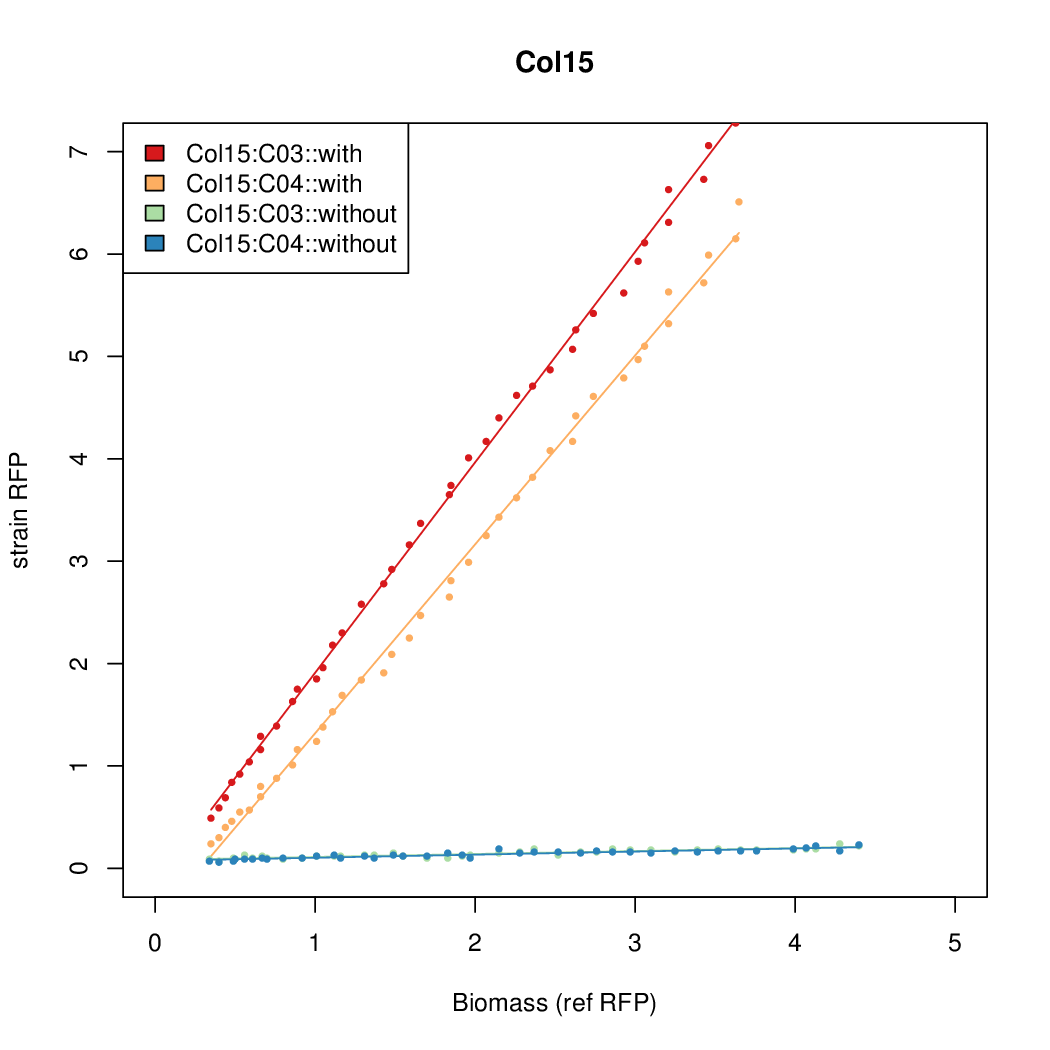
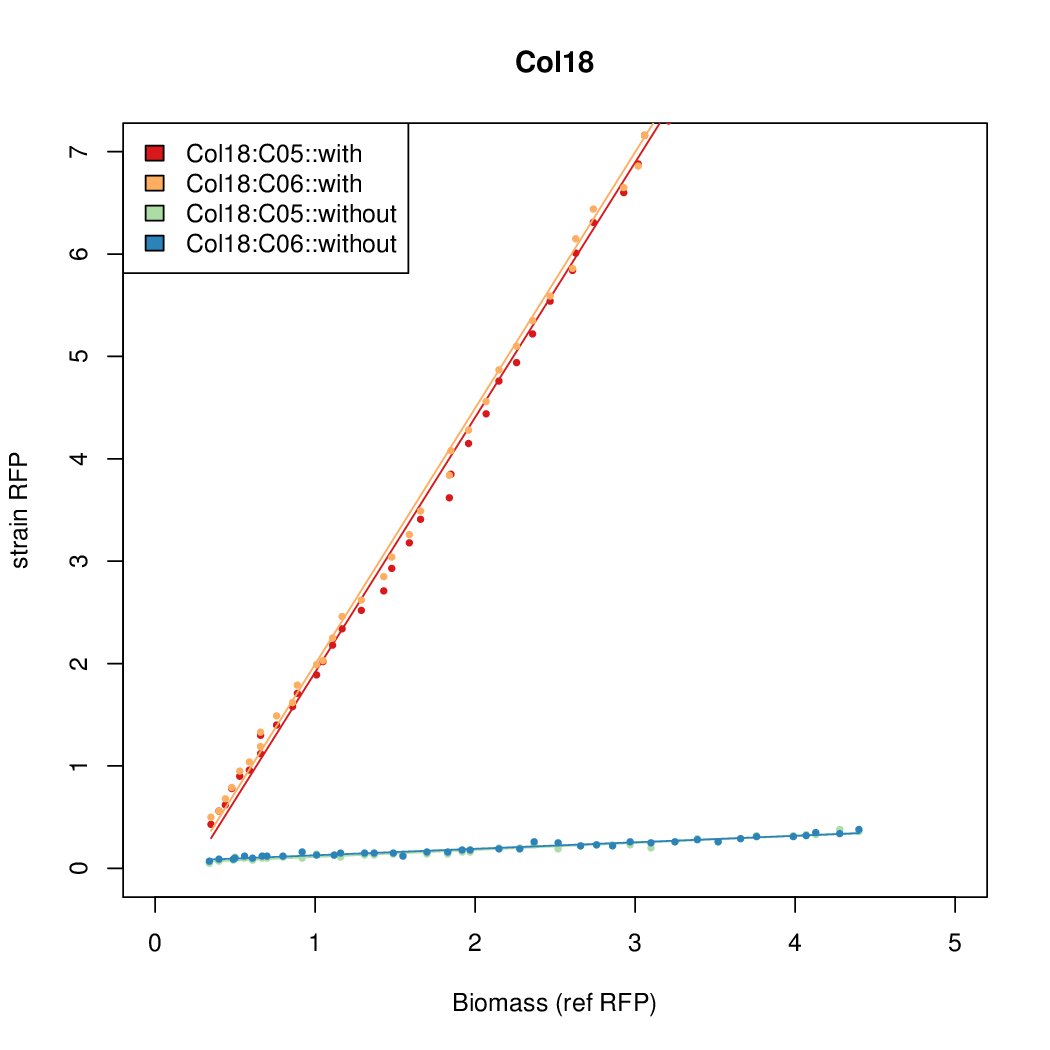
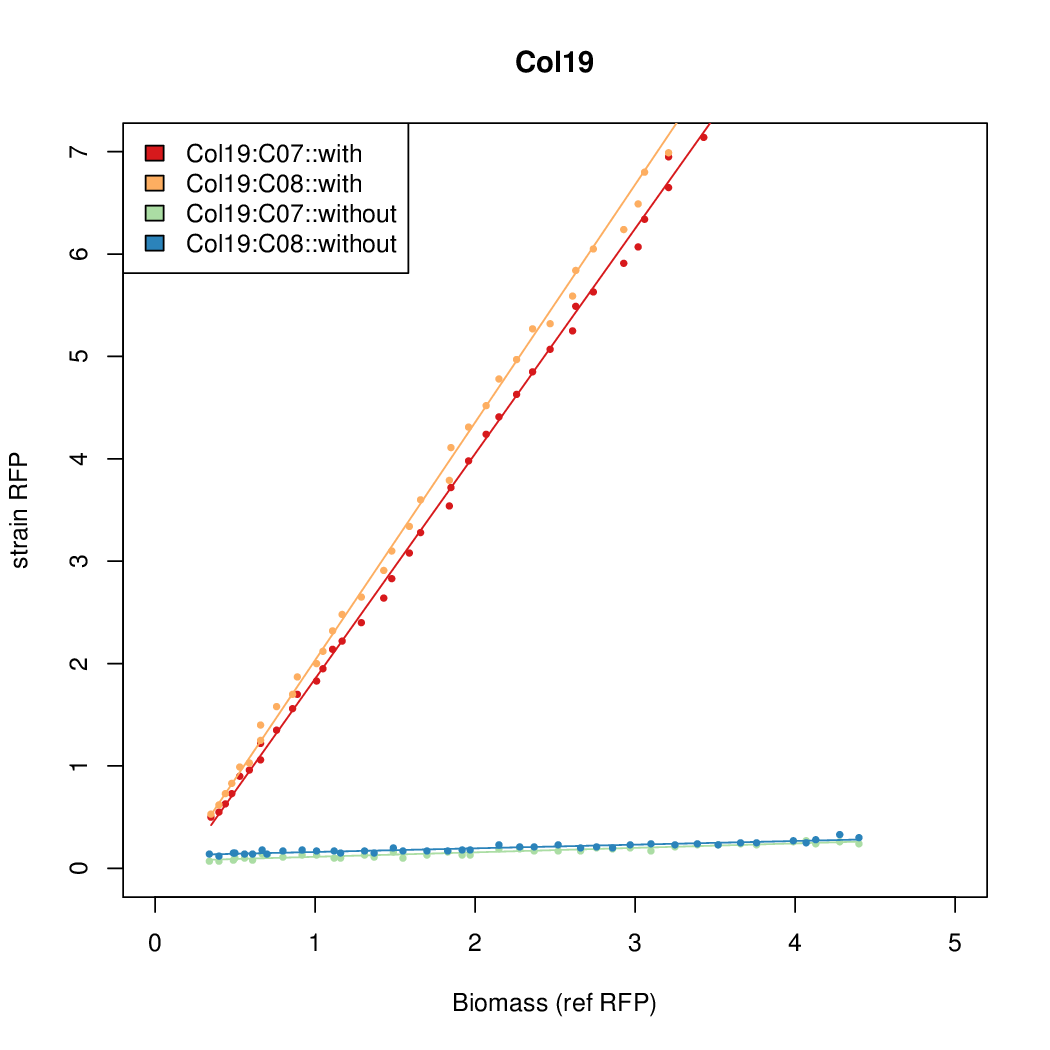
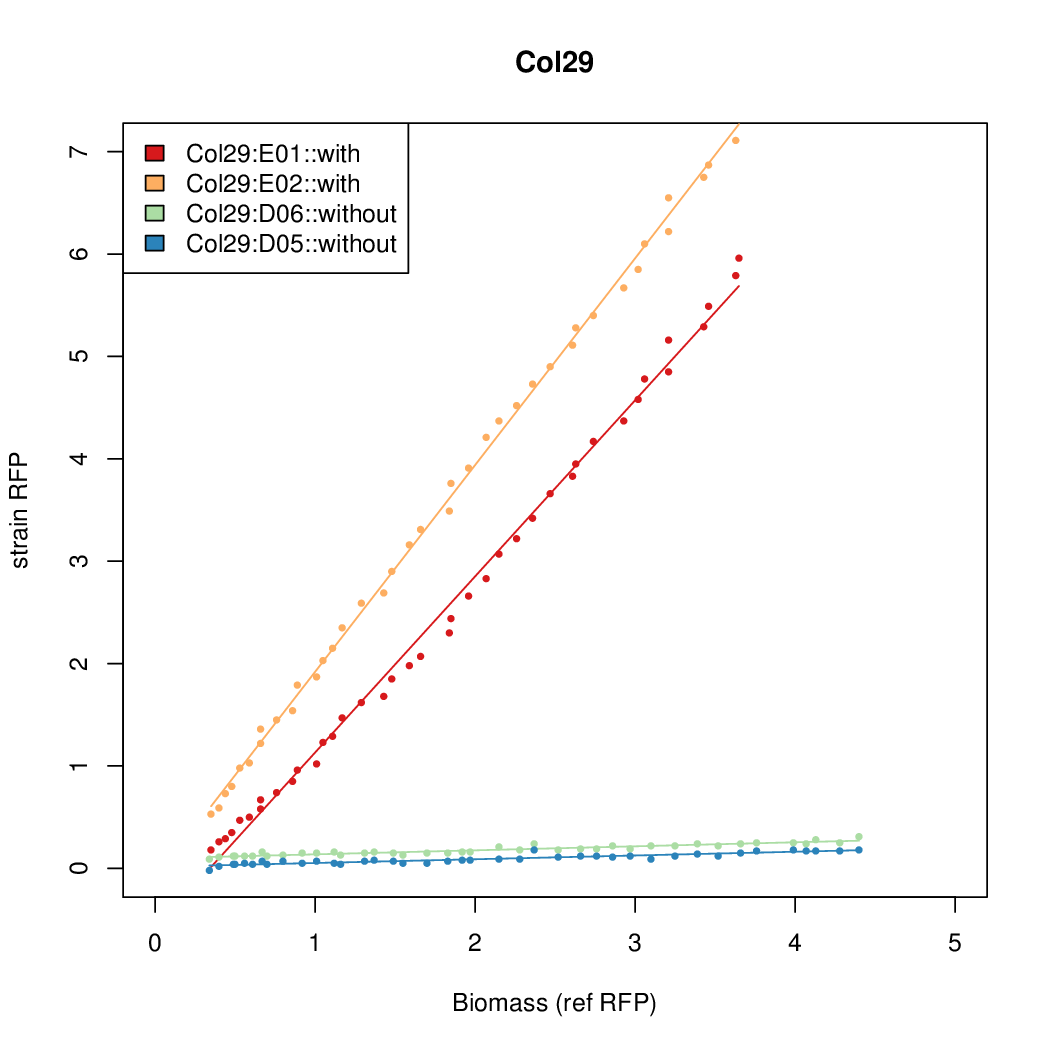
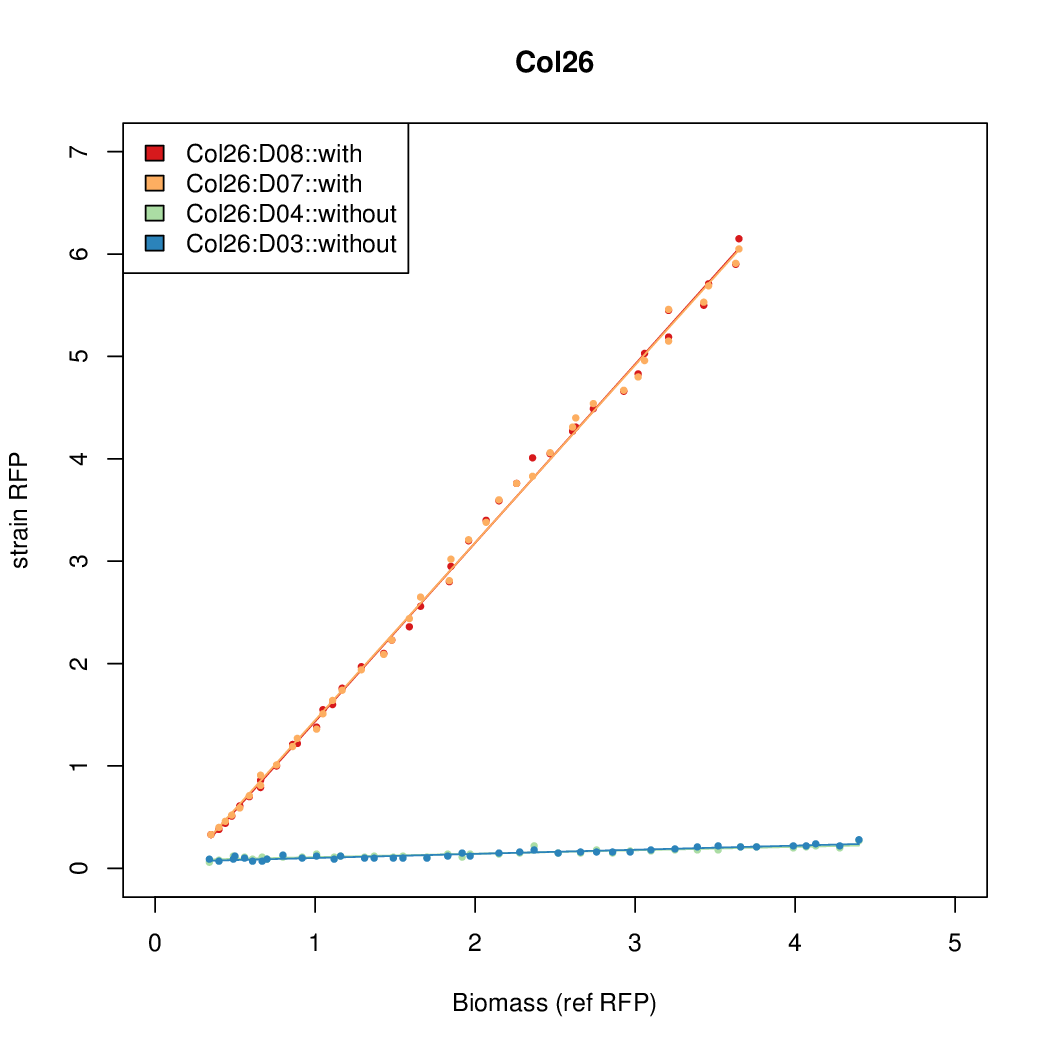
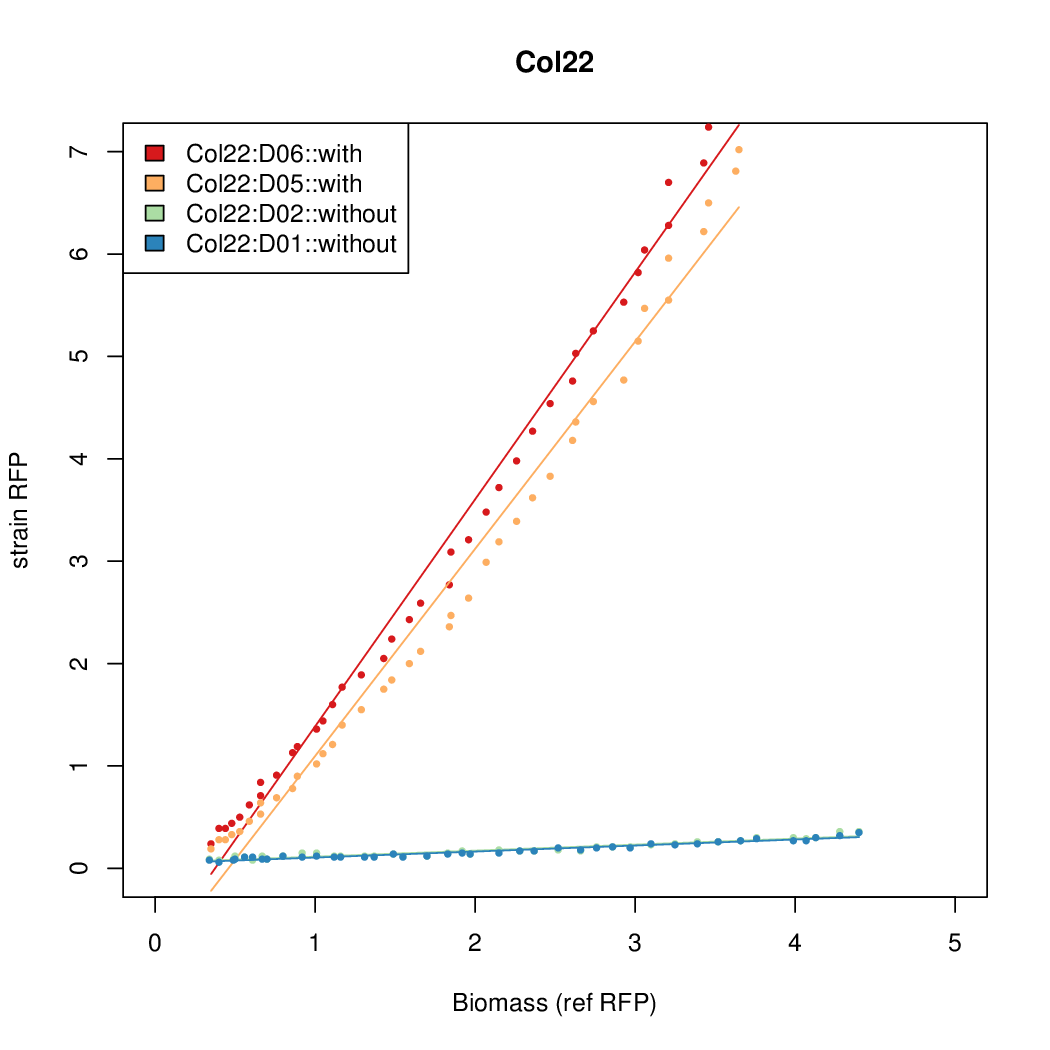
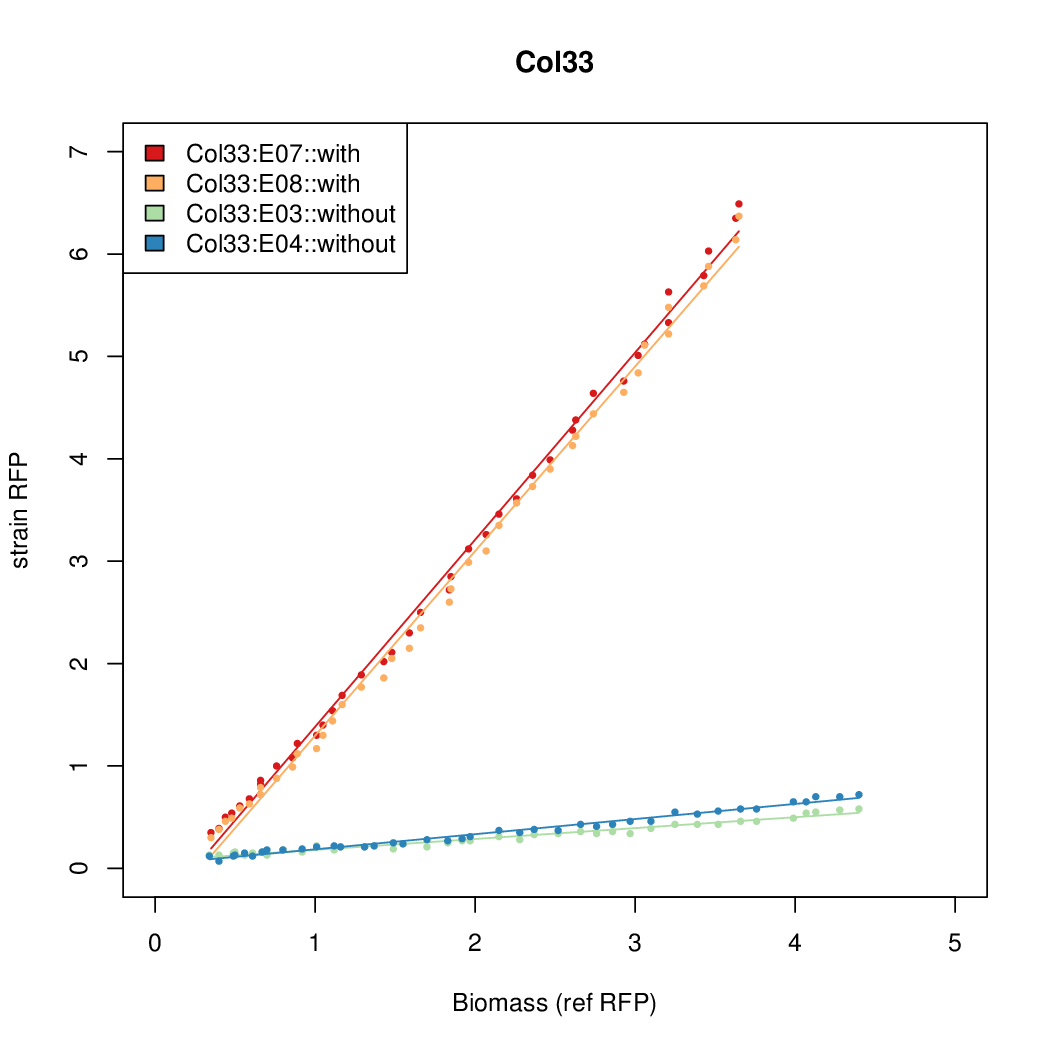
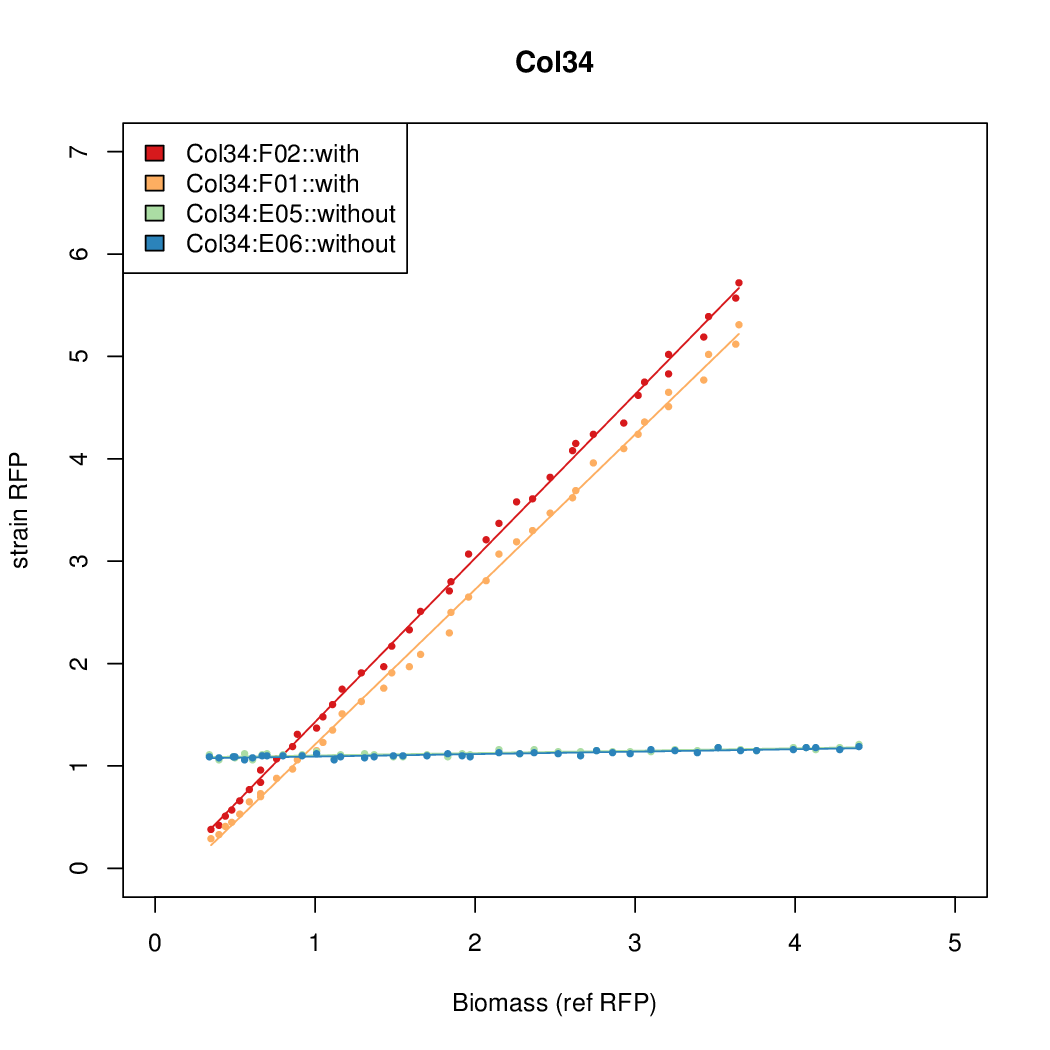
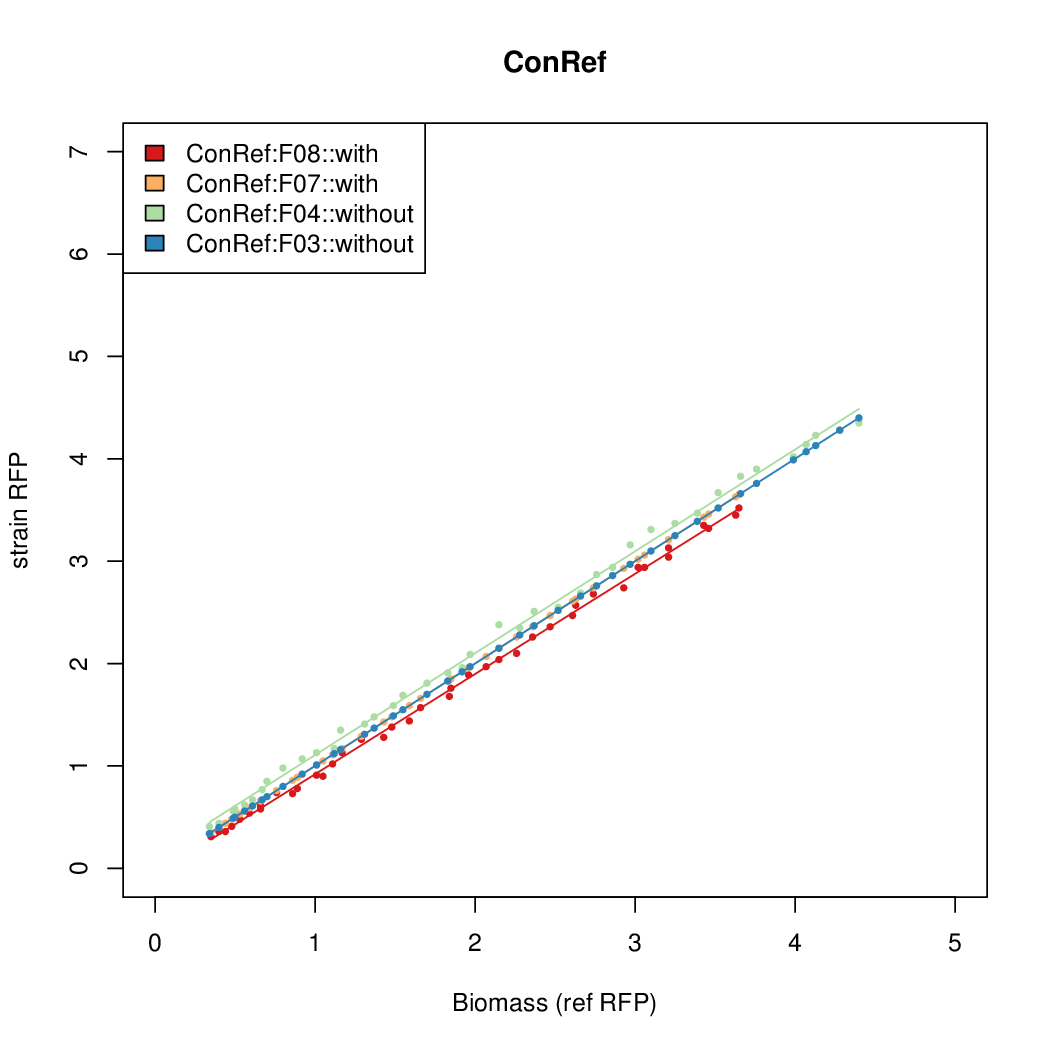
- The RFP measurement for a constitutively expressed strain was used as a standard measure of growth. This is plotted on the x-axis in the detailed plots per colony below.
- Figures were plotted using R.
Results
Summary
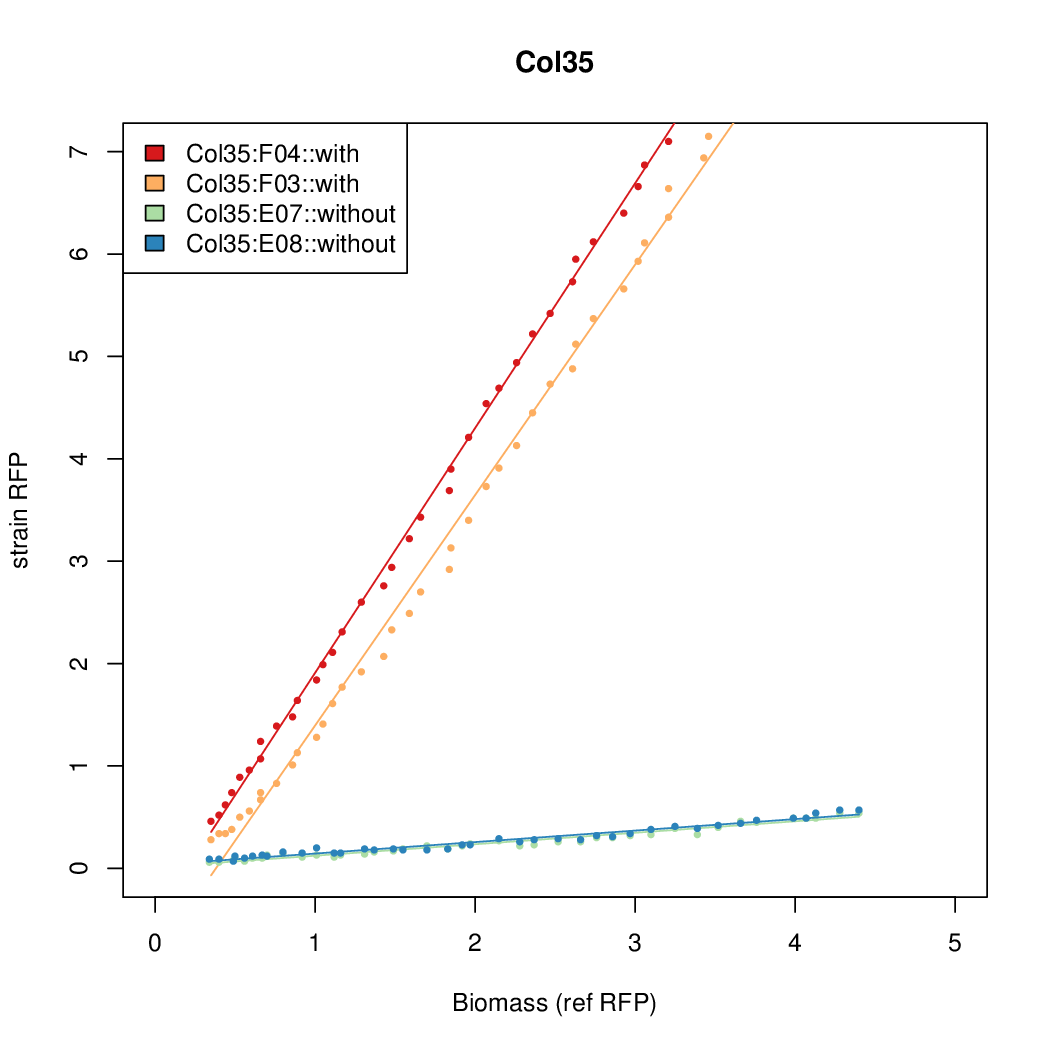
Promoter activity when induced (with arabinose added) plotted vs basal activity (without arabinose; ie leakiness of the promoter). The colonies that we selected all show less activity than the the constitutive promoter, and when induced, show higher activity than the constitutive promoter.

Details
Promoter strengths for two trials of each colony with and without arabinose.
| Colony Number | With arabinose 1 | With arabinose 2 | Without arabinose 1 | Without arabinose 2 |
|---|---|---|---|---|
| Col2 | 8.9025 | 7.8699 | 0.727 | 0.9552 |
| Col3 | 9.2724 | 12.1142 | 0.5248 | 0.6982 |
| Col4 | 9.4571 | 11.4522 | 0.5231 | 0.2508 |
| Col12 | 6.3641 | 10.5389 | 0.5897 | 0.6869 |
| Col10 | 7.9697 | 9.7949 | 0.3392 | 0.733 |
| Col9 | 7.8563 | 20.1094 | 0.6995 | 0.7432 |
| Col8 | 12.2318 | 15.4548 | 0.4203 | 0.4538 |
| Col13 | 11.0377 | 7.3343 | 0.482 | 0.4641 |
| Col15 | 15.6817 | 8.2707 | 0.8169 | 0.1343 |
| Col18 | 14.7916 | 15.5736 | 0.6674 | 0.6745 |
| Col19 | 14.2126 | 16.4898 | 0.4545 | 0.3566 |
| Col29 | 7.1853 | 16.3467 | 0.5445 | 0.5013 |
| Col26 | 9.7724 | 9.6269 | 0.7118 | 0.7865 |
| Col22 | 8.4168 | 5.5958 | 0.6049 | 0.5645 |
| Col33 | 9.1982 | 8.9987 | 0.6508 | 1.374 |
| Col34 | 10.6987 | 7.883 | 0.5067 | 0.5031 |
| Col35 | 13.8427 | 7.5469 | 0.4363 | 0.6281 |
| ConRef | 6.506 | 7.9323 | 8.7811 | 7.9323 |
Example of use
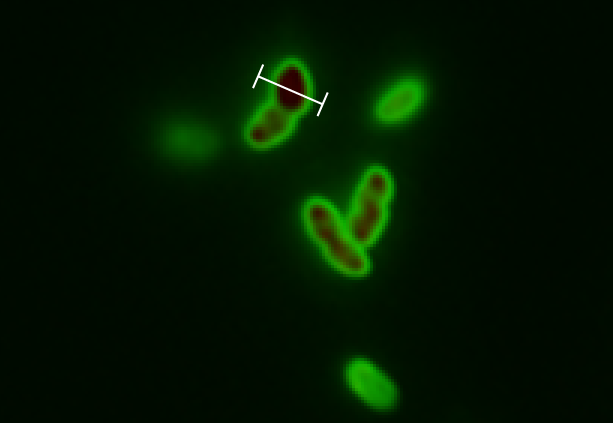
The tight inducible pBAD promoter was used in our "Hello World project" to regulate the expression of GFP SF, which was tagged with a signal peptide to direct it into the periplasm. Production and folding of GFP SF is faster than the transport system of E. coli, which leads to undesired accumulation of GFP SF in the cytoplasm. Only when using a promoter with low leakiness it is possible to translocate a significant fraction of GFP SF after its production has been switched off. Thereby we get a clear signal from the periplasm with low interference from the cytoplasm.
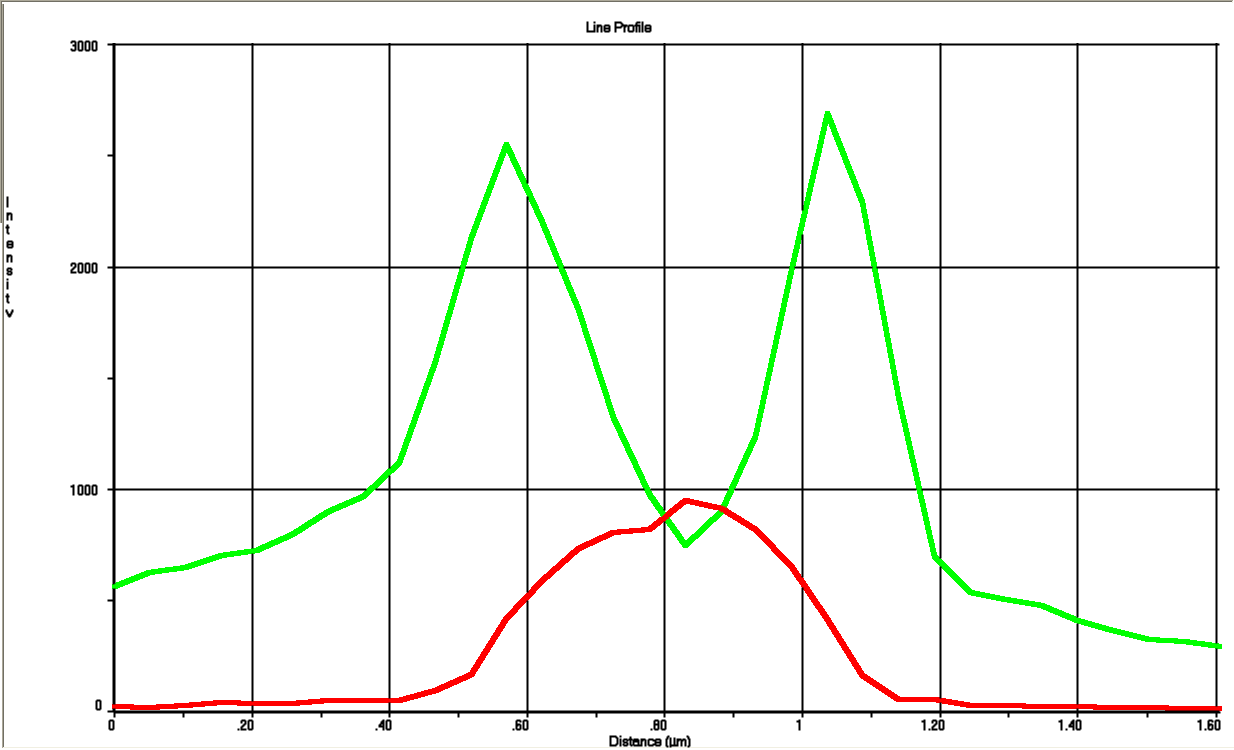
See also "Hello World project".
 "
"
