Team:UGA-Georgia/Results
From 2013.igem.org
(→Methanococcus Lab) |
(→BioBrick Tools) |
||
| (28 intermediate revisions not shown) | |||
| Line 1: | Line 1: | ||
<div id="header">{{Template:Team:UGA-Georgia/Templates/Header}}</div> | <div id="header">{{Template:Team:UGA-Georgia/Templates/Header}}</div> | ||
| - | = | + | = Geraniol Production = |
| + | [[Image:Geraniol standard 73013.png|right]] | ||
| - | + | [[Image:Sample 7 73013 (2).png|right]] | |
| - | [[Image: | + | [[Image:Sample 6 73013.png|right]] |
| - | [[Image:Sample | + | [[Image:Mass Spec Sample 6 73013.png|right]] |
| - | [[Image: | + | [[Image:Geraniol standard 9613 (2).png|right]] |
| - | [[Image: | + | [[Image:Geraniol sample 9613.png|right]] |
| - | |||
| - | |||
| Line 25: | Line 24: | ||
| + | (1) This chromatograph is from a geraniol standard we created and ran on 07/30/2013. The substantial peak in this chromatograph is geraniol. | ||
| Line 34: | Line 34: | ||
| - | |||
| Line 46: | Line 45: | ||
| + | (2) This chromatograph is of one of our samples that we extracted geraniol from. The significant peak with similar retention time to the standard is geraniol. This was confirmed using Mass Spec. | ||
| Line 59: | Line 59: | ||
| - | |||
| Line 67: | Line 66: | ||
| + | (3) This chromatograph is of another one of our samples. The significant peak with similar retention time to the standard is geraniol. This was confirmed using Mass Spec (see image below). | ||
| Line 77: | Line 77: | ||
| - | |||
| Line 91: | Line 90: | ||
| + | (4) This Mass Spec analysis of the previous sample recognizes the significant peak at 7.81 minutes as geraniol (aka trans-3,7-dimethyl-2,7-octadien-1-ol) | ||
| Line 101: | Line 101: | ||
| - | |||
| Line 115: | Line 114: | ||
| + | (5) This chromatograph is of a geraniol standard we created and ran on 09/06/2013. The significant peak here was confirmed via Mass Spec as geraniol (see window in top corner of image). | ||
| Line 128: | Line 128: | ||
| + | (6) This chromatograph is of a pAW42-GS sample that we extracted geraniol from. The significant peak here with similar retention time to the standard was confirmed as geraniol via Mass Spec (see window in bottom corner of graph) | ||
| Line 133: | Line 134: | ||
| - | |||
| + | Conclusion: | ||
| + | We created geraniol standards of different concentrations and plotted the concentration of the standard against the integral area of the peak formed in the respective chromatograph. From here we were able to draw a regression line through the data points and obtain a linear function. We used this linear function to accurately calculate the amount of geraniol produced in our samples. So, we can conclude the production of geraniol as over 0.2% of the DLW in Methanococcus using the pAW42-GS (BBa-k1138000) model. | ||
| + | = BioBrick Tools = | ||
| + | [[Image:V2V4gel.png|right]] | ||
| + | [[Image:Biobrick v2v4.png|right]] | ||
| + | [[Image:V4fluorescence.png|right]] | ||
| + | Screening Strategy: Acc65I & PstI | ||
| + | Positive=3133,1446,367 | ||
| + | Negative:3143, 1725 | ||
| + | |||
| + | L1- BBa_k1138001A | ||
| + | |||
| + | L2- BBa-k1138001B | ||
| + | |||
| + | L3- BBa-k1138001C | ||
| + | |||
| + | L4- Blank | ||
| + | |||
| + | L5- BBa-k1138002A | ||
| + | |||
| + | L6- BBa-k1138002B | ||
| + | |||
| + | L7- Blank | ||
| + | |||
| + | L8- BBa-k1138002C | ||
| + | |||
| + | L9- Ladder | ||
| + | |||
| + | |||
| + | |||
| + | Analysis and conclusion | ||
| + | |||
| + | From lanes 1-8 it is seen that all are positive. | ||
| + | |||
| + | |||
| + | |||
| + | |||
| + | |||
| + | |||
| + | |||
| + | |||
| + | |||
| + | |||
| + | |||
| + | |||
| + | |||
| + | |||
| + | |||
| + | These are the two tools that we created that will allow you to regulate and quantify gene expression. One has an RBS and the other one does not. The one with the RBS can be used as a control and the one without can be used to insert your gene of interest to quantify expression. Both tools have EcoRI, NotI, XbaI, and NsiI restriction sites for insertion of a gene. | ||
| + | |||
| + | |||
| + | |||
| + | |||
| + | |||
| + | |||
| + | |||
| + | |||
| + | |||
| + | |||
| + | |||
| + | |||
| + | |||
| + | |||
| + | |||
| + | |||
| + | |||
| + | |||
| + | |||
| + | This graph shows the fluorescence of BBa-k1138002 in comparison to the Methanococcus wild type strain s0001. We report the fluorescence in our BioBrick part roughly as a 3 fold increase. Note that the wild type gives a small fluorescence reading due to the fact that Methanococcus is naturally bio-luminescent. | ||
| Line 158: | Line 227: | ||
| - | |||
| - | |||
| - | + | Conclusion: | |
| + | <p>We have shown that our tool fluoresces around 3 times more than wild type Methanococcus making it a valuable tool for quantifying and regulating gene expression. We hope that future researchers and iGEM teams will use this tool in the future to use methanogens as an organism for synthetic biology.</p> | ||
Latest revision as of 03:55, 28 September 2013
Geraniol Production
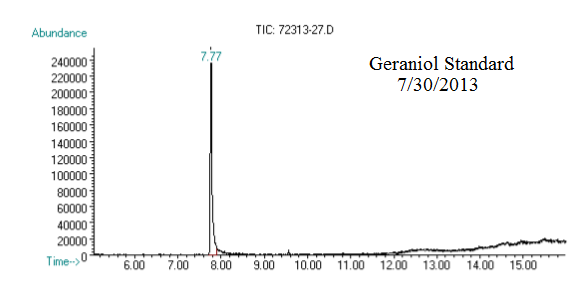
(1) This chromatograph is from a geraniol standard we created and ran on 07/30/2013. The substantial peak in this chromatograph is geraniol.
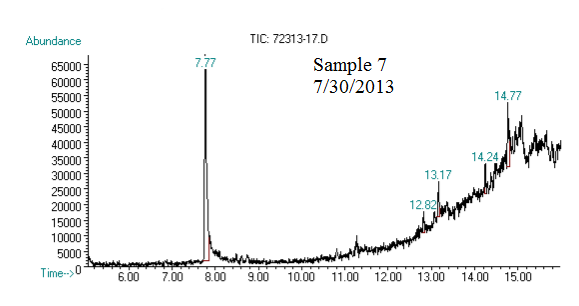
(2) This chromatograph is of one of our samples that we extracted geraniol from. The significant peak with similar retention time to the standard is geraniol. This was confirmed using Mass Spec.
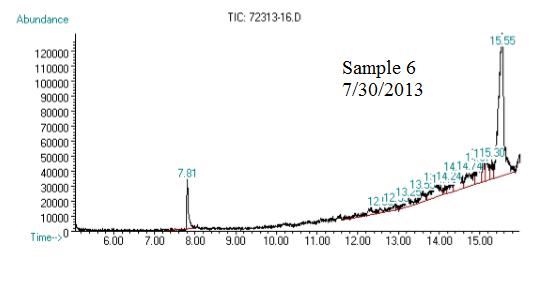
(3) This chromatograph is of another one of our samples. The significant peak with similar retention time to the standard is geraniol. This was confirmed using Mass Spec (see image below).
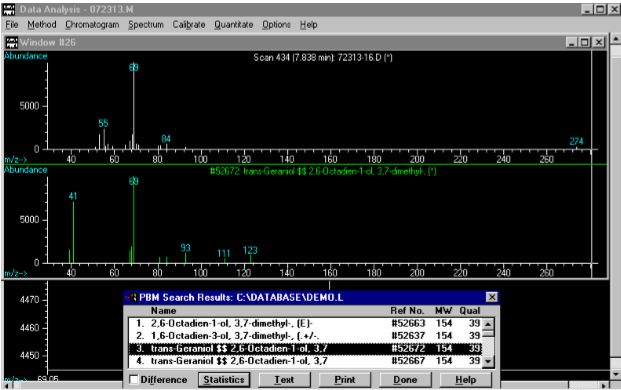
(4) This Mass Spec analysis of the previous sample recognizes the significant peak at 7.81 minutes as geraniol (aka trans-3,7-dimethyl-2,7-octadien-1-ol)
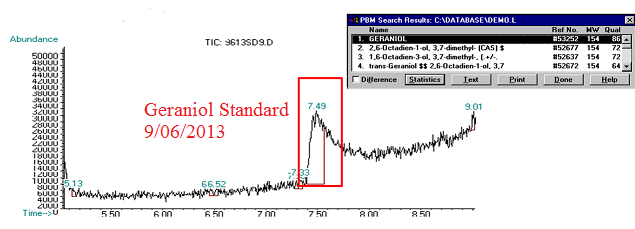
(5) This chromatograph is of a geraniol standard we created and ran on 09/06/2013. The significant peak here was confirmed via Mass Spec as geraniol (see window in top corner of image).
(6) This chromatograph is of a pAW42-GS sample that we extracted geraniol from. The significant peak here with similar retention time to the standard was confirmed as geraniol via Mass Spec (see window in bottom corner of graph)
Conclusion:
We created geraniol standards of different concentrations and plotted the concentration of the standard against the integral area of the peak formed in the respective chromatograph. From here we were able to draw a regression line through the data points and obtain a linear function. We used this linear function to accurately calculate the amount of geraniol produced in our samples. So, we can conclude the production of geraniol as over 0.2% of the DLW in Methanococcus using the pAW42-GS (BBa-k1138000) model.
BioBrick Tools
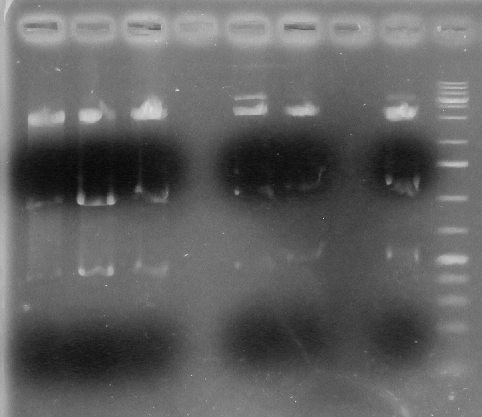
Screening Strategy: Acc65I & PstI
Positive=3133,1446,367
Negative:3143, 1725
L1- BBa_k1138001A
L2- BBa-k1138001B
L3- BBa-k1138001C
L4- Blank
L5- BBa-k1138002A
L6- BBa-k1138002B
L7- Blank
L8- BBa-k1138002C
L9- Ladder
Analysis and conclusion
From lanes 1-8 it is seen that all are positive.
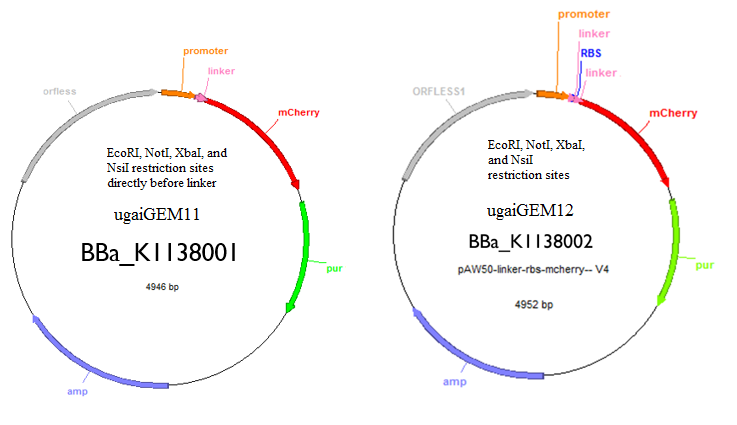
These are the two tools that we created that will allow you to regulate and quantify gene expression. One has an RBS and the other one does not. The one with the RBS can be used as a control and the one without can be used to insert your gene of interest to quantify expression. Both tools have EcoRI, NotI, XbaI, and NsiI restriction sites for insertion of a gene.
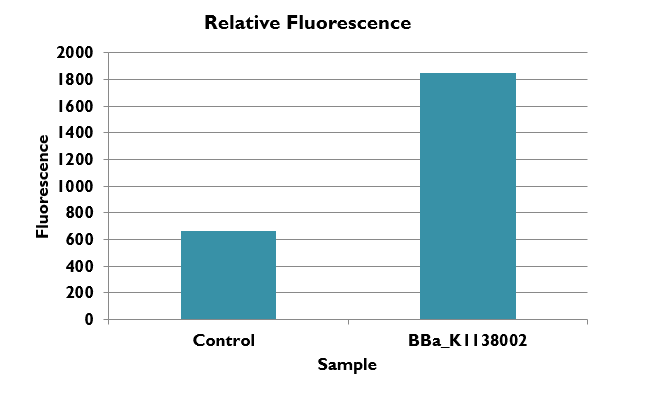
This graph shows the fluorescence of BBa-k1138002 in comparison to the Methanococcus wild type strain s0001. We report the fluorescence in our BioBrick part roughly as a 3 fold increase. Note that the wild type gives a small fluorescence reading due to the fact that Methanococcus is naturally bio-luminescent.
Conclusion:
We have shown that our tool fluoresces around 3 times more than wild type Methanococcus making it a valuable tool for quantifying and regulating gene expression. We hope that future researchers and iGEM teams will use this tool in the future to use methanogens as an organism for synthetic biology.
 "
"

