Team:BYU Provo/Results/Modeling
From 2013.igem.org
(→Data Analysis) |
(→Next Step) |
||
| (30 intermediate revisions not shown) | |||
| Line 36: | Line 36: | ||
<font face="Calibri" size="3"> | <font face="Calibri" size="3"> | ||
| - | __NOTOC__==Basic Design== | + | __NOTOC__==Bacteriophage Plaques== |
| + | |||
| + | ===Basic Design=== | ||
[[File:BYUModelingDesign.JPG|360px|right|link=https://static.igem.org/mediawiki/2013/c/c9/BYUModelingDesign.JPG]] | [[File:BYUModelingDesign.JPG|360px|right|link=https://static.igem.org/mediawiki/2013/c/c9/BYUModelingDesign.JPG]] | ||
| Line 46: | Line 48: | ||
<br> | <br> | ||
| - | ==Experimental Results== | + | ===Experimental Results=== |
| - | [[File:BYUModelingPlatePics.JPG| | + | [[File:BYUModelingPlatePics.JPG|380px|right|link=https://static.igem.org/mediawiki/2013/2/22/BYUModelingPlatePics.JPG]] |
| - | We decided to start with determining the relationship between phage plaque size and phage | + | We decided to start with determining the relationship between phage plaque size and phage particle size. Specifically, 0.5 mL of E coli B liquid culture (OD 600 = 0.5) was transfected with 20uL of the respective phage (T1, T3, T4, and T7) at approximately the same concentration for 10 minutes. After this, the bacteria/phage mixture was plated on standard LB plates using x1 top agar. Plates were allowed to solidify at room temperature for 30 minutes, before they were placed in an incubator at 37 Celsius for 24 hours. Following incubation, pictures of plates were taken with Alphaimager and plaque sizes were measured using [http://rsbweb.nih.gov/ij/ ImageJ]. |
| + | <br> | ||
<br> | <br> | ||
| - | ==Data Analysis== | + | ===Data Analysis=== |
| + | |||
| + | Data analysis gives the following results: | ||
| + | |||
| + | [[File:BYUModelingTable.JPG|750px|left|link=https://static.igem.org/mediawiki/2013/6/67/BYUModelingTable.JPG]] | ||
| + | |||
| + | Fig. 3 verifies our hypothesis that there is an inverse relationship between plaque sizes and phage particle size. This further confirms our method of selection (using different concentrations of agar) in our creation of mutant T4 and T7 phage library. | ||
| + | |||
| + | <br> | ||
| - | + | ===Next Step=== | |
| - | + | To further model phage plaque sizes we will | |
| - | + | * test whether or not our mutant phage confirm to the same plaque size - phage particle size relationship. | |
| + | * start modeling experiments in which one of the other experimental factors (temperature, bacterial concentration, agar concentration, incubation time) act as the independent variable. | ||
</font> | </font> | ||
Latest revision as of 23:06, 27 September 2013
| |
|
|
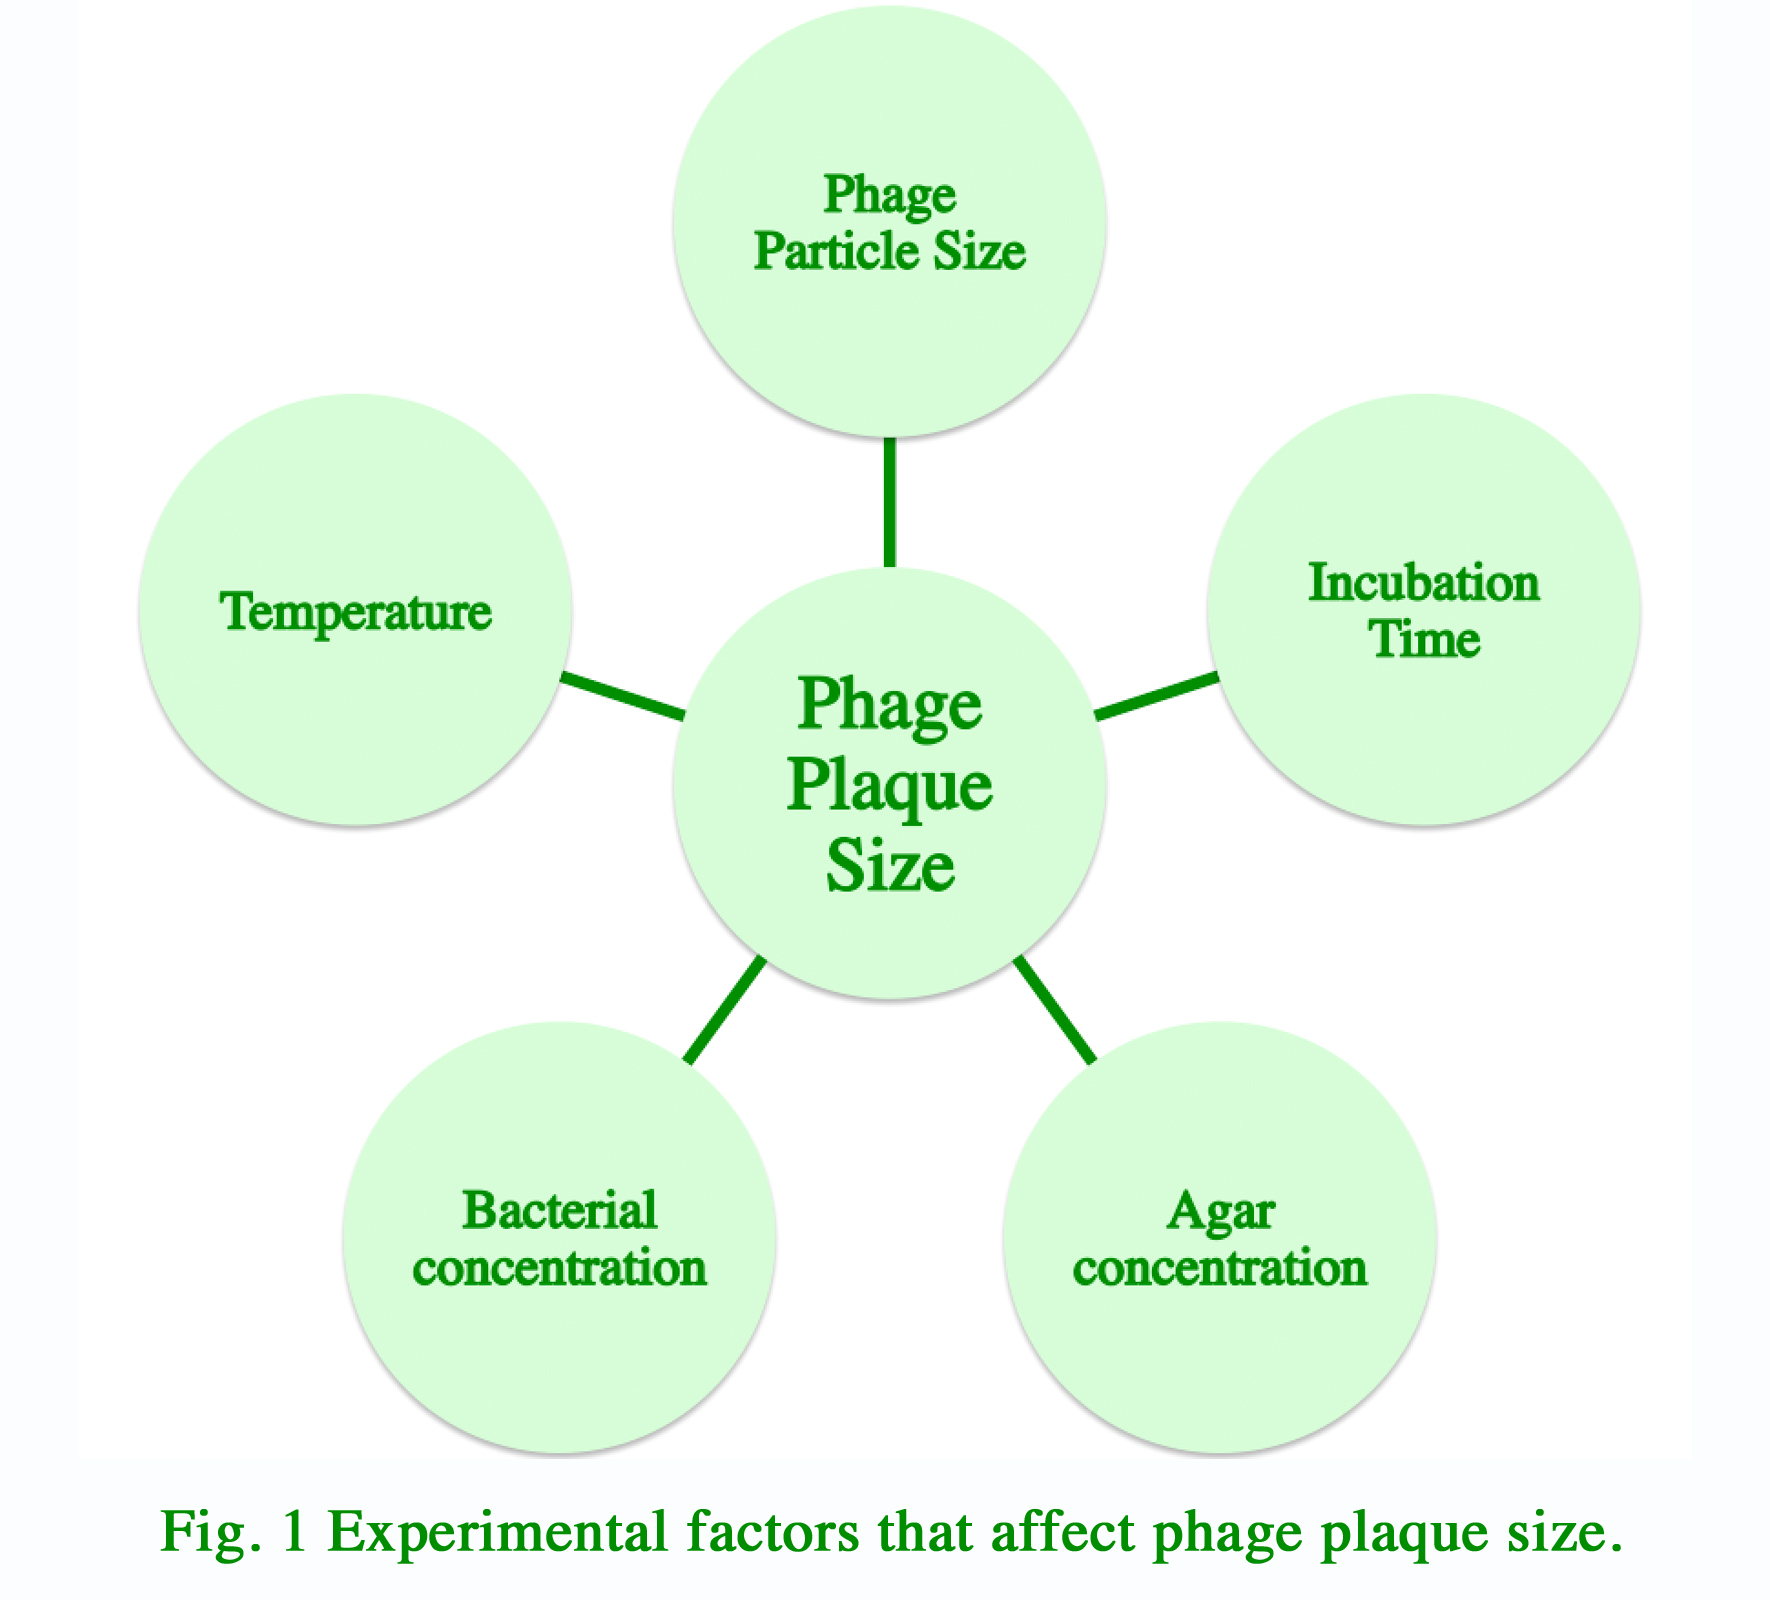
Bacteriophage PlaquesBasic DesignExperiments with bacteriophage growth is often performed either in liquid broth or in solid agar medium. In contrast to the relative uniform distribution of phages in liquid broth, phages form individual clearings in bacterial lawn within solid agar medium. These clearings are termed plaques. They are the product of bacterial cell lysis as phage replicate and spread outward. For our modeling experiments, we hypothesized that multiple experimental factors may influence the size of plaque formation in solid agar medium (Fig. 1). We decided to start with identifying the relationships between plaque sizes and each of these factors. With these data, we can generate a mathematical model that take into account all experimental variability. Such model can be used by researcher to design the optimal experimental conditions that will produce plaques of the ideal size for their experiments.
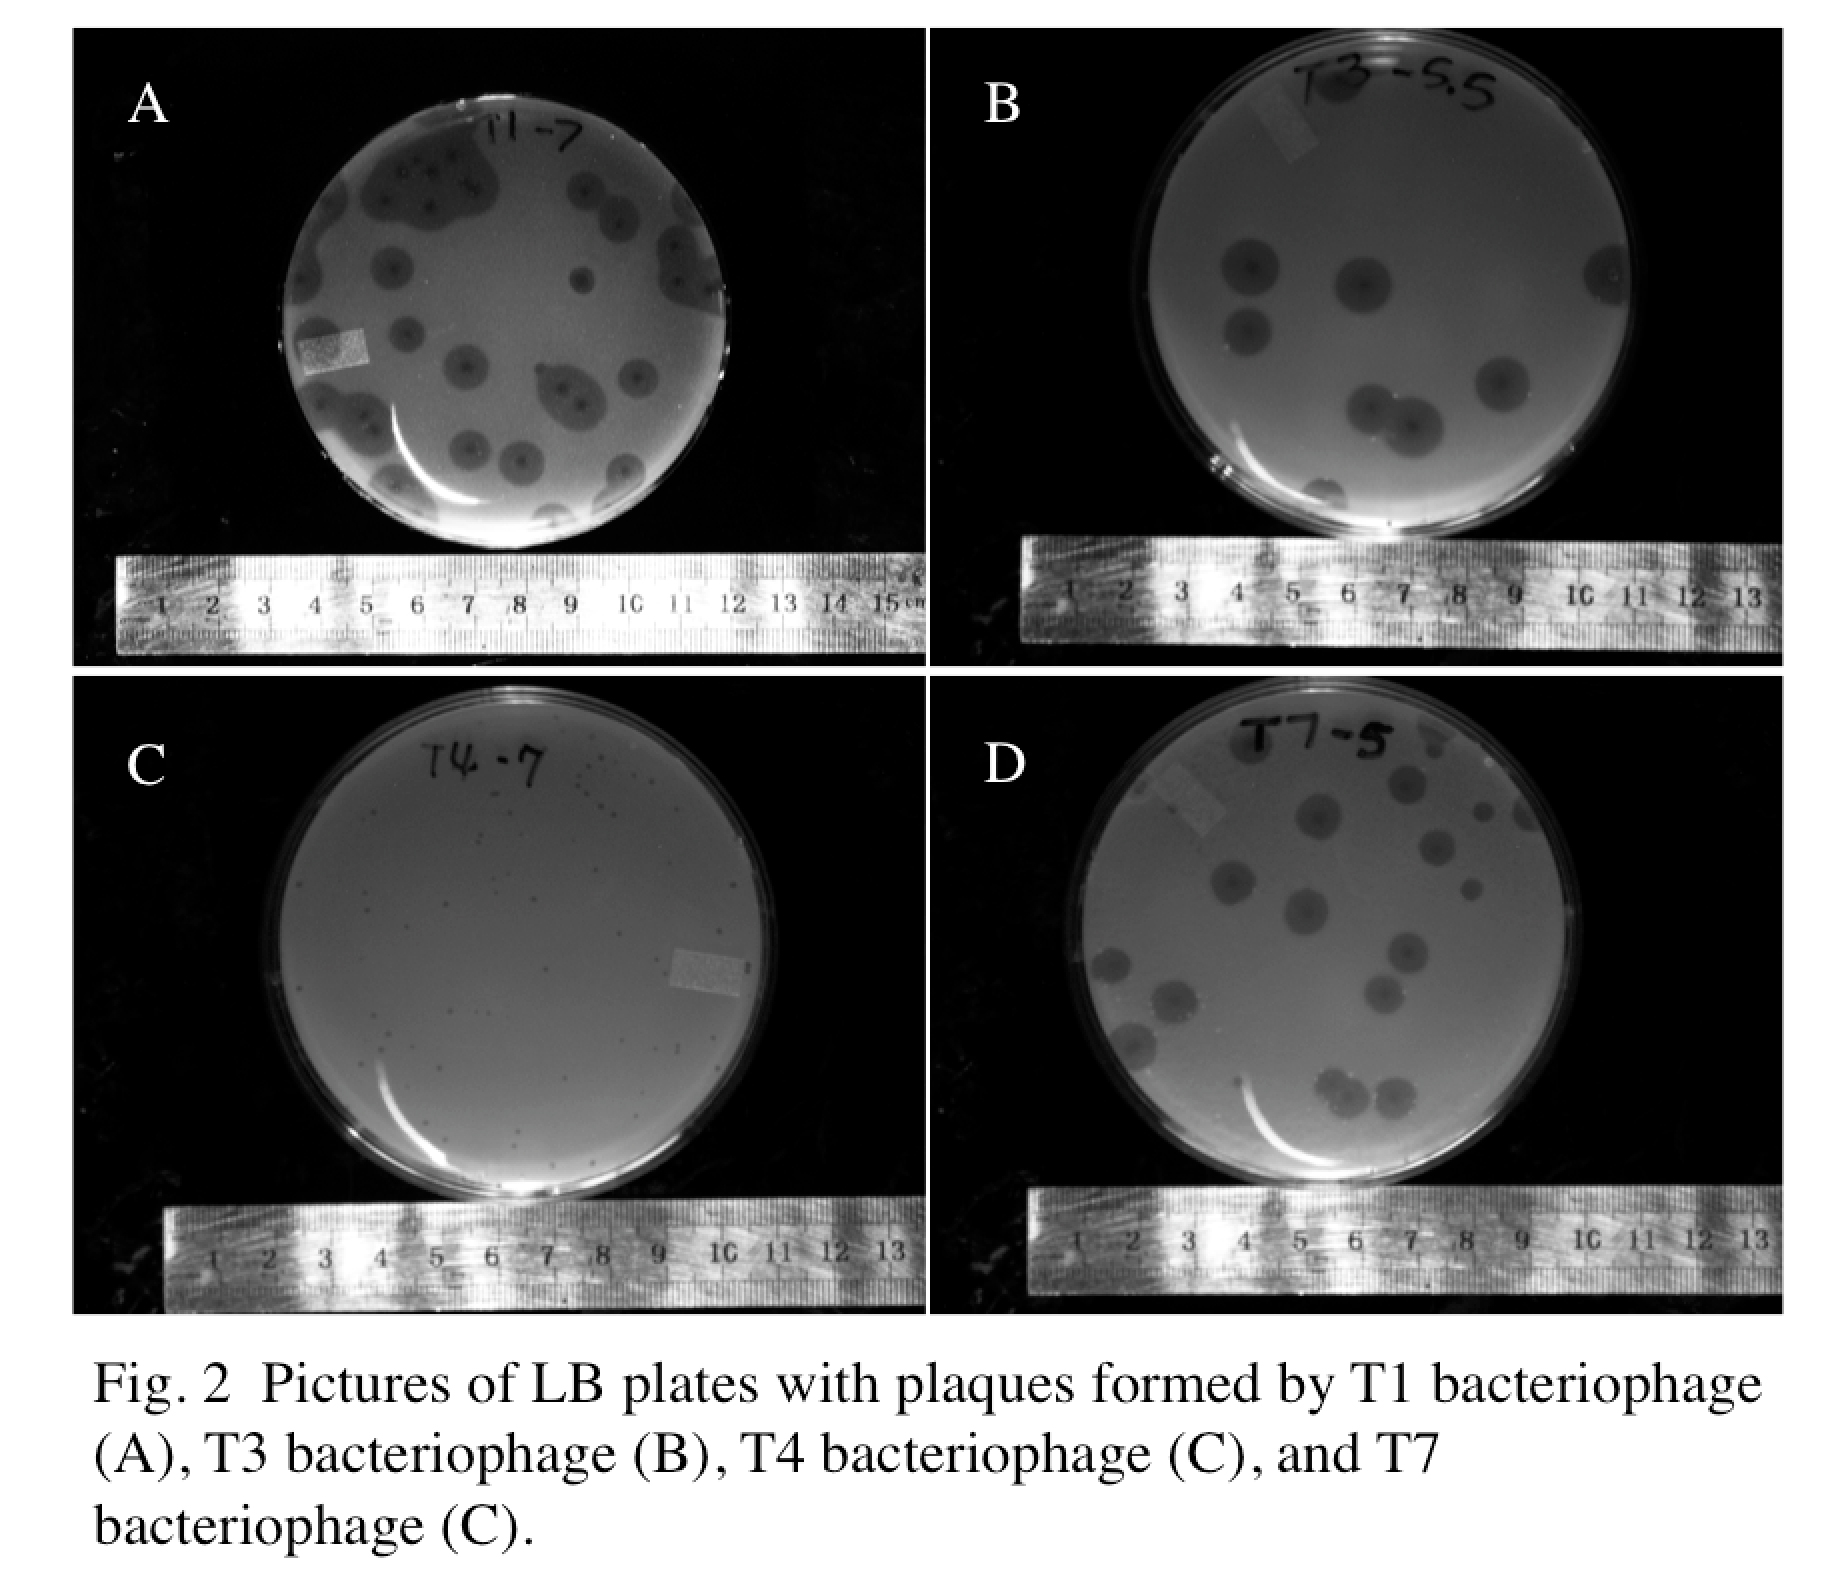
Experimental ResultsWe decided to start with determining the relationship between phage plaque size and phage particle size. Specifically, 0.5 mL of E coli B liquid culture (OD 600 = 0.5) was transfected with 20uL of the respective phage (T1, T3, T4, and T7) at approximately the same concentration for 10 minutes. After this, the bacteria/phage mixture was plated on standard LB plates using x1 top agar. Plates were allowed to solidify at room temperature for 30 minutes, before they were placed in an incubator at 37 Celsius for 24 hours. Following incubation, pictures of plates were taken with Alphaimager and plaque sizes were measured using [http://rsbweb.nih.gov/ij/ ImageJ].
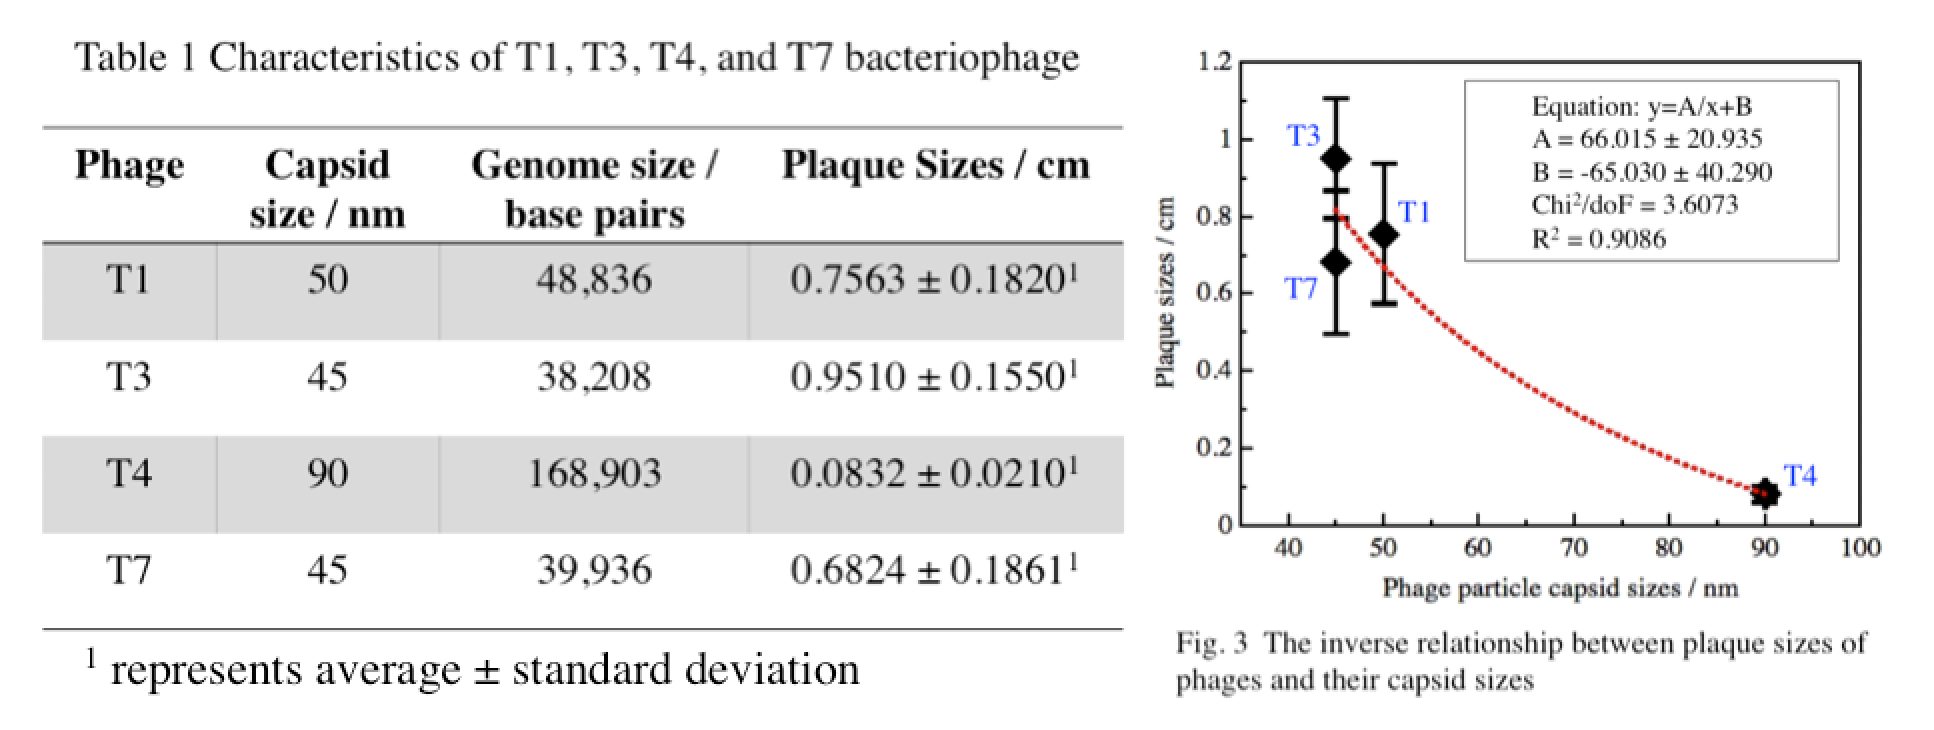
Data AnalysisData analysis gives the following results: Fig. 3 verifies our hypothesis that there is an inverse relationship between plaque sizes and phage particle size. This further confirms our method of selection (using different concentrations of agar) in our creation of mutant T4 and T7 phage library.
Next StepTo further model phage plaque sizes we will
|
 "
"


