Team:Kyoto/ProjectTuring
From 2013.igem.org
Kambayashi (Talk | contribs) (→Introduction) |
|||
| (88 intermediate revisions not shown) | |||
| Line 7: | Line 7: | ||
</ul> | </ul> | ||
</html> | </html> | ||
| - | <div class="texts" style="margin-top: - | + | <div class="texts" style="margin-top: -9px;"> |
=Turing Model<br>-the problems between wet and dry-= | =Turing Model<br>-the problems between wet and dry-= | ||
==Introduction== | ==Introduction== | ||
| - | On | + | On Earth, there are various animals which have various patterns on their skin. The mechanism of this pattern formation has not been explained by any valid theories yet, although many hypothesis has been proposed. Among these hypothesis, there is a model pattern called Turing pattern proposed by A. Turing, a famous mathematician *1. S. Kondo *2 and some other researchers *3 suggest that some creatures’ pattern can be explained by Turing’s model. Here we will step by step explain how this Turing pattern is expressed by his model.<br> |
| - | Let’s take a look on simple hypothetical pattern formed by just two colors. Creatures’ epidermal pattern is expressed on the | + | [[File:IGKU0002.png|300px]][[File:sakana.png|400px]]<br> |
| - | + | Let’s take a look on a simple hypothetical pattern formed by just two colors. Creatures’ epidermal pattern is expressed on the cells. Let’s assume that the pattern is formed by cells in different state α and β for example. A cell in state α expresses color 1 and changes close cell in state β into state α. Another Cell in state β expresses color 2 and changes close cells in state α into state β, and remote cells in state β into state α. For convenience, hereafter we call the cell in state α {α}, and cell in the state β {β}.<br> | |
| - | Like this, a striped pattern is formed | + | [[File:IGKU0003.png|200px]][[File:IGKU0004.png|400px]]<br> |
| - | Diffusing substances such as proteins secreted from the cells determine the characters of the cells. It seems that the characters which changes close or remote cells (i.e. α and β) are function of these diffusing substances. In other words, it can be said that {α} and {& | + | Now, we will take a look at the system where two cells {α} and {β} exist uniformly and both of the cells are in the equilibrium state of interaction. Now suppose that the density of {α} and {β} fluctuated somewhere in the system. Assume that the density of cell {β} increases as shown in the center of figure 1. First, {β} in the center changes the neighboring {α} into {β}. And next the same {β} changes the remote {β} into {α}. Then remote {α} changes neighboring {β} into {α}. The pattern forms as this interaction continues<br> |
| - | + | [[File:stripeform.gif]]<br> | |
| - | Then let’s consider about this interactions between diffusible substances in simplified model. Living organism’s body surface consists of cells shaped and sized ununiformly, therefore it is easier to understand if you assume that the body surface is a plane and consists of square cell-units sized uniformly. In this model we set diffusible substances which | + | Like this model, a striped pattern is formed by close-and-remote interactions between two states of cells. When we look at this close-and-remote interaction separately, close interaction can be explained as positive feedback reaction in the aspects of polarization. Conversely, the remote interaction can be explained by negative feedback reaction<br> |
| + | [[File:IGKU0006.png|230px]][[File:IGKU0001.png|300px]]<br> | ||
| + | Diffusing substances such as proteins secreted from the cells determine the characters of the cells. It seems that the characters which changes close or remote cells (i.e. α and β) are function of these diffusing substances. In other words, it can be said that {α} and {β} secretes different diffusing substances, and the substances lead to close interaction (positive feedback) and remote interaction (negative feedback). Therefore, the pattern formation can be said to be formed by interaction between diffusible substances, as well as cell-cell interaction.<br> | ||
| + | [[File:IGKU0008.png|200px]]<br> | ||
| + | Then let’s consider about this interactions between diffusible substances in simplified model. Living organism’s body surface consists of cells shaped and sized ununiformly, therefore it is easier to understand if you assume that the body surface is a plane and consists of square cell-units sized uniformly. In this model, we can set diffusible substances which are secreted by {α} and {β}, and they increase and decrease under the influence of interactions. And then, these substances have the same characteristics of cell {α} and {β}. They lead to close interaction (positive feedback) and remote interaction (negative feedback), as a causative agent of the pattern formation on this model surfaces.<br> | ||
| + | [[File:IGKU0009.png|150px]][[File:IGKU0011.png|300px]]<br> | ||
| + | Then let’s have a look on the interaction between two diffusible substances; one leads to close interaction (positive feedback) and other leads to remote interaction (negative feedback). Hereafter we name these diffusible substances A and B. A has large diffusion velocity and represses B’s increase. B has a small diffusion velocity and promotes both A and B’s increase. If A and B have this characteristic, close interaction (positive feedback) and remote interaction (negative feedback) are formed. <br> | ||
| + | [[File:IGKU0010.png|500px]]<br> | ||
| + | A and B forms legato density gradient due to this interaction. When each cell units have the character, “Follow the color of the diffusion substances with the higher density of the two”, the substances’ density gradient can be imagined by patterns of the cells. | ||
| + | <br> | ||
| + | [[File:IGKU0050.png|400px]]<br> | ||
| + | [[File:IGKU0030.png|400px]]<br> | ||
| + | |||
| + | Now let’s consider how these two diffusible substances interact with each other in each cell unit. The amount of two diffusible substances in each cell unit changes only by diffusion and interaction. Then let’s focus on a certain cell unit (i) and consider the change of the concentration. The change in the amount of substances by diffusion is caused by the difference between outflow and inflow. Change by the interaction is dependent on the amount of A and B at a certain moment. | ||
| + | <br> | ||
| + | [[File:Hannou.png|400px]]<br> | ||
| + | [[File:Hannou2.png|300px]] | ||
| + | <br> | ||
| + | Actually, this formula is the same as reaction-diffusion which is proposed by Turing for the purpose of explaining each factors of Turing pattern formation. It seems to be difficult to understand the content of these formulae. We’re going to explain the content. <br> | ||
| + | [[File:ki1.png|18px]] , [[File:ki2.png]] and [[File:ki3.png]] are the constant numbers which indicates how big the influence on interaction of each diffusible substances per unit quantity is. | ||
| + | In other words, these terms returns the amount of A and B at a moment if we substitute the amount of A and B at an anterior moment. | ||
| + | [[File:dia.png]] and [[File:dib.png]] are the constant numbers peculiar to each diffusible substance which indicates the tendency of diffusion of A and B here. In other words, the terms [[File:dia.png]] and [[File:dib.png]] are the superficial inflow-outflow budget depending on diffusion of A and B. This is the contents which are described by the equitation. | ||
| + | |||
| + | <br> | ||
| + | [[File:IGKU0012.png|300px]][[File:IGKU0013.png|200px]]<br> | ||
| + | [[File:IGKU0014.png|300px]][[File:IGKU0015.png|300px]]<br> | ||
| + | <br> | ||
==Experiments== | ==Experiments== | ||
| - | We focused on the constants " | + | We focused on the constants " [[File:ki1.png|18px]] , [[File:ki2.png]] , [[File:ki3.png]] " in these formulae. These are taken as "always fixed in any point" to Turing pattern. However, in fact, is it true that [[File:ki1.png|18px]] is always fixed in any point with Turing pattern formed by ''E. coli''? We thought it is not always true in wet work because ''E. coli'' makes A and B. In other words, increase or decrease speed of the amounts of A and B in a certain point depends on the ''E. coli'' density in the point. |
| - | As long as E. coli is growing | + | |
| - | Can we | + | As long as ''E. coli'' is growing ununiformly until a steady state, ''E. coli'' density should be different between each point. This ''E. coli'' density difference makes changes of " [[File:ki1.png|18px]] , [[File:ki2.png]] , [[File:ki3.png]] " between each point.<br> |
| - | 1. Confirm expression amount of GFP in both a steady state and a non-steady state with plated E. coli by common method.<br> | + | |
| - | 2. | + | Can we ignore the " [[File:ki1.png|18px]] , [[File:ki2.png]] , [[File:ki3.png]] " differences? To confirm this, we established these assays.<br><br> |
| - | + | 1. Confirm expression amount of GFP in both a steady state and a non-steady state with plated ''E. coli'' by common method.<br> | |
| + | [[File:IGKU0020.png|700px]]<br> | ||
| + | 2. how strong the other proteins' expression influences the expression of GFP. Make a comparison between a state with IPTG and with no IPTG.<br> | ||
| + | [[File:IGKU0021.png|500px]]<br> | ||
| + | |||
| + | ==Result==<br> | ||
| + | [[File:GuchaFP1.png]]<br> | ||
| + | [[File:GuchaFP2.png]]<br> | ||
| + | We plated transformant ''E. coli'' containing GFP generator on 2 plates at same time.<br> | ||
| + | It is evident that ''E. coli'' density is ununiformly. Moreover, the two plates shows completely different distribution. | ||
==Discussion== | ==Discussion== | ||
| - | + | Thus, when you plate E. coli by a usual method, the E. coli expresses GFP ununiformly. This is because you cannot plate E. coli enough uniformly. As long as the expression of GFP is ununiform, even if you set maximum area of cell-unit which is necessary to generate a pattern on a plate, the gaps of average mass of GFP expression between cell-units are large enough. When you set enough small area to generate pattern, you should plate uniformly so that you can consider whether the gap of mass of GFP expression between cell-units are small enough. So it is necessary to refine the plating method because the fact that the plates show a different distribution means that distribution depends on the method of plating. So, wet lab should plate many times. | |
| - | + | And, dry lab should analyze the results every time, evaluate the minimum area of the cell unit which we can consider the gap of average mass of GFP expression small enough, and provide the dates for we lab. And wet lab refines the method. Thus, if wet lab and dry lab understand enough and go some way along each other, you can construct more accurate and more reliable method. | |
| + | As we have seen, there is E. coli density which we have to consider as factors when we think about the intercellular system. On the other hand, when we think a system inside the cell, the factor E. coli density is unrelated and do not have to be considered. Therefore, from now, we’d like to think about the system inside the cell. | ||
==Conclusion== | ==Conclusion== | ||
| - | As we showed the example ’Turing Pattern’, the results of wet lab and dry lab are often different because of their lack of understanding and appreciation each other. If both of them provide more information and closely discuss together, wet lab may be able to make an experimental system which imitates the system dry lab approximated to the real system. And wet lab | + | As we showed in the example ’Turing Pattern’, the results of wet lab and dry lab are often different because of their lack of understanding and appreciation of each other. |
| + | If both of them provide more information and closely discuss together, wet lab may be able to make an experimental system which imitates the system dry lab approximated to the real system. | ||
| + | And wet lab provides quantified data of a value which are necessary to formularize. If dry lab gets these data, they can create formulae which are well adapted to a real system, and run a well simplified simulation. And if wet lab receives the anticipation data, they will be able to find more interesting results. When dry lab and wet lab join hands like this example ’Turing Pattern’, you can overthrow the future that some experiments should fail. Then, biology would evolve faster. | ||
| + | |||
==Reference== | ==Reference== | ||
| - | 1:[http://www.sciencedirect.com/science/article/pii/S0092824005800084 A.M. Turing (1990) "The chemical basis of morphogenesis" Bulletin of Mathmatical Biology Vol. 52, No. 1/2, pp. 153-197] | + | 1:[http://www.sciencedirect.com/science/article/pii/S0092824005800084 A.M. Turing (1990) "The chemical basis of morphogenesis" Bulletin of Mathmatical Biology Vol. 52, No. 1/2, pp. 153-197]<br> |
| - | + | 2:<html><a href="http://www.fbs.osaka-u.ac.jp/labs/skondo/paper/kondo%20IJDB%20review.pdf">S. Kondo et al(2009) "How animals get their skin patterns: fish pigment pattern as a live Turing wave" Int. J. Dev. Biol. 53: 851-856</a><br></html> | |
| - | + | 3:<html><a href="http://www.pnas.org/content/106/21/8429.short">Akiko Nakamasu et al(2009) "Interactions between zebrafish pigment cells responsible for the generation of Turing patterns" PNAS vol. 106 no. 21 8429–8434</a><br></html> | |
</div> | </div> | ||
</div> | </div> | ||
{{Kyoto/footer}} | {{Kyoto/footer}} | ||
Latest revision as of 12:45, 10 October 2013
count down
Contents |
Turing Model
-the problems between wet and dry-
Introduction
On Earth, there are various animals which have various patterns on their skin. The mechanism of this pattern formation has not been explained by any valid theories yet, although many hypothesis has been proposed. Among these hypothesis, there is a model pattern called Turing pattern proposed by A. Turing, a famous mathematician *1. S. Kondo *2 and some other researchers *3 suggest that some creatures’ pattern can be explained by Turing’s model. Here we will step by step explain how this Turing pattern is expressed by his model.
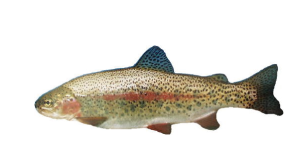
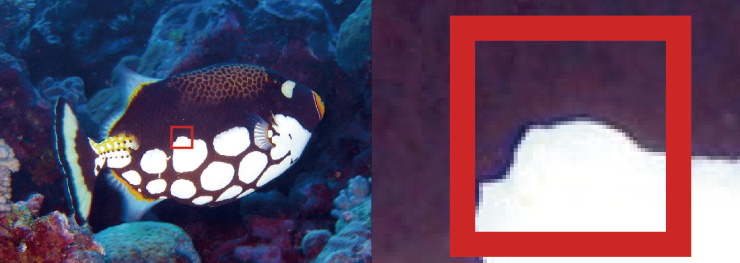
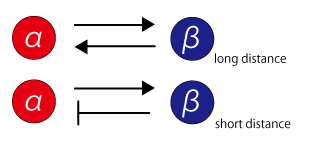
Let’s take a look on a simple hypothetical pattern formed by just two colors. Creatures’ epidermal pattern is expressed on the cells. Let’s assume that the pattern is formed by cells in different state α and β for example. A cell in state α expresses color 1 and changes close cell in state β into state α. Another Cell in state β expresses color 2 and changes close cells in state α into state β, and remote cells in state β into state α. For convenience, hereafter we call the cell in state α {α}, and cell in the state β {β}.
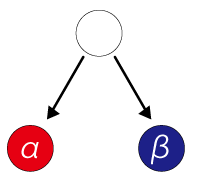
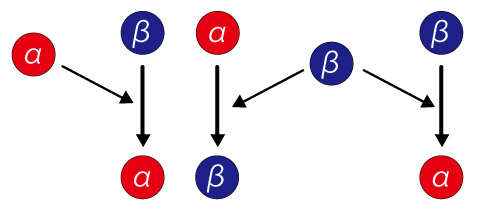
Now, we will take a look at the system where two cells {α} and {β} exist uniformly and both of the cells are in the equilibrium state of interaction. Now suppose that the density of {α} and {β} fluctuated somewhere in the system. Assume that the density of cell {β} increases as shown in the center of figure 1. First, {β} in the center changes the neighboring {α} into {β}. And next the same {β} changes the remote {β} into {α}. Then remote {α} changes neighboring {β} into {α}. The pattern forms as this interaction continues
File:Stripeform.gif
Like this model, a striped pattern is formed by close-and-remote interactions between two states of cells. When we look at this close-and-remote interaction separately, close interaction can be explained as positive feedback reaction in the aspects of polarization. Conversely, the remote interaction can be explained by negative feedback reaction
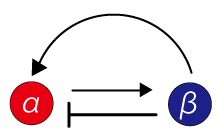
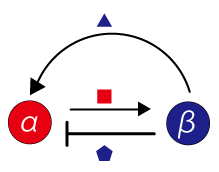
Diffusing substances such as proteins secreted from the cells determine the characters of the cells. It seems that the characters which changes close or remote cells (i.e. α and β) are function of these diffusing substances. In other words, it can be said that {α} and {β} secretes different diffusing substances, and the substances lead to close interaction (positive feedback) and remote interaction (negative feedback). Therefore, the pattern formation can be said to be formed by interaction between diffusible substances, as well as cell-cell interaction.
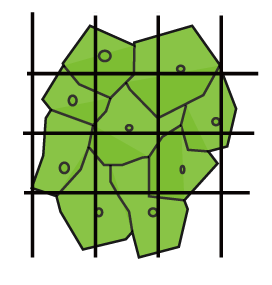
Then let’s consider about this interactions between diffusible substances in simplified model. Living organism’s body surface consists of cells shaped and sized ununiformly, therefore it is easier to understand if you assume that the body surface is a plane and consists of square cell-units sized uniformly. In this model, we can set diffusible substances which are secreted by {α} and {β}, and they increase and decrease under the influence of interactions. And then, these substances have the same characteristics of cell {α} and {β}. They lead to close interaction (positive feedback) and remote interaction (negative feedback), as a causative agent of the pattern formation on this model surfaces.

Then let’s have a look on the interaction between two diffusible substances; one leads to close interaction (positive feedback) and other leads to remote interaction (negative feedback). Hereafter we name these diffusible substances A and B. A has large diffusion velocity and represses B’s increase. B has a small diffusion velocity and promotes both A and B’s increase. If A and B have this characteristic, close interaction (positive feedback) and remote interaction (negative feedback) are formed.
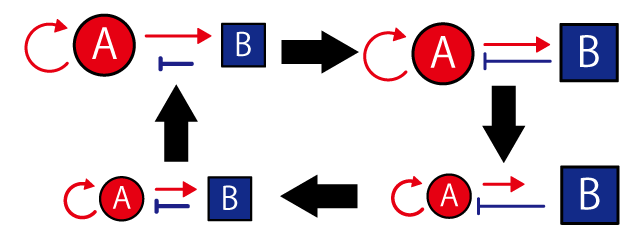
A and B forms legato density gradient due to this interaction. When each cell units have the character, “Follow the color of the diffusion substances with the higher density of the two”, the substances’ density gradient can be imagined by patterns of the cells.
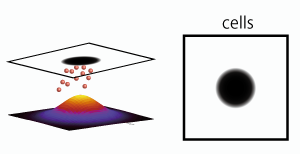
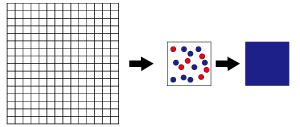
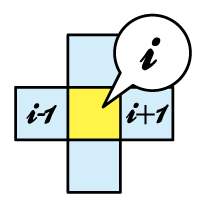
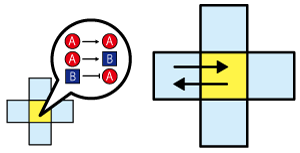
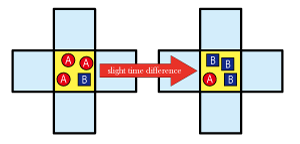
Now let’s consider how these two diffusible substances interact with each other in each cell unit. The amount of two diffusible substances in each cell unit changes only by diffusion and interaction. Then let’s focus on a certain cell unit (i) and consider the change of the concentration. The change in the amount of substances by diffusion is caused by the difference between outflow and inflow. Change by the interaction is dependent on the amount of A and B at a certain moment.


Actually, this formula is the same as reaction-diffusion which is proposed by Turing for the purpose of explaining each factors of Turing pattern formation. It seems to be difficult to understand the content of these formulae. We’re going to explain the content.
![]() ,
, ![]() and
and ![]() are the constant numbers which indicates how big the influence on interaction of each diffusible substances per unit quantity is.
In other words, these terms returns the amount of A and B at a moment if we substitute the amount of A and B at an anterior moment.
are the constant numbers which indicates how big the influence on interaction of each diffusible substances per unit quantity is.
In other words, these terms returns the amount of A and B at a moment if we substitute the amount of A and B at an anterior moment.
![]() and
and ![]() are the constant numbers peculiar to each diffusible substance which indicates the tendency of diffusion of A and B here. In other words, the terms
are the constant numbers peculiar to each diffusible substance which indicates the tendency of diffusion of A and B here. In other words, the terms ![]() and
and ![]() are the superficial inflow-outflow budget depending on diffusion of A and B. This is the contents which are described by the equitation.
are the superficial inflow-outflow budget depending on diffusion of A and B. This is the contents which are described by the equitation.
Experiments
We focused on the constants " ![]() ,
, ![]() ,
, ![]() " in these formulae. These are taken as "always fixed in any point" to Turing pattern. However, in fact, is it true that
" in these formulae. These are taken as "always fixed in any point" to Turing pattern. However, in fact, is it true that ![]() is always fixed in any point with Turing pattern formed by E. coli? We thought it is not always true in wet work because E. coli makes A and B. In other words, increase or decrease speed of the amounts of A and B in a certain point depends on the E. coli density in the point.
is always fixed in any point with Turing pattern formed by E. coli? We thought it is not always true in wet work because E. coli makes A and B. In other words, increase or decrease speed of the amounts of A and B in a certain point depends on the E. coli density in the point.
As long as E. coli is growing ununiformly until a steady state, E. coli density should be different between each point. This E. coli density difference makes changes of " ![]() ,
, ![]() ,
, ![]() " between each point.
" between each point.
Can we ignore the " ![]() ,
, ![]() ,
, ![]() " differences? To confirm this, we established these assays.
" differences? To confirm this, we established these assays.
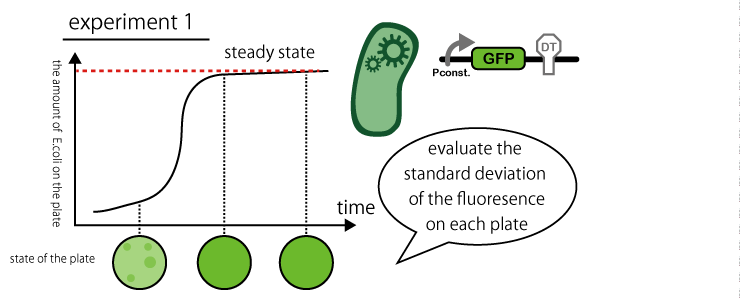
1. Confirm expression amount of GFP in both a steady state and a non-steady state with plated E. coli by common method.
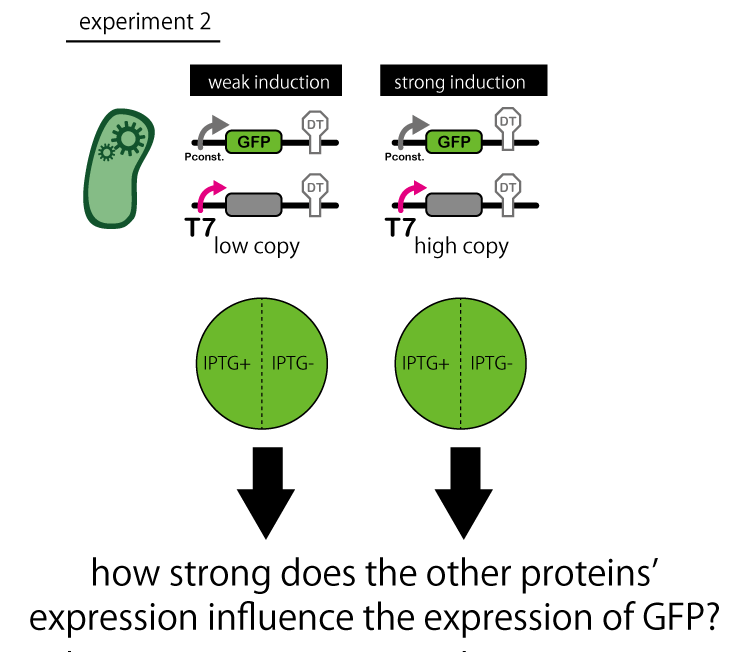
2. how strong the other proteins' expression influences the expression of GFP. Make a comparison between a state with IPTG and with no IPTG.
==Result==
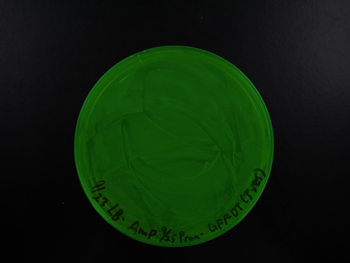
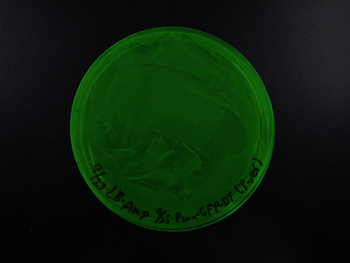
We plated transformant E. coli containing GFP generator on 2 plates at same time.
It is evident that E. coli density is ununiformly. Moreover, the two plates shows completely different distribution.
Discussion
Thus, when you plate E. coli by a usual method, the E. coli expresses GFP ununiformly. This is because you cannot plate E. coli enough uniformly. As long as the expression of GFP is ununiform, even if you set maximum area of cell-unit which is necessary to generate a pattern on a plate, the gaps of average mass of GFP expression between cell-units are large enough. When you set enough small area to generate pattern, you should plate uniformly so that you can consider whether the gap of mass of GFP expression between cell-units are small enough. So it is necessary to refine the plating method because the fact that the plates show a different distribution means that distribution depends on the method of plating. So, wet lab should plate many times. And, dry lab should analyze the results every time, evaluate the minimum area of the cell unit which we can consider the gap of average mass of GFP expression small enough, and provide the dates for we lab. And wet lab refines the method. Thus, if wet lab and dry lab understand enough and go some way along each other, you can construct more accurate and more reliable method. As we have seen, there is E. coli density which we have to consider as factors when we think about the intercellular system. On the other hand, when we think a system inside the cell, the factor E. coli density is unrelated and do not have to be considered. Therefore, from now, we’d like to think about the system inside the cell.
Conclusion
As we showed in the example ’Turing Pattern’, the results of wet lab and dry lab are often different because of their lack of understanding and appreciation of each other. If both of them provide more information and closely discuss together, wet lab may be able to make an experimental system which imitates the system dry lab approximated to the real system. And wet lab provides quantified data of a value which are necessary to formularize. If dry lab gets these data, they can create formulae which are well adapted to a real system, and run a well simplified simulation. And if wet lab receives the anticipation data, they will be able to find more interesting results. When dry lab and wet lab join hands like this example ’Turing Pattern’, you can overthrow the future that some experiments should fail. Then, biology would evolve faster.
Reference
1:[http://www.sciencedirect.com/science/article/pii/S0092824005800084 A.M. Turing (1990) "The chemical basis of morphogenesis" Bulletin of Mathmatical Biology Vol. 52, No. 1/2, pp. 153-197]
2:S. Kondo et al(2009) "How animals get their skin patterns: fish pigment pattern as a live Turing wave" Int. J. Dev. Biol. 53: 851-856
3:Akiko Nakamasu et al(2009) "Interactions between zebrafish pigment cells responsible for the generation of Turing patterns" PNAS vol. 106 no. 21 8429–8434
 "
"


