Team:Clemson/Project
From 2013.igem.org
(→Results) |
|||
| (22 intermediate revisions not shown) | |||
| Line 3: | Line 3: | ||
== '''Overall project''' == | == '''Overall project''' == | ||
| - | FDA has maintained a zero-tolerance policy for several foodborne pathogens. For example, a policy of “zero-tolerance” for Listeria monocytogenes in ready-to-eat foods means that the detection of any L. monocytogenes in either of two 25 gram samples of a food renders the food adulterated; the infectious dosage of E. coli O157:H7 has been determined to be 10 cells; the Environmental Protection Agency standard for E. coli O157:H7 in water is 40 cells per liter. The current detection methods suffer from one or more of the following limitations: 1) the requirement of pre-enrichment and enrichment to increase the number of target pathogens, e.g., bio-chemical assays and immunoassays, 2) high detection limit, e.g., 10^3 – 10^5 CFU per ml or per gram of sample for immunoassays, 3) inability to distinguish viable from non-viable cells, e.g., PCR-based detection methods, 4) small sample volume capacity, e.g., microfluidic-based biosensors (µl instead of the required ml to liter capacity), 5) tedious detection procedures, and 6) the current high per-assay cost. | + | FDA has maintained a zero-tolerance policy for several foodborne pathogens. For example, a policy of “zero-tolerance” for ''Listeria monocytogenes'' in ready-to-eat foods means that the detection of any ''L. monocytogenes'' in either of two 25 gram samples of a food renders the food adulterated; the infectious dosage of ''E. coli'' O157:H7 has been determined to be 10 cells; the Environmental Protection Agency standard for ''E. coli'' O157:H7 in water is 40 cells per liter. The current detection methods suffer from one or more of the following limitations: 1) the requirement of pre-enrichment and enrichment to increase the number of target pathogens, e.g., bio-chemical assays and immunoassays, 2) high detection limit, e.g., 10^3 – 10^5 CFU per ml or per gram of sample for immunoassays, 3) inability to distinguish viable from non-viable cells, e.g., PCR-based detection methods, 4) small sample volume capacity, e.g., microfluidic-based biosensors (µl instead of the required ml to liter capacity), 5) tedious detection procedures, and 6) the current high per-assay cost. |
| - | The aim of this project is develop a Universal Self-Amplified (USA) Biosensor that addresses the aforementioned disadvantages of current detection methods. This two component system utilizes a universal signal amplification bacterial system and a unique pathogen-specific detection counterpart for a one-step detection of target microorganisms in a scalable volume. | + | The aim of this project is develop a Universal Self-Amplified ('''USA''') Biosensor that addresses the aforementioned disadvantages of current detection methods. This two component system utilizes a universal signal amplification bacterial system and a unique pathogen-specific detection counterpart for a one-step detection of target microorganisms in a scalable volume. |
| - | + | {| | |
| - | + | [[File:wikisystem.png|800px|frameless|center]] | |
| - | [[File: | + | |} |
| + | Our universal self-amplified (USA) biosensor is composed of two parts. The first part is a phage adaptor specific for each pathogen that can be identified. The phage would deliver an AHL signal sending DNA construct into any pathogen present. The second part is our USA biosensor. The USA biosensor receives the AHL signal, self-amplifies it, and puts out an easily detectable signal such as GFP. This is universal in the sense that it would amplify the AHL signal from any pathogen-specific phage adaptor. We have not yet constructed a phage delivery system, so our current system utilizes a “model pathogen” harboring a plasmid with the AHL signal sender. This model pathogen represents a bacterium that has been infected by the phage adaptor. | ||
== Results == | == Results == | ||
| - | [[File: | + | [[File:CUPlate.png|400px|thumb|center|Streak plate showing all four constructs]] |
| - | + | {| | |
| + | [[File:blueplate.png|400px|thumb|center|Transformation plate showing amilCP expression]] | ||
| + | {| | ||
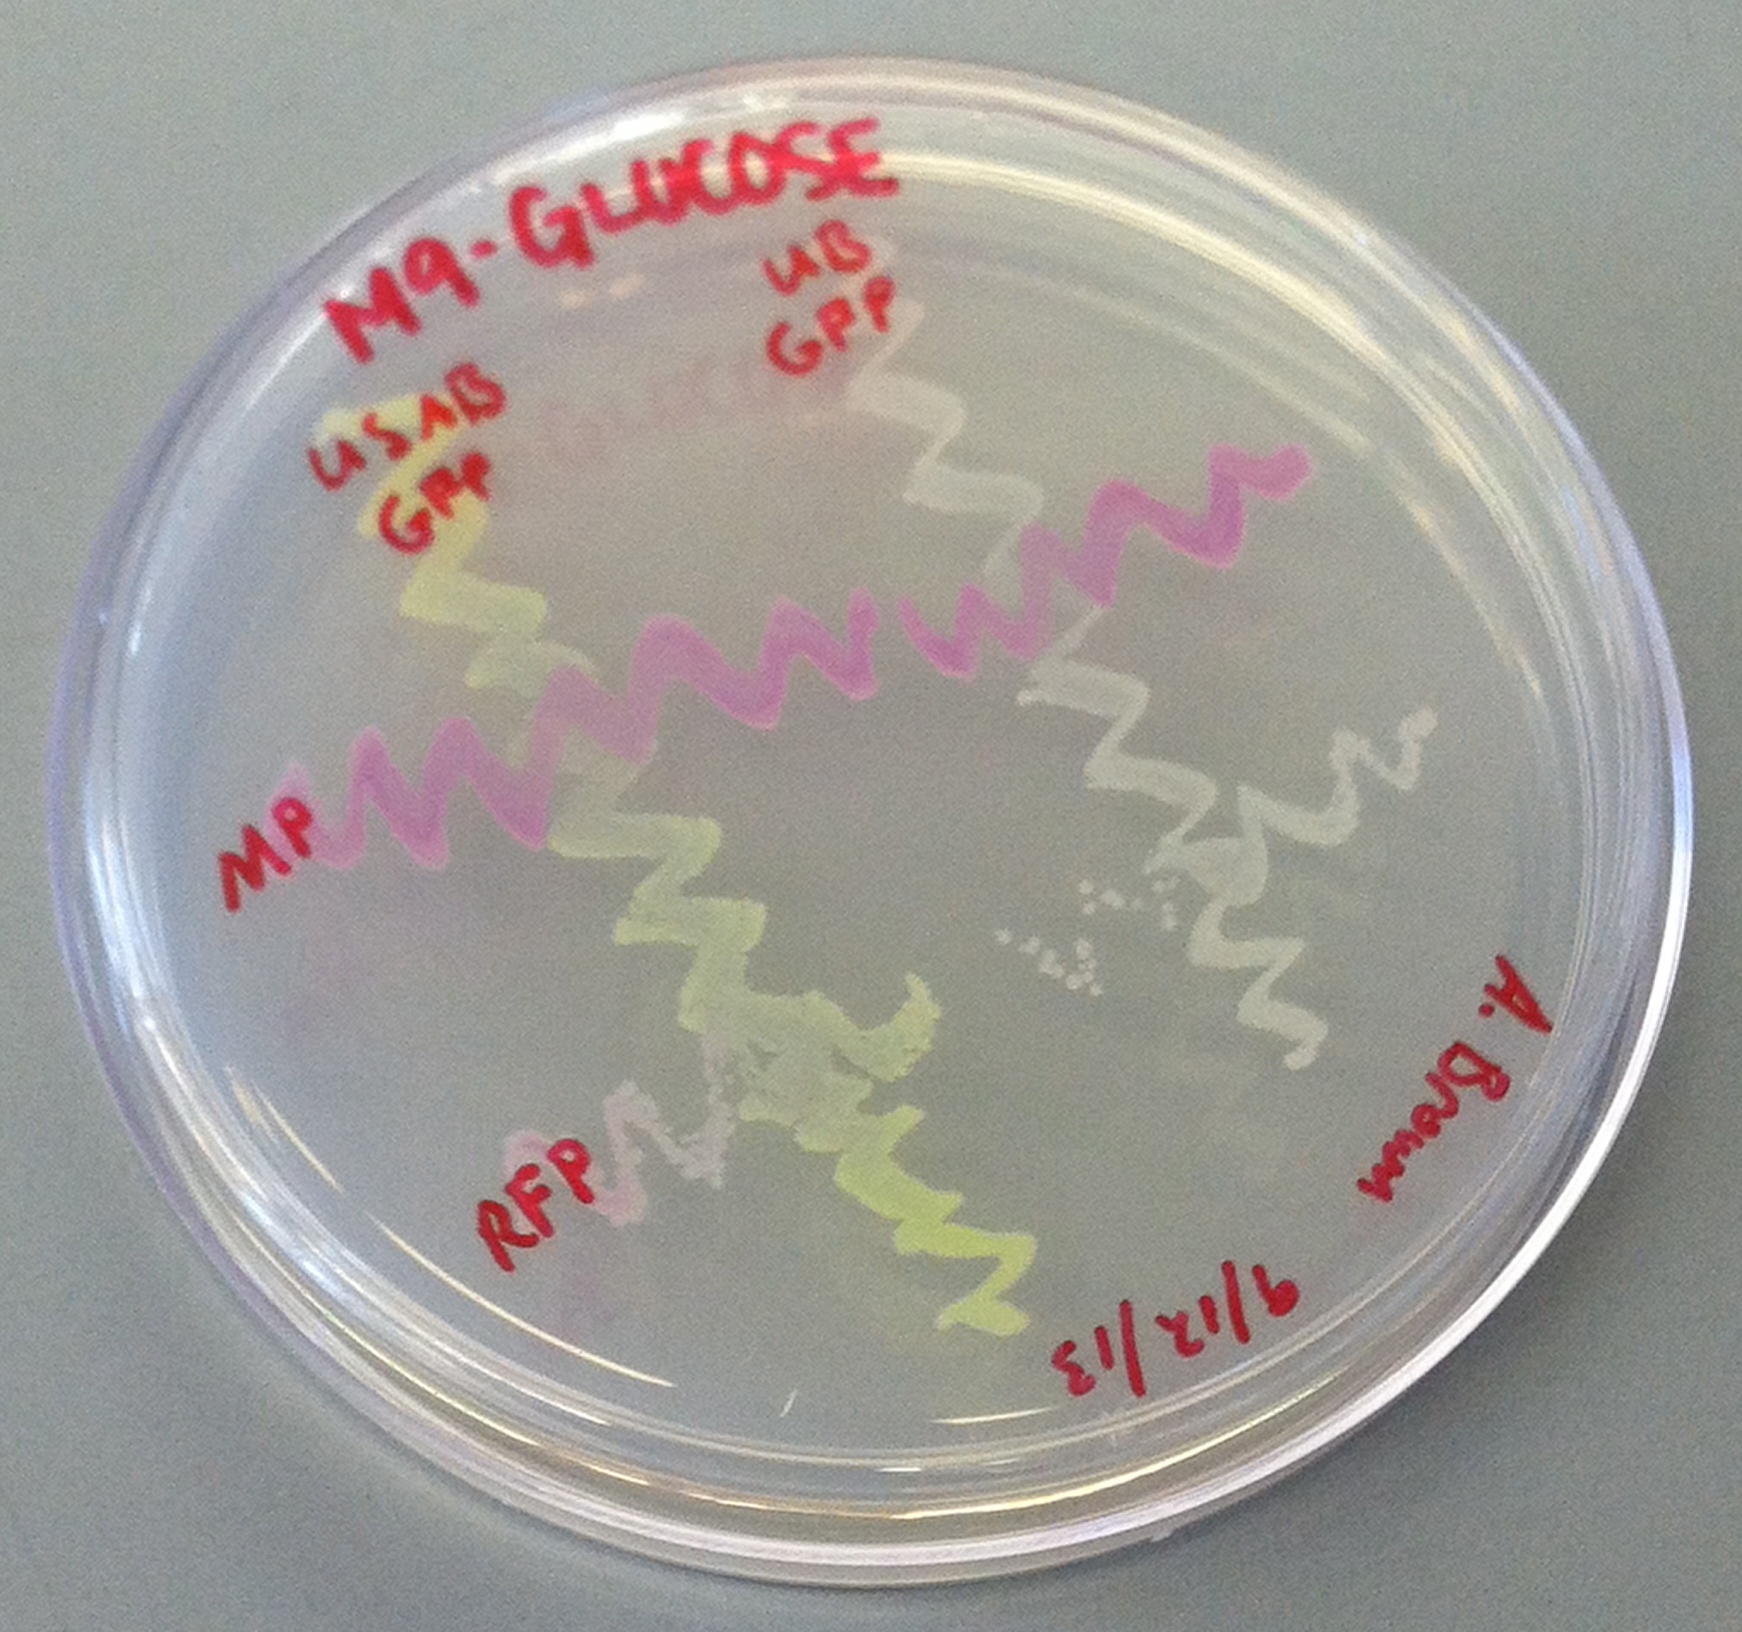
| + | ''E. coli'' DH10B cultures hosted all the plasmid constructs. A total of four cultures were used: the universal sef-amplified biosensor (USAB), the universal non-self-amplified biosensor (UB), the “model pathogen” (MP), and the negative control non-AHL-producing “model pathogen” (RFP). See above for details on the plasmid constructs of each culture. | ||
| + | <br> | ||
| + | Cultures of USAB, UB, MP, and RFP were inoculated into M9 Miller medium supplemented with glucose, thiamine, casamino acids, and IPTG. These cultures were grown overnight at 37oC with shaking. The following day, the cultures were harvested by centrifugation, washed, and resuspended in fresh medium. They were then diluted 1:100 into fresh medium and incubated further. The OD600 was not allowed to surpass 0.1 to keep them in very early log phase. After a few generations of growth (determined via increase in OD600) the cultures were again harvested and resuspended in fresh medium to set concentrations—1x10^7 cells/mL of the biosensor cultures (UB and USAB), and 1x10^3 cells/mL or a maximum of 1x10^5 cells/mL for the MP and RFP cultures. | ||
| + | <br> | ||
| + | (Previously, serial dilutions of all cultures were tested for GFP fluorescence to determine the optimal concentration of various cultures—data not shown.) | ||
| + | <br> | ||
| + | Serial 50% dilutions of MP, RFP (negative control), and AHL (positive control) were set up in a black 96-well plate. The final concentrations would range from 1x10^5 – 7.8x10^2 cells/mL for MP and RFP or 5nM – 39µM for AHL. The purified AHL (3-oxohexanoyl-homoserine lactone) was obtained from Sigma-Aldrich. USAB or UB was added to all wells to a final concentration of 1x10^7 cells/mL. | ||
| + | <br> | ||
| + | GFP fluorescence was measured periodically with an excitation wavelength of 395nm and emission of 509nm. (Note: The peak excitation of GFP mut3b (BBa_E0040) has been measured at 501nm, but our fluorescent plate reader would not read emission properly so close to the excitation value.) We took readings up to about 20 hours. | ||
| + | <br> | ||
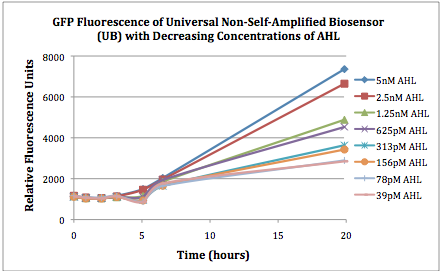
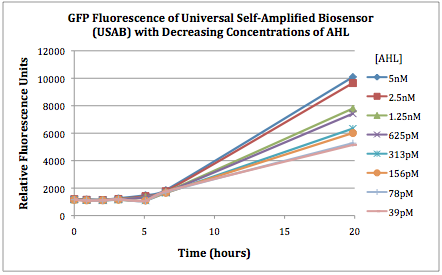
| + | The first graphs (Figure 1A and 1B) show the response of the UB and USAB, respectively, to different concentrations of AHL. As expected, higher concentrations of AHL cause relatively higher GFP emission over time. | ||
| + | <br> | ||
| + | {| | ||
| + | |[[File:CUfigure1UB.png|400px|thumb|center|Figure 1A]] | ||
| + | |[[File:CUfigure2USAB.png|400px|thumb|center|Figure 1B]] | ||
| + | |} | ||
| + | <br> | ||
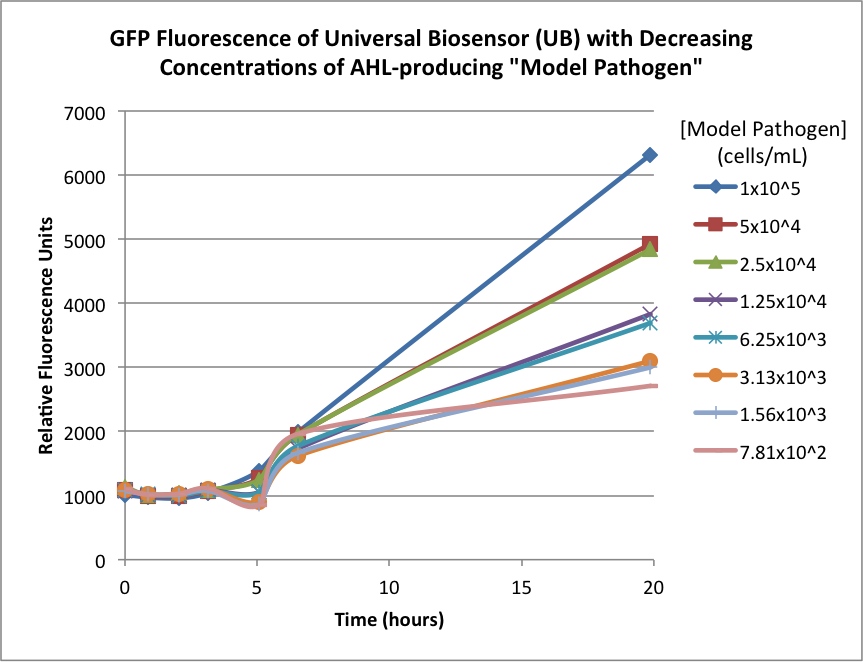
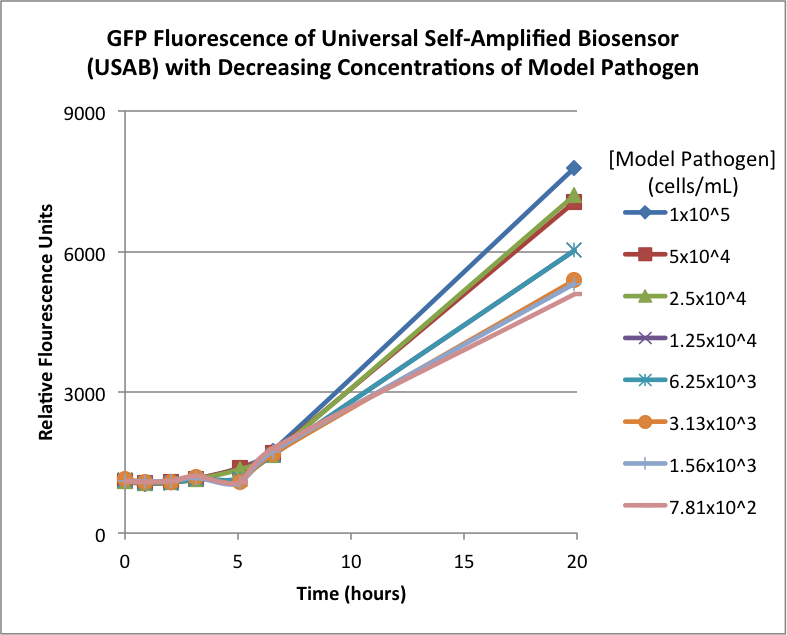
| + | Figures 2A and 2B show the response of the UB and USAB, respectively, to different concentrations of the “model pathogen.” As expected, higher concentrations of the “model pathogen,” which produces AHL, cause relatively higher GFP emission over time. | ||
| + | <br> | ||
| + | {| | ||
| + | |[[File:CUFigure3.png|370px|thumb|center|Figure 2A]] | ||
| + | |[[File:CUFigure4.png|350px|thumb|center|Figure 2B]] | ||
| + | |} | ||
| + | <br> | ||
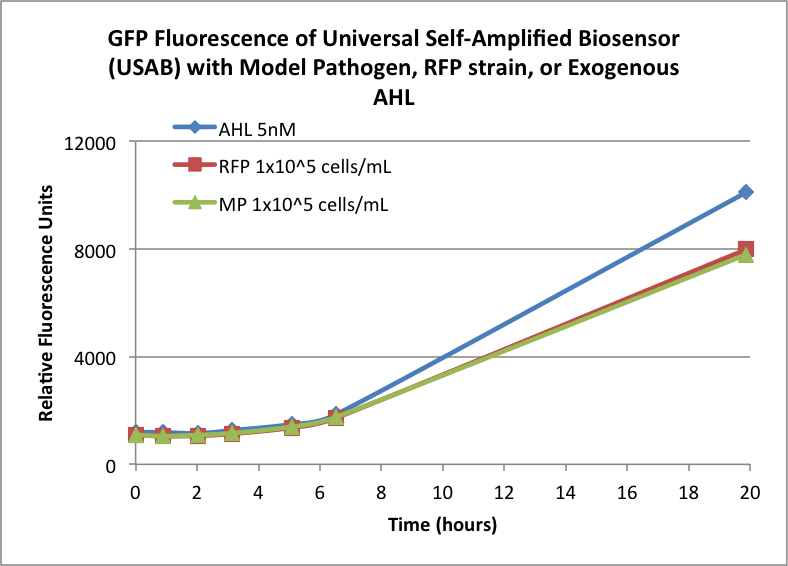
| + | Figures 3A and 3B show the response of the UB and USAB, respectively, to AHL (5nM), “model pathogen” (1x10^5 cells/mL), or RFP strain (the non-AHL-producing model pathogen at 1x10^5 cells/mL). Unexpectedly, the relative GFP emission appears to increase over time regardless of whether the strain present produces AHL. This could mean the fluorescence is increasing only as the biosensor strain grows, with GFP expression per cell remaining relatively constant. However, the presence of AHL does seem to increase the slope of fluorescence. | ||
| + | <br> | ||
| + | {| | ||
| + | |[[File:CUFigure5.png|350px|thumb|center|Figure 3A]] | ||
| + | |[[File:CUFigure6.png|365px|thumb|center|Figure 3B]] | ||
| + | |} | ||
| + | <br> | ||
| + | |} | ||
{{Team:Clemson/page-footer}} | {{Team:Clemson/page-footer}} | ||
Latest revision as of 00:49, 29 October 2013
Overall project
FDA has maintained a zero-tolerance policy for several foodborne pathogens. For example, a policy of “zero-tolerance” for Listeria monocytogenes in ready-to-eat foods means that the detection of any L. monocytogenes in either of two 25 gram samples of a food renders the food adulterated; the infectious dosage of E. coli O157:H7 has been determined to be 10 cells; the Environmental Protection Agency standard for E. coli O157:H7 in water is 40 cells per liter. The current detection methods suffer from one or more of the following limitations: 1) the requirement of pre-enrichment and enrichment to increase the number of target pathogens, e.g., bio-chemical assays and immunoassays, 2) high detection limit, e.g., 10^3 – 10^5 CFU per ml or per gram of sample for immunoassays, 3) inability to distinguish viable from non-viable cells, e.g., PCR-based detection methods, 4) small sample volume capacity, e.g., microfluidic-based biosensors (µl instead of the required ml to liter capacity), 5) tedious detection procedures, and 6) the current high per-assay cost. The aim of this project is develop a Universal Self-Amplified (USA) Biosensor that addresses the aforementioned disadvantages of current detection methods. This two component system utilizes a universal signal amplification bacterial system and a unique pathogen-specific detection counterpart for a one-step detection of target microorganisms in a scalable volume.
Our universal self-amplified (USA) biosensor is composed of two parts. The first part is a phage adaptor specific for each pathogen that can be identified. The phage would deliver an AHL signal sending DNA construct into any pathogen present. The second part is our USA biosensor. The USA biosensor receives the AHL signal, self-amplifies it, and puts out an easily detectable signal such as GFP. This is universal in the sense that it would amplify the AHL signal from any pathogen-specific phage adaptor. We have not yet constructed a phage delivery system, so our current system utilizes a “model pathogen” harboring a plasmid with the AHL signal sender. This model pathogen represents a bacterium that has been infected by the phage adaptor.
Results
Figures 2A and 2B show the response of the UB and USAB, respectively, to different concentrations of the “model pathogen.” As expected, higher concentrations of the “model pathogen,” which produces AHL, cause relatively higher GFP emission over time.
Figures 3A and 3B show the response of the UB and USAB, respectively, to AHL (5nM), “model pathogen” (1x10^5 cells/mL), or RFP strain (the non-AHL-producing model pathogen at 1x10^5 cells/mL). Unexpectedly, the relative GFP emission appears to increase over time regardless of whether the strain present produces AHL. This could mean the fluorescence is increasing only as the biosensor strain grows, with GFP expression per cell remaining relatively constant. However, the presence of AHL does seem to increase the slope of fluorescence.
 "
"


