Team:NYMU-Taipei/Modeling/Linear epidemic model
From 2013.igem.org
| (47 intermediate revisions not shown) | |||
| Line 1: | Line 1: | ||
{{:Team:NYMU-Taipei/Header}} | {{:Team:NYMU-Taipei/Header}} | ||
| - | = | + | =Epidemic model= |
| - | == | + | ==Backgrouds== |
| - | Honey bee is a social insect and can be divided into several classes – queens, drones, and workers, which can further be classified into field bee (which is responsible for getting honey from the nature) and house bee (which is responsible for cleaning hives). However, a single bee (especially field bee) may fall ill to CCD when it intakes water or food contaminated by Nosema ceranae spores. What’s worse, CCD may in turn spread to other bees through exchanging substances via mouthparts or feeding food to sacbroods. | + | Honey bee is a social insect and can be divided into several classes – queens, drones, and workers, which can further be classified into field bee (which is responsible for getting honey from the nature) and house bee (which is responsible for cleaning hives). However, a single bee (especially field bee) may fall ill to CCD when it intakes water or food contaminated by ''Nosema ceranae'' spores. What’s worse, CCD may in turn spread to other bees through exchanging substances via mouthparts or feeding food to sacbroods. |
| - | After getting into bees’ midgut, Nosema spores will germinate, elongate its polarfilament, and pierce into midgut epithelial cells to transmit its genetic material. After finishing several life cycles, the infected epithelial cells will burst, leading to the spread of Nosema spores to nearby epithelial cells. | + | After getting into bees’ midgut, ''Nosema'' spores will germinate, elongate its polarfilament, and pierce into midgut epithelial cells to transmit its genetic material. After finishing several life cycles, the infected epithelial cells will burst, leading to the spread of ''Nosema'' spores to nearby epithelial cells. |
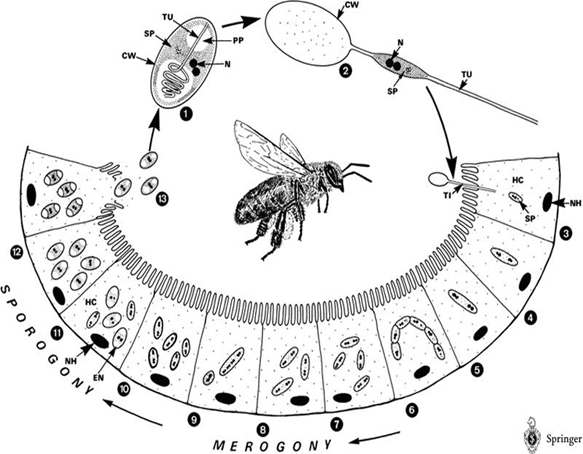
| - | The life cycle of Nosema Ceranae: | + | The life cycle of ''Nosema Ceranae'': |
[[File: NYMU_life cycle of N.png|center]] | [[File: NYMU_life cycle of N.png|center]] | ||
| - | The spores of Nosema ceranae: | + | The spores of ''Nosema ceranae'': |
| - | [[File: NYMU_99 | + | [[File: NYMU_99.png|center]] |
| - | The method is let bees ingest the encapsulated Bee. coli, which is suspended in sugar solution and will proliferate in bees’ midgut to build up bees’ immunity. | + | The method is to let bees ingest the encapsulated ''Bee. coli'', which is suspended in sugar solution and will proliferate in bees’ midgut to build up bees’ immunity. |
| - | + | ==Objectives== | |
| - | + | *How many encapsulated ''Bee. coli'' does a bee need to get immunized and be effective to spread our ''Bee. coli'' to other bees and let the whole hive be immunized. | |
| - | + | *How much time does the immunization requires and to see if it can save the whole society in time. | |
| - | + | ==System== | |
| + | '''assumptions of infection and cure process''' | ||
| + | [[File: NYMU_98.png|center]] | ||
| - | === | + | {|class="wikitable" !Model!! Symbols on the picture!! meaning |
| - | + | ! style="text-align: center;"|Model | |
| - | + | ! style="text-align: center;"| Symbols on the picture | |
| - | + | ! style="text-align: center;"|meaning | |
| - | + | |- | |
| + | |rowspan=5 style="text-align: center;"|'''epidemic''' | ||
| + | | style="text-align: center;"|suspected | ||
| + | | bees free of ''Nosema ceranae'' and having not ingested the capsule carrying Beecoli | ||
| + | |- | ||
| + | | style="text-align: center;"|latent | ||
| + | | bees infected with a low-dose ''Nosema Ceranae''. They will not spread Nosema Ceranae to other bees and are curable by ingesting the capsule carrying Beecoli | ||
| + | |- | ||
| + | | style="text-align: center;"|infected | ||
| + | | bees infected with ''Nosema Ceranae'' after a period of time that the population of ''Nosema Ceranae'' have grown too high to be killed by the capsule carrying Beecoli and thus the bees are incurable | ||
| + | |- | ||
| + | | style="text-align: center;"| ingested capsule | ||
| + | | bees ingested the capsule carrying Beecoli but the time is too short for the capsule to be digested and in effective action | ||
| + | |- | ||
| + | | style="text-align: center;"| immunized | ||
| + | | bees ingested the capsule carrying Beecoli and are totally cured after the ingested capsule are digested and in effective action | ||
| + | |} | ||
| - | + | It is assumed that the whole colony will only get into two consequences – one is dying out (once latent bees turn to be infected bees), and the other is survive (once latent or suspected bees becomes ingested capsule bees). | |
| - | + | As soon as suspected bees are infected with ''Nosema'', they will move onto the latent stage. Latent bees contain low-dose ''Nosema Ceranae'' so they will not spread ''Nosema Ceranae'' to other bees and are curable by ingesting the capsule carrying Beecoli. | |
| - | + | However, if no measures are taken to prevent proliferation of ''Nosema'' in latent bees, latent bees will move onto the infected stage. Because the number of ''Nosema'' in bees is too high to be killed thoroughly, it is no use having infected bees been cured by capsule carrying Beecoli, which means they are doomed to death. What’s worse, in the infected stage, ''Nosema'' may spread from infected bees to other bees in the colony, leading to accelaration of ''Nosema'' spreading. | |
| - | + | Another assumption is that the capsule carrying Beecoli is not all effective. Neverthless, if the capsule is effective, then bees will move onto ingested capsule stage, which means they will definitely move onto the immunized stage and be cured eventually. | |
| - | + | ||
| - | |||
| - | |||
<html> | <html> | ||
<div lang="latex" class="equation"> | <div lang="latex" class="equation"> | ||
| - | + | \frac{d[S]}{dt}= -γSE-αS </div> | |
| + | </html> | ||
| + | |||
| + | <html> | ||
| + | <div lang="latex" class="equation"> | ||
| + | \frac{d[E]}{dt}=γSE-εE-αE | ||
</div> | </div> | ||
</html> | </html> | ||
| - | |||
| - | |||
| - | |||
| - | |||
| - | |||
| - | |||
| - | |||
| - | |||
| - | |||
| - | |||
| + | <html> | ||
| + | <div lang="latex" class="equation"> | ||
| + | \frac{d[I]}{dt}=εE-μI </div> | ||
| + | </html> | ||
| - | |||
| - | |||
| - | |||
| - | |||
<html> | <html> | ||
<div lang="latex" class="equation"> | <div lang="latex" class="equation"> | ||
| - | \frac{d[ | + | \frac{d[C]}{dt}=αS +αE-βC </div> |
| - | </div> | + | |
</html> | </html> | ||
| - | |||
| - | |||
| - | |||
| - | |||
| - | |||
| - | |||
| - | |||
| - | |||
| - | |||
| - | |||
| - | |||
| - | |||
| - | |||
<html> | <html> | ||
<div lang="latex" class="equation"> | <div lang="latex" class="equation"> | ||
| - | \frac{d[ | + | \frac{d[R]}{dt}= βC </div> |
| - | </div> | + | |
</html> | </html> | ||
| - | |||
| - | |||
| - | |||
| - | |||
| - | |||
| - | |||
| - | |||
| + | [[see more]] | ||
| - | ''' | + | '''Parameters''' |
| + | N = total population | ||
| - | = | + | S = suspected |
| - | + | ||
| - | + | ||
| - | + | ||
| - | + | ||
| - | + | ||
| - | + | ||
| - | + | ||
| - | + | ||
| - | + | ||
| - | + | ||
| - | + | ||
| + | E = latent (eminent) | ||
| - | + | I = infected | |
| + | C = ingested capsule | ||
| + | |||
| + | R = immunized (recovery) | ||
| + | |||
| + | α= suspected bees/ latent beesingested capsule bees rate constant | ||
| + | |||
| + | γ= suspected bees latent bees rate constant | ||
| + | |||
| + | β= ingested capsule bees immunized bees rate constant | ||
| + | |||
| + | ε= latent bees infected bees rate constant | ||
| + | |||
| + | μ= infected bees dead bees rate constant | ||
| + | |||
| + | |||
| + | '''How capsule concentration influences Bee.coli survival rate''' | ||
| + | We do this model in order to know whether capsules ingested by bees could be effective enough. That is, whether capsules could be digested by bees’ digestive juice, Bee.coli in capsules is able to proliferate, and finally, Bee. coli could reach the effective concentration (Bee.coli/bee) to defend ''Nosema'' infection. (Figure 1.) | ||
| + | |||
| + | The data of capsule digestion rate and Bee.coli survival rate is from experiment, while Bee.coli proliferation rate is assumed according to several papers [1] and confirmed dividing output by input. | ||
| + | |||
| + | The input is capsule concentration and the function contains the transfer of capsule digestion, survival and proliferation of Bee.coli, which then generates the output of Bee.coli/bee. | ||
| + | |||
| + | Last but not least, we retrieve the standard concentration of capsule-contained sugar water which will be fed to be colony via the formula below: | ||
| - | |||
<html> | <html> | ||
<div lang="latex" class="equation"> | <div lang="latex" class="equation"> | ||
| - | + | [capsule concentration]={[Bee.coli per bee]}\times {proliferation rate}\frac {1}{{digestion rate (of capsule)}\times {survival rate (of Bee.coli})} | |
</div> | </div> | ||
</html> | </html> | ||
| - | |||
| - | |||
| - | |||
| - | |||
| - | |||
| - | |||
| - | |||
| + | [[Image:NYMU_ highlight 2.png|center]] | ||
| + | Figure1: model of capsule concentration and Bee.coli survival rate|center | ||
| + | |||
| + | |||
| + | ==Results== | ||
| + | It is assumed that the whole bee colony is infected by ''Nosema'', which is the most severe case. That is, bees are either latent or infected. According to our experiment, bees intaking sugar solution which contains capsules in a sufficient concentration have 100% of Bee. coli releasing from capsules. Here we discuss how much time it needs for the whole hive to recover from ''Nosema'' infection with different ratio of infected and latent stage. | ||
| + | |||
| + | '''1. E=10%, I= 90%''' | ||
| + | [[File: NYMU_97.png|center]] | ||
| + | |||
| + | '''2. E=30%, I=70%:''' | ||
| + | [[File: NYMU_96.png|center]] | ||
| + | |||
| + | '''3. E=70%, I=30%:''' | ||
| + | [[File: NYMU_95.png|center]] | ||
| + | |||
| + | '''4. E=90%, 10%:''' | ||
| + | [[File: NYMU_94.png|center]] | ||
| + | |||
| + | '''5. E=100%, I=0%:''' | ||
| + | [[File: NYMU_93.png|center]] | ||
| + | |||
| + | As the pictures shows, when capsule amount remains constant, the higher the latent bees percentages are, the bigger the population survive eventually; when infection severity remains constant, the more the capsules fed to the colony, the higher the survival rate. | ||
| + | |||
| + | Capsule concentration causes much differences to bee colonies in early infection stages (for example, full dose can save 70% of the curable population and 0.3 times of the full dose can only save 20% of the curable population), while bee colonies in terminal stages survival rate remain less than 10% regardless of the dosage. | ||
| + | |||
| + | No matter which ratio of latent and infected bees is, it all shows that the whole bee colony will survive eventually, which fits our assumption that the whole colony will only get into two consequences – one is dying out (once the “latent bees” turn to be the “infected bees”), and the other is survive (once the “latent” or “suspected bees” becomes “ingested capsule bees”). | ||
| + | |||
| + | To utilize this graph on agriculture, mark the current infection stage of the colony along x-axis and calculate the wanted survival rate (by dividing the wanted population of the survived beehive with current population). These two plains’ intersections points to the dosage required along y-axis. Make sure the survival rate chosen is higher than 10% so that a colony can recover from the infection. | ||
| + | |||
| + | |||
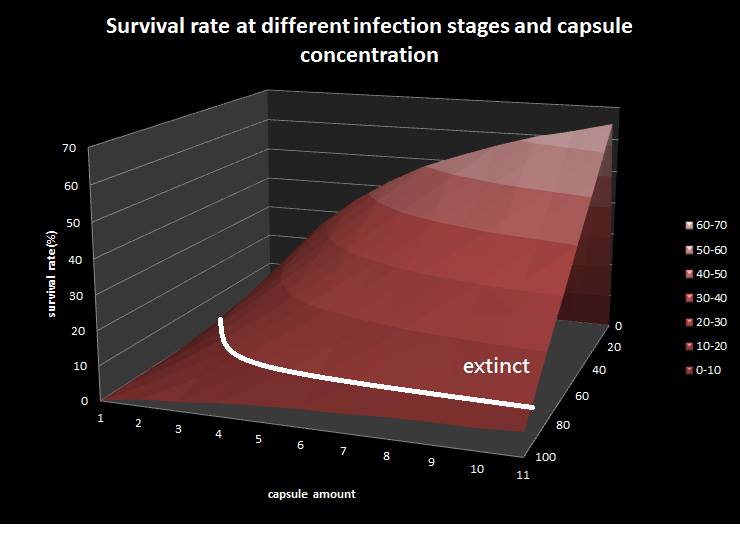
| + | [[File: NYMU_epidemic model.png|center]] | ||
| + | This is the epidemic model picture, where X-direction represents infection to latent ratio; y-direction represents capsule concentration; z-direction represents survival rate. Besides, we assume that the colony with survival rate below ten is considered extinct. The result shows that if the infection rate(the ratio of bees in infected stage to bees in latent stage) is under 80 percentage, the colony is curable by feeding our capsule. | ||
| + | |||
| + | ==Discussion== | ||
| + | |||
| + | As the pictures shows, when capsule amount remains constant, the higher the latent bees percentages are, the bigger the population survive eventually; when infection severity remains constant, the more the capsules fed to the colony, the higher the survival rate. | ||
| + | |||
| + | Capsule concentration causes much differences to bee colonies in early infection stages (for example, full dose can save 70% of the curable population and 0.3 times of the full dose can only save 20% of the curable population), while bee colonies in terminal stages survival rate remain less than 10% regardless of the dosage. | ||
| + | |||
| + | No matter which ratio of latent and infected bees is, it all shows that the whole bee colony will survive eventually, which fits our assumption that the whole colony will only get into two consequences – one is dying out (once the “latent bees” turn to be the “infected bees”), and the other is survive (once the “latent” or “suspected bees” becomes “ingested capsule bees”). | ||
| + | |||
| + | To utilize this graph on agriculture, mark the current infection stage of the colony along x-axis and calculate the wanted survival rate (by dividing the wanted population of the survived beehive with current population). These two plains’ intersections points to the dosage required along y-axis. Make sure the survival rate chosen is higher than 10% so that a colony can recover from the infection. | ||
| + | |||
| + | ==Parameters== | ||
| + | |||
| + | {| class="wikitable" | ||
| + | !Model!!Parameter!!Description!!Value!!Unit!!Reference | ||
| + | |- | ||
| + | | rowspan="6" | SEIR(exponential) | ||
| + | |||
| + | |||
| + | | colspan="1" style="text-align: center;" | b | ||
| + | | colspan="1" style="text-align: center;" | Infection rate constant of ''Nosema ceranae'' to the suspected | ||
| + | | colspan="1" style="text-align: center;" | 24/75 | ||
| + | | colspan="1" style="text-align: center;" | Period(days)-1 | ||
| + | | colspan="1" style="text-align: center;" | | ||
| + | |- | ||
| + | |style="text-align: center;" | r1 | ||
| + | | Infection rate constant of K12 to the suspected | ||
| + | | style="text-align: center;" |3/20 | ||
| + | | Period(days)-1 | ||
| + | | 1. Environment protection administration executive yuan of R.O.C Medical bacteriology of J.A.T | ||
| + | |||
| + | |- | ||
| + | |style="text-align: center;" |r2||Infection rate constant of K12 to the latent|| style="text-align: center;" |3/20 ||Period(days)-1||rowspan="2" | 2. Environment protection administration executive yuan of R.O.C.<br> 3. Medical bacteriology of J.A.T | ||
| + | |||
| + | |- | ||
| + | |style="text-align: center;" | e ||rate of the latent turns infectious||style="text-align: center;" |1/4||Period(days)-1 | ||
| + | |- | ||
| + | |style="text-align: center;" | u || Death rate of the infected || style="text-align: center;" |1/8||Period(days)-1|| | ||
| + | |- | ||
| + | |style="text-align: center;" | k || Rate of intaking capsule ||style="text-align: center;" |24/11||Period(days)-1|| | ||
| + | |- | ||
| + | | rowspan="4" |SEIR(exponential&linear) | ||
| + | | colspan="1" style="text-align: center;" | S | ||
| + | | colspan="1" style="text-align: center;" | x(1) | ||
| + | | colspan="1" style="text-align: center;" | Amount of total population | ||
| + | | colspan="1" style="text-align: center;" | | ||
| + | | colspan="1" style="text-align: center;" | | ||
| + | |- | ||
| + | |style="text-align: center;" | E | ||
| + | | style="text-align: center;" |x(2) | ||
| + | |style="text-align: center;" | Amount of suspected individuals | ||
| + | | | ||
| + | | | ||
| + | |||
| + | |- | ||
| + | |style="text-align: center;" |I||style="text-align: center;" |x(3)|| style="text-align: center;" |Amount of individuals in the latent period || || | ||
| + | |||
| + | |- | ||
| + | |style="text-align: center;" | R ||style="text-align: center;" |x(4)||style="text-align: center;" |Amount of infected individuals|| || | ||
| + | |- | ||
| + | |||
| + | |} | ||
{{:Team:NYMU-Taipei/Footer}} | {{:Team:NYMU-Taipei/Footer}} | ||
Latest revision as of 16:47, 28 October 2013


Contents |
Epidemic model
Backgrouds
Honey bee is a social insect and can be divided into several classes – queens, drones, and workers, which can further be classified into field bee (which is responsible for getting honey from the nature) and house bee (which is responsible for cleaning hives). However, a single bee (especially field bee) may fall ill to CCD when it intakes water or food contaminated by Nosema ceranae spores. What’s worse, CCD may in turn spread to other bees through exchanging substances via mouthparts or feeding food to sacbroods.
After getting into bees’ midgut, Nosema spores will germinate, elongate its polarfilament, and pierce into midgut epithelial cells to transmit its genetic material. After finishing several life cycles, the infected epithelial cells will burst, leading to the spread of Nosema spores to nearby epithelial cells.
The life cycle of Nosema Ceranae:
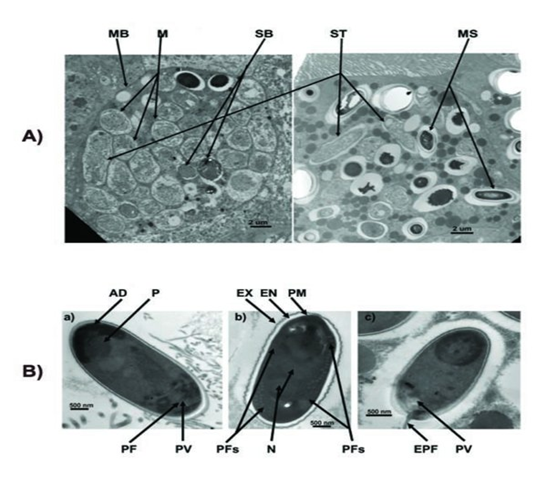
The spores of Nosema ceranae:
The method is to let bees ingest the encapsulated Bee. coli, which is suspended in sugar solution and will proliferate in bees’ midgut to build up bees’ immunity.
Objectives
- How many encapsulated Bee. coli does a bee need to get immunized and be effective to spread our Bee. coli to other bees and let the whole hive be immunized.
- How much time does the immunization requires and to see if it can save the whole society in time.
System
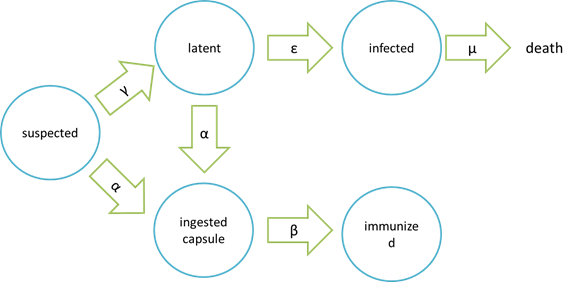
assumptions of infection and cure process
| Model | Symbols on the picture | meaning |
|---|---|---|
| epidemic | suspected | bees free of Nosema ceranae and having not ingested the capsule carrying Beecoli |
| latent | bees infected with a low-dose Nosema Ceranae. They will not spread Nosema Ceranae to other bees and are curable by ingesting the capsule carrying Beecoli | |
| infected | bees infected with Nosema Ceranae after a period of time that the population of Nosema Ceranae have grown too high to be killed by the capsule carrying Beecoli and thus the bees are incurable | |
| ingested capsule | bees ingested the capsule carrying Beecoli but the time is too short for the capsule to be digested and in effective action | |
| immunized | bees ingested the capsule carrying Beecoli and are totally cured after the ingested capsule are digested and in effective action |
It is assumed that the whole colony will only get into two consequences – one is dying out (once latent bees turn to be infected bees), and the other is survive (once latent or suspected bees becomes ingested capsule bees). As soon as suspected bees are infected with Nosema, they will move onto the latent stage. Latent bees contain low-dose Nosema Ceranae so they will not spread Nosema Ceranae to other bees and are curable by ingesting the capsule carrying Beecoli. However, if no measures are taken to prevent proliferation of Nosema in latent bees, latent bees will move onto the infected stage. Because the number of Nosema in bees is too high to be killed thoroughly, it is no use having infected bees been cured by capsule carrying Beecoli, which means they are doomed to death. What’s worse, in the infected stage, Nosema may spread from infected bees to other bees in the colony, leading to accelaration of Nosema spreading. Another assumption is that the capsule carrying Beecoli is not all effective. Neverthless, if the capsule is effective, then bees will move onto ingested capsule stage, which means they will definitely move onto the immunized stage and be cured eventually.
Parameters
N = total population
S = suspected
E = latent (eminent)
I = infected
C = ingested capsule
R = immunized (recovery)
α= suspected bees/ latent beesingested capsule bees rate constant
γ= suspected bees latent bees rate constant
β= ingested capsule bees immunized bees rate constant
ε= latent bees infected bees rate constant
μ= infected bees dead bees rate constant
How capsule concentration influences Bee.coli survival rate
We do this model in order to know whether capsules ingested by bees could be effective enough. That is, whether capsules could be digested by bees’ digestive juice, Bee.coli in capsules is able to proliferate, and finally, Bee. coli could reach the effective concentration (Bee.coli/bee) to defend Nosema infection. (Figure 1.)
The data of capsule digestion rate and Bee.coli survival rate is from experiment, while Bee.coli proliferation rate is assumed according to several papers [1] and confirmed dividing output by input.
The input is capsule concentration and the function contains the transfer of capsule digestion, survival and proliferation of Bee.coli, which then generates the output of Bee.coli/bee.
Last but not least, we retrieve the standard concentration of capsule-contained sugar water which will be fed to be colony via the formula below:
Figure1: model of capsule concentration and Bee.coli survival rate|center
Results
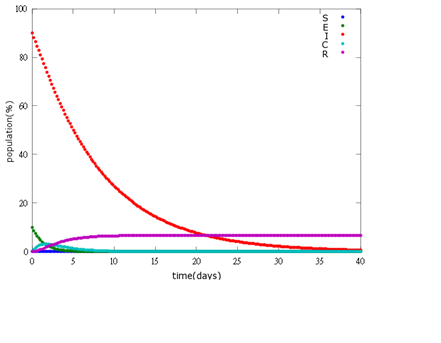
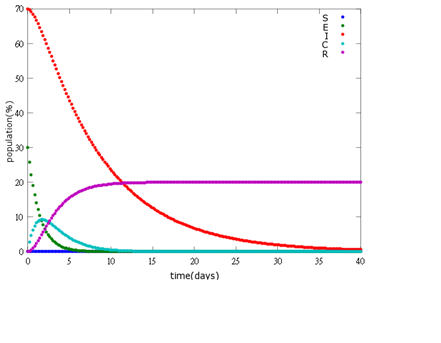
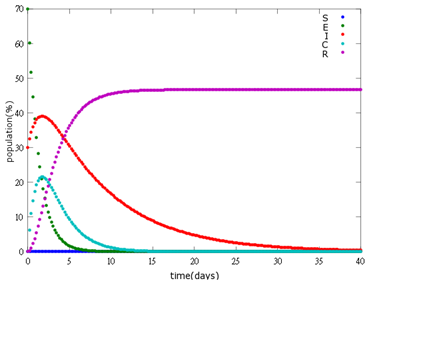
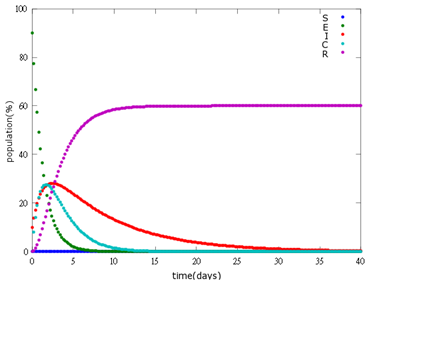
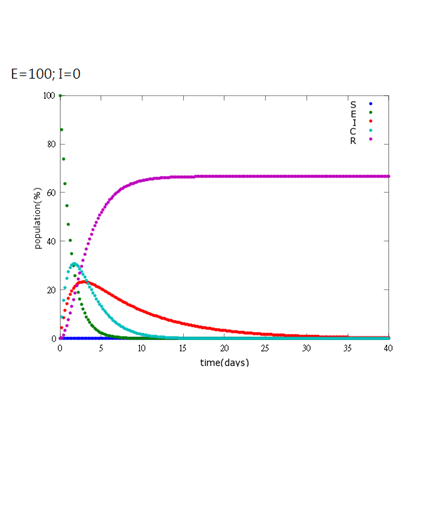
It is assumed that the whole bee colony is infected by Nosema, which is the most severe case. That is, bees are either latent or infected. According to our experiment, bees intaking sugar solution which contains capsules in a sufficient concentration have 100% of Bee. coli releasing from capsules. Here we discuss how much time it needs for the whole hive to recover from Nosema infection with different ratio of infected and latent stage.
1. E=10%, I= 90%
2. E=30%, I=70%:
3. E=70%, I=30%:
4. E=90%, 10%:
5. E=100%, I=0%:
As the pictures shows, when capsule amount remains constant, the higher the latent bees percentages are, the bigger the population survive eventually; when infection severity remains constant, the more the capsules fed to the colony, the higher the survival rate.
Capsule concentration causes much differences to bee colonies in early infection stages (for example, full dose can save 70% of the curable population and 0.3 times of the full dose can only save 20% of the curable population), while bee colonies in terminal stages survival rate remain less than 10% regardless of the dosage.
No matter which ratio of latent and infected bees is, it all shows that the whole bee colony will survive eventually, which fits our assumption that the whole colony will only get into two consequences – one is dying out (once the “latent bees” turn to be the “infected bees”), and the other is survive (once the “latent” or “suspected bees” becomes “ingested capsule bees”).
To utilize this graph on agriculture, mark the current infection stage of the colony along x-axis and calculate the wanted survival rate (by dividing the wanted population of the survived beehive with current population). These two plains’ intersections points to the dosage required along y-axis. Make sure the survival rate chosen is higher than 10% so that a colony can recover from the infection.
This is the epidemic model picture, where X-direction represents infection to latent ratio; y-direction represents capsule concentration; z-direction represents survival rate. Besides, we assume that the colony with survival rate below ten is considered extinct. The result shows that if the infection rate(the ratio of bees in infected stage to bees in latent stage) is under 80 percentage, the colony is curable by feeding our capsule.
Discussion
As the pictures shows, when capsule amount remains constant, the higher the latent bees percentages are, the bigger the population survive eventually; when infection severity remains constant, the more the capsules fed to the colony, the higher the survival rate.
Capsule concentration causes much differences to bee colonies in early infection stages (for example, full dose can save 70% of the curable population and 0.3 times of the full dose can only save 20% of the curable population), while bee colonies in terminal stages survival rate remain less than 10% regardless of the dosage.
No matter which ratio of latent and infected bees is, it all shows that the whole bee colony will survive eventually, which fits our assumption that the whole colony will only get into two consequences – one is dying out (once the “latent bees” turn to be the “infected bees”), and the other is survive (once the “latent” or “suspected bees” becomes “ingested capsule bees”).
To utilize this graph on agriculture, mark the current infection stage of the colony along x-axis and calculate the wanted survival rate (by dividing the wanted population of the survived beehive with current population). These two plains’ intersections points to the dosage required along y-axis. Make sure the survival rate chosen is higher than 10% so that a colony can recover from the infection.
Parameters
| Model | Parameter | Description | Value | Unit | Reference |
|---|---|---|---|---|---|
| SEIR(exponential)
| b | Infection rate constant of Nosema ceranae to the suspected | 24/75 | Period(days)-1 | |
| r1 | Infection rate constant of K12 to the suspected | 3/20 | Period(days)-1 | 1. Environment protection administration executive yuan of R.O.C Medical bacteriology of J.A.T | |
| r2 | Infection rate constant of K12 to the latent | 3/20 | Period(days)-1 | 2. Environment protection administration executive yuan of R.O.C. 3. Medical bacteriology of J.A.T | |
| e | rate of the latent turns infectious | 1/4 | Period(days)-1 | ||
| u | Death rate of the infected | 1/8 | Period(days)-1 | ||
| k | Rate of intaking capsule | 24/11 | Period(days)-1 | ||
| SEIR(exponential&linear) | S | x(1) | Amount of total population | ||
| E | x(2) | Amount of suspected individuals | |||
| I | x(3) | Amount of individuals in the latent period | |||
| R | x(4) | Amount of infected individuals |
 "
"


