 "
"
Team:USP-Brazil/Model:Deterministic
From 2013.igem.org
| (24 intermediate revisions not shown) | |||
| Line 17: | Line 17: | ||
were able to end up with a very simplified model that can help us to understand about the biological | were able to end up with a very simplified model that can help us to understand about the biological | ||
mechanism of the activation of the promoter P<sub>AOX</sub>. This activation is mediated by the transcript factor | mechanism of the activation of the promoter P<sub>AOX</sub>. This activation is mediated by the transcript factor | ||
| - | Mxr1 that in the presence of methanol, activates the expression of the promoter. | + | Mxr1 that in the presence of methanol, activates the expression of the promoter. However, the Mxr1 |
repress the expression of the promoter in the presence of other sources of carbon, like ethanol. Because of | repress the expression of the promoter in the presence of other sources of carbon, like ethanol. Because of | ||
that, in our experimental design we decided to use a modified Mxr1 transcript factor that instead of | that, in our experimental design we decided to use a modified Mxr1 transcript factor that instead of | ||
| Line 27: | Line 27: | ||
Initially, the transcript factor is free, <i>X<sub>f</sub></i>. Then, after | Initially, the transcript factor is free, <i>X<sub>f</sub></i>. Then, after | ||
interacting with the ethanol or methanol, it becomes <i>X<sub>et</sub></i> or | interacting with the ethanol or methanol, it becomes <i>X<sub>et</sub></i> or | ||
| - | <i>X<sub>met</sub></i>. This reaction can be | + | <i>X<sub>met</sub></i>. This reaction can be illustrated as follows:</p> |
\begin{equation} | \begin{equation} | ||
| Line 39: | Line 39: | ||
than the report protein production. Because of that, we can | than the report protein production. Because of that, we can | ||
assume that this reaction reaches quickly the equilibrium. | assume that this reaction reaches quickly the equilibrium. | ||
| - | Then at the equilibrium point we have:</p> | + | Then, at the equilibrium point we have:</p> |
\begin{equation} | \begin{equation} | ||
| Line 57: | Line 57: | ||
\end{equation} | \end{equation} | ||
| - | <p>where</p> | + | <p>where</p> $$\beta = \frac{\beta^+}{\beta^-}$$, </p>represents the reaction rate.<p> |
| - | + | ||
| - | $$\beta = \frac{\beta^+}{\beta^-}$$ | + | |
<p>A second hypothesis we will assume is that at the equilibrium, the concentration of | <p>A second hypothesis we will assume is that at the equilibrium, the concentration of | ||
<i>X<sub>f</sub></i> is much lower than the transcript factor modified by ethanol or methanol. | <i>X<sub>f</sub></i> is much lower than the transcript factor modified by ethanol or methanol. | ||
| - | In mathematical formulation:</p> | + | In a mathematical formulation:</p> |
\begin{equation} | \begin{equation} | ||
| Line 70: | Line 68: | ||
<p>This hypothesis seems quite reasonable since the concentration of methanol or ethanol is expected | <p>This hypothesis seems quite reasonable since the concentration of methanol or ethanol is expected | ||
| - | to be orders of magnitude higher than the concentration of the transcript factor. Then it | + | to be orders of magnitude higher than the concentration of the transcript factor. Then, it |
is expected that the majority of the transcript factor have interacted with those metabolites. | is expected that the majority of the transcript factor have interacted with those metabolites. | ||
We can also assume that the concentration of the metabolites do not change | We can also assume that the concentration of the metabolites do not change | ||
| Line 81: | Line 79: | ||
\end{equation} | \end{equation} | ||
| - | <p> | + | <p>where $$[X_f]_{0}$$ represents the initial concentration of the transcript factor. Then we have:</p> |
\begin{equation} | \begin{equation} | ||
| Line 89: | Line 87: | ||
[X_{met}]_{eq} = [X_f]_{0}\frac{\beta_{met}[met]}{1 + \beta_{et}[et] + \beta_{met}[met]} | [X_{met}]_{eq} = [X_f]_{0}\frac{\beta_{met}[met]}{1 + \beta_{et}[et] + \beta_{met}[met]} | ||
\end{equation} | \end{equation} | ||
| - | and using | + | and using the approximation discussed above: |
\begin{equation} | \begin{equation} | ||
[X_{et}]_{eq} \approx [X_f]_{0}\frac{\beta_{et}[et]}{\beta_{et}[et] + \beta_{met}[met]} | [X_{et}]_{eq} \approx [X_f]_{0}\frac{\beta_{et}[et]}{\beta_{et}[et] + \beta_{met}[met]} | ||
| Line 99: | Line 97: | ||
<p>Now, lets describe the model for the report protein (R) production. | <p>Now, lets describe the model for the report protein (R) production. | ||
After interacting with ethanol or methanol the transcript factor | After interacting with ethanol or methanol the transcript factor | ||
| - | activates the promoter. However, | + | activates the promoter. However, the transcript factor <i>X<sub>et</sub></i> |
| - | or <i>X<sub>met</sub></i> activates with different rates <i>k<sub>et</sub></i> or <i>k<sub>met</sub></i>, | + | or <i>X<sub>met</sub></i> activates the expression with different rates <i>k<sub>et</sub></i> or <i>k<sub>met</sub></i>, |
respectively. Then, the protein production can be described by the | respectively. Then, the protein production can be described by the | ||
following equation:</p> | following equation:</p> | ||
| Line 140: | Line 138: | ||
\begin{equation} | \begin{equation} | ||
| - | \theta_{et} = \frac{\alpha_{et}[X_{et}]}{\alpha_{et}[X_{et}] + \alpha_{met}[X_{met}]} = \frac{1}{1 + \lambda \frac{[ | + | \theta_{et} = \frac{\alpha_{et}[X_{et}]}{\alpha_{et}[X_{et}] + \alpha_{met}[X_{met}]} = \frac{1}{1 + \lambda \frac{[met]}{[et]}} |
\end{equation} | \end{equation} | ||
\begin{equation} | \begin{equation} | ||
| - | \theta_{met} = \frac{\alpha_{met}[X_{met}]}{\alpha_{et}[X_{et}] + \alpha_{met}[X_{met}]} = \frac{1}{1 + \lambda^{-1} \frac{[ | + | \theta_{met} = \frac{\alpha_{met}[X_{met}]}{\alpha_{et}[X_{et}] + \alpha_{met}[X_{met}]} = \frac{1}{1 + \lambda^{-1} \frac{[et]}{[met]}} |
\end{equation} | \end{equation} | ||
| Line 168: | Line 166: | ||
<p>Now, we ended up with a simplified model, that depends only | <p>Now, we ended up with a simplified model, that depends only | ||
on three variables, <i>k<sub>et</sub></i>, <i>k<sub>met</sub></i> and <i>λ</i>.</p> | on three variables, <i>k<sub>et</sub></i>, <i>k<sub>met</sub></i> and <i>λ</i>.</p> | ||
| - | The reference that introduces the modified version of the transcript factor MXR1 [1], | + | <p>The reference that introduces the modified version of the transcript factor MXR1 [1], |
| - | evaluate the expression of the Paox promoter for the cases: | + | evaluate the expression of the Paox promoter for the cases:</p> |
| - | |||
| - | + | <p>1) 0 % ethanol and 0.5 % methanol</p> | |
| - | + | <p>2) 0.5 % ethanol and 0.5 % methanol</p> | |
| - | and | + | <p>3) 0.5 % ethanol and 0 % methanol</p> |
| - | + | <p>and the expression measured, scaled by the expression of the GAP promoter, are:</p> | |
| - | + | <p>1) 4.1</p> | |
| - | + | <p>2) 1.8</p> | |
| + | <p>3) 0.1</p> | ||
| - | |||
| - | + | <p>then we have</p> | |
| + | |||
| + | \begin{equation} | ||
\lambda = 0.74 | \lambda = 0.74 | ||
| - | + | \end{equation} | |
| - | + | \begin{equation} | |
\hat{k_{et}} = 0.1 | \hat{k_{et}} = 0.1 | ||
| - | + | \end{equation} | |
| - | + | \begin{equation} | |
\hat{k_{met}} = 4.1 | \hat{k_{met}} = 4.1 | ||
| - | + | \end{equation} | |
| + | <p>This simplified result indicates that there is a stronger affinity of the transcript factor when modified by the methanol for the promoter than when it is modified by the ethanol, once $$k_{met} > k_{et}$$ The fact that $$\lambda<1$$ | ||
| + | indicates that the affinity of the transcript factor with the ethanol is higher than with methanol.</p> | ||
| + | <p>Now, we can evaluate the expected concentration of the report protein as a function of ethanol and methanol. The result is ilustrated in the figure below. </p> | ||
| + | <p class="figure"><img style="border:none;" src="https://static.igem.org/mediawiki/2013/e/e9/USPBrDeterModel.png" width="600" height="362" /><br /><b>Figure 1</b> graph showing the expression of RFP in different methanol and ethanol concentrations.</p> | ||
| + | <p>We can see that in the range our devide should work, concentration of etanol always higher than methanol, the variation of the concentration of the report protein is very low. This suggest some difficulties in differentiate a beverage with a tolerated level of contamination by methanol from a beverage with a non-tolerated level. Nevertheless, we point out that a more reliable conclusion can only be held with more experimental data. </p> | ||
| + | (<a href="http://nbviewer.ipython.org/urls/dl.dropboxusercontent.com/s/qxazhq2pbhq6u91/Deterministic_Model.ipynb?token_hash=AAGQ0F7IPUxf5cKazvDYnLWnmx6oxXTO75eO1lbXDATc9Q&dl=1">SOURCE CODE</a>) | ||
<div class="cf"> | <div class="cf"> | ||
<p style="float: left;"><a href="https://2013.igem.org/Team:USP-Brazil/Model:RFPVisibility"><i class="icon-circle-arrow-left"></i> See the RFP visibility study</a></p> | <p style="float: left;"><a href="https://2013.igem.org/Team:USP-Brazil/Model:RFPVisibility"><i class="icon-circle-arrow-left"></i> See the RFP visibility study</a></p> | ||
| Line 208: | Line 213: | ||
<h4 style="color:grey;">References</h4> | <h4 style="color:grey;">References</h4> | ||
| - | <p style="color:grey;">[1] </p> | + | <p style="color:grey;">[1] Parua PK, Ryan PM, Trang K, Young ET: Pichia pastoris 14-3-3 regulates transcriptional activity of the methanol inducible transcription factor Mxr1 by direct interaction. Mol Microbiol 2012, 85:282-298.</p> |
Latest revision as of 04:17, 28 September 2013
Template:Https://2013.igem.org/Team:USP-Brazil/templateUP
![]()
Deterministic model
Introduction
We used a deterministic approach in order to develop a simple mathematical model to relate the expression of a report protein RFP with different concentrations of ethanol and methanol. By making some hypothesis, we were able to end up with a very simplified model that can help us to understand about the biological mechanism of the activation of the promoter PAOX. This activation is mediated by the transcript factor Mxr1 that in the presence of methanol, activates the expression of the promoter. However, the Mxr1 repress the expression of the promoter in the presence of other sources of carbon, like ethanol. Because of that, in our experimental design we decided to use a modified Mxr1 transcript factor that instead of repressing the expression of the promoter in the presence of ethanol, it activates.
The model
We first model the reaction of the “activation” of the transcript factor, referred as (X), by ethanol or methanol. Initially, the transcript factor is free, Xf. Then, after interacting with the ethanol or methanol, it becomes Xet or Xmet. This reaction can be illustrated as follows:
\begin{equation} X_f + et \leftrightarrows X_{et} \end{equation} \begin{equation} X_f + met \leftrightarrows X_{met} \end{equation}Our first hypothesis is that this reaction occurs much faster than the report protein production. Because of that, we can assume that this reaction reaches quickly the equilibrium. Then, at the equilibrium point we have:
\begin{equation} \frac{d[X_{et}]}{dt} = \beta^{+}_{et}[et][X_f] - \beta^{-}_{et}[X_{et}] = 0 \end{equation} \begin{equation} \frac{d[X_{met}]}{dt} = \beta^{+}_{met}[met][X_f] - \beta^{-}_{met}[X_{met}] = 0 \end{equation}and so,
\begin{equation} [X_{et}]_{eq} = \beta_{et}[et][X_f]_{eq} \end{equation} \begin{equation} [X_{met}]_{eq} = \beta_{met}[met][X_f]_{eq} \end{equation}where
$$\beta = \frac{\beta^+}{\beta^-}$$, represents the reaction rate.
A second hypothesis we will assume is that at the equilibrium, the concentration of Xf is much lower than the transcript factor modified by ethanol or methanol. In a mathematical formulation:
\begin{equation} [X_{f}]_{eq} \ll ( [X_{et}]_{eq}+[X_{met}]_{eq} ) \end{equation}This hypothesis seems quite reasonable since the concentration of methanol or ethanol is expected to be orders of magnitude higher than the concentration of the transcript factor. Then, it is expected that the majority of the transcript factor have interacted with those metabolites. We can also assume that the concentration of the metabolites do not change in time by this reaction.
Now we can use the following conservation rule:
\begin{equation} [X_{f}]_{0} = [X_f]_{eq} + [X_{et}]_{eq} + [X_{met}]_{eq} \end{equation}where $$[X_f]_{0}$$ represents the initial concentration of the transcript factor. Then we have:
\begin{equation} [X_{et}]_{eq} = [X_f]_{0}\frac{\beta_{et}[et]}{1 + \beta_{et}[et] + \beta_{met}[met]} \end{equation} \begin{equation} [X_{met}]_{eq} = [X_f]_{0}\frac{\beta_{met}[met]}{1 + \beta_{et}[et] + \beta_{met}[met]} \end{equation} and using the approximation discussed above: \begin{equation} [X_{et}]_{eq} \approx [X_f]_{0}\frac{\beta_{et}[et]}{\beta_{et}[et] + \beta_{met}[met]} \end{equation} \begin{equation} [X_{met}]_{eq} \approx [X_f]_{0}\frac{\beta_{met}[met]}{\beta_{et}[et] + \beta_{met}[met]} \end{equation}Now, lets describe the model for the report protein (R) production. After interacting with ethanol or methanol the transcript factor activates the promoter. However, the transcript factor Xet or Xmet activates the expression with different rates ket or kmet, respectively. Then, the protein production can be described by the following equation:
\begin{equation} \frac{d[R]}{dt} = k_{et}\theta_{et} + k_{met}\theta_{met} - \gamma [R] \end{equation}where θet represents the fraction of the time the promoter is activated by Xet. Since the activation of the promoter occurs at the same scale of the protein production promoter P, that can be represent as:
\begin{equation} P_f + X_{et} \leftrightarrows P_{et} \end{equation} \begin{equation} P_f + X_{met} \leftrightarrows P_{met} \end{equation}from this system:
\begin{equation} \frac{d[P_{et}]}{dt} = \alpha^{+}_{et}[X_{et}][P_f] - \alpha^{-}_{et}[P_{et}] \end{equation} \begin{equation} \frac{d[P_{met}]}{dt} = \alpha^{+}_{met}[X_{met}][P_f] - \alpha^{-}_{met}[P_{met}] \end{equation}and at equilibrium:
\begin{equation} [P_{et}]_{eq} = \alpha_{et}[X_{et}]_{eq}[P_f]_{eq} \end{equation} \begin{equation} [P_{met}]_{eq} = \alpha_{met}[X_{met}]_{eq}[P_f]_{eq} \end{equation}we can obtain the fraction of time the promoter is bound by each type of transcriptor factor.
\begin{equation} \theta_{et} = \frac{\alpha_{et}[X_{et}]}{\alpha_{et}[X_{et}] + \alpha_{met}[X_{met}]} = \frac{1}{1 + \lambda \frac{[met]}{[et]}} \end{equation} \begin{equation} \theta_{met} = \frac{\alpha_{met}[X_{met}]}{\alpha_{et}[X_{et}] + \alpha_{met}[X_{met}]} = \frac{1}{1 + \lambda^{-1} \frac{[et]}{[met]}} \end{equation}where
$$\lambda = \frac{\alpha_{met} \beta_{met}}{\alpha_{et} \beta_{et}}$$Here, is important to note that we also assumed that the promoter is bound the majority of the time.
Then, at the equilibrium we have:
\begin{equation} [R]_{eq} = \frac{1}{\gamma} \left[ k_{et}\frac{1}{1 + \lambda \frac{[met]}{[et]}} + k_{met}\frac{1}{1 + \lambda^{-1} \frac{[et]}{[met]}}\right] \end{equation}or
\begin{equation} [R]_{eq} = \hat{k}_{et}\frac{1}{1 + \lambda \frac{[met]}{[et]}} + \hat{k}_{met}\frac{1}{1 + \lambda^{-1} \frac{[et]}{[met]}} \end{equation}where
$$\hat{k} = \frac{k}{\gamma}$$Now, we ended up with a simplified model, that depends only on three variables, ket, kmet and λ.
The reference that introduces the modified version of the transcript factor MXR1 [1], evaluate the expression of the Paox promoter for the cases:
1) 0 % ethanol and 0.5 % methanol
2) 0.5 % ethanol and 0.5 % methanol
3) 0.5 % ethanol and 0 % methanol
and the expression measured, scaled by the expression of the GAP promoter, are:
1) 4.1
2) 1.8
3) 0.1
then we have
\begin{equation} \lambda = 0.74 \end{equation} \begin{equation} \hat{k_{et}} = 0.1 \end{equation} \begin{equation} \hat{k_{met}} = 4.1 \end{equation}This simplified result indicates that there is a stronger affinity of the transcript factor when modified by the methanol for the promoter than when it is modified by the ethanol, once $$k_{met} > k_{et}$$ The fact that $$\lambda<1$$ indicates that the affinity of the transcript factor with the ethanol is higher than with methanol.
Now, we can evaluate the expected concentration of the report protein as a function of ethanol and methanol. The result is ilustrated in the figure below.
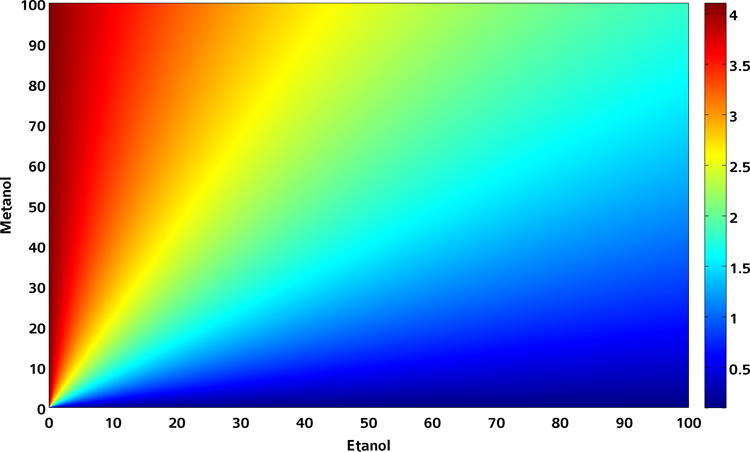
Figure 1 graph showing the expression of RFP in different methanol and ethanol concentrations.
We can see that in the range our devide should work, concentration of etanol always higher than methanol, the variation of the concentration of the report protein is very low. This suggest some difficulties in differentiate a beverage with a tolerated level of contamination by methanol from a beverage with a non-tolerated level. Nevertheless, we point out that a more reliable conclusion can only be held with more experimental data.
(SOURCE CODE)References
[1] Parua PK, Ryan PM, Trang K, Young ET: Pichia pastoris 14-3-3 regulates transcriptional activity of the methanol inducible transcription factor Mxr1 by direct interaction. Mol Microbiol 2012, 85:282-298.
RFP Visibility | Deterministic Model | Stochastic Model
Template:Https://2013.igem.org/Team:USP-Brazil/templateDOWN