Team:DTU-Denmark/Reactor Model
From 2013.igem.org
(→The Reactor) |
(→References) |
||
| (25 intermediate revisions not shown) | |||
| Line 6: | Line 6: | ||
===Summary=== | ===Summary=== | ||
| - | We want to get a first estimate of how large a reactor filled with our transformed ''E. coli'' cells must be to treat ammonia polluted wastewater. | + | We want to get a first estimate of how large a reactor filled with our transformed ''E. coli'' cells must be to treat ammonia polluted wastewater. Since Mutant 2 requires anaerobic conditions, we plan to build two reactors in series. With our model, we find that the second should be around 10 times the size of the first. This is under the assumption that all transformed proteins will be expressed at the same level, so expressing proteins at different levels is something we should look into if we want to avoid a large difference in reactor sizes. |
=== Methods === | === Methods === | ||
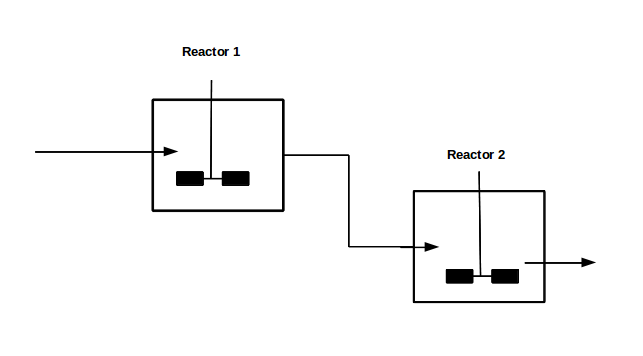
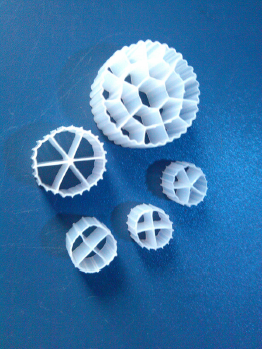
| - | With our genetically engineered ''E. coli'' we want to treat ammonia polluted waste water. The fastest way to do this would be in a continuous process like a continuous stirred tank reactor (CSTR). Ideally this process would generate an amount of nitrous oxide that is so large that the energy needed for running the system can be delivered by catalytically decomposing the nitrous oxide. We | + | With our genetically engineered ''E. coli'' we want to treat ammonia polluted waste water. The fastest way to do this would be in a continuous process like a continuous stirred tank reactor (CSTR). Ideally this process would generate an amount of nitrous oxide that is so large that the energy needed for running the system can be delivered by catalytically decomposing [1] the nitrous oxide. We have [[Team:DTU-Denmark/Bioreactor|tested a small version of this reactor]] in the lab. In practice, we would hold the engineered ''E. coli'' back in the reactor, so that the outgoing water is free of bacteria. Also we will need to use two CSTRs in sequence because the second mutant requires anaerobic conditions. A picture of two CSTR reactors in series can be found in Figure 1. Another interesting solution would be to grow a bacterial biofilm on solid carriers as shown in Figure 2, a technology known as moving bed biofilm reactor. |
[[File:DTU_modeling_2CSTR.png|500px|center]] | [[File:DTU_modeling_2CSTR.png|500px|center]] | ||
| - | Figure 1: Two CSTRs in series. | + | <b>Figure 1:</b> Two CSTRs in series. |
| Line 19: | Line 19: | ||
[[File:DTU_mod_2c.png|300px|center]] | [[File:DTU_mod_2c.png|300px|center]] | ||
| - | Figure 2: In moving bed biofilm reactors the biofilm is grown on carriers as shown above. The picture is taken from http://www.hydrotech-group.com/en/products/industrial-wwtp/mbbr/. | + | <b>Figure 2:</b> In moving bed biofilm reactors the biofilm is grown on carriers as shown above. The picture is taken from http://www.hydrotech-group.com/en/products/industrial-wwtp/mbbr/. |
| - | A CSTR can be balanced using the following equation [ | + | A CSTR can be balanced using the following equation [2]: |
[[File:DTU_mod_2a.png|200px]][[File:DTU_mod_2d.png|400px]] | [[File:DTU_mod_2a.png|200px]][[File:DTU_mod_2d.png|400px]] | ||
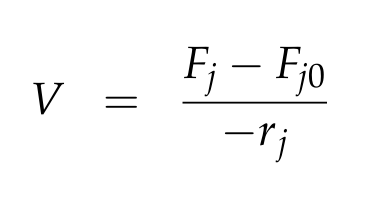
| - | For a CSTR perfect mixing is assumed, which means that the concentrations of all compounds are the same everywhere in the reactor and also at the exit point. If the system is run in steady state the so called design equation can be used to calculate the necessary volume of the reactor: | + | For a CSTR perfect mixing is assumed, which means that the concentrations of all compounds are the same everywhere in the reactor and also at the exit point. If the system is run in steady state the so called <b>design equation</b> can be used to calculate the necessary volume of the reactor: |
| - | [[File: | + | [[File:DTU_modeling_De.png|190px|center]] |
We can split the molar flow rate of species j into concentration of species j times flow. The reaction rate is dependent on the substrate concentration and can be described with Michaelis-Menten kinetics in our case: [[File:DTU_modeling_Rj.png|150px]]. So we can calculate the volume of the first reactor for series of different flow rates and substrate concentrations. | We can split the molar flow rate of species j into concentration of species j times flow. The reaction rate is dependent on the substrate concentration and can be described with Michaelis-Menten kinetics in our case: [[File:DTU_modeling_Rj.png|150px]]. So we can calculate the volume of the first reactor for series of different flow rates and substrate concentrations. | ||
| Line 38: | Line 38: | ||
However this equation does not allow a complete removal of the substrate ammonia | However this equation does not allow a complete removal of the substrate ammonia | ||
from the system, therefore we look at substrate outlet values around 10% of the | from the system, therefore we look at substrate outlet values around 10% of the | ||
| - | substrate inlet values (this corresponds to 90% of NH<sub>3</sub> conversion to NO<sub>2</sub> ). | + | substrate inlet values (this corresponds to 90% of NH<sub>3</sub> conversion to NO<sub>2</sub>). |
The matlab function describing the design equation and the script to evaluate it | The matlab function describing the design equation and the script to evaluate it | ||
for different flows and substrate concentrations can be found under scripts below. The result of evaluating the design equation for | for different flows and substrate concentrations can be found under scripts below. The result of evaluating the design equation for | ||
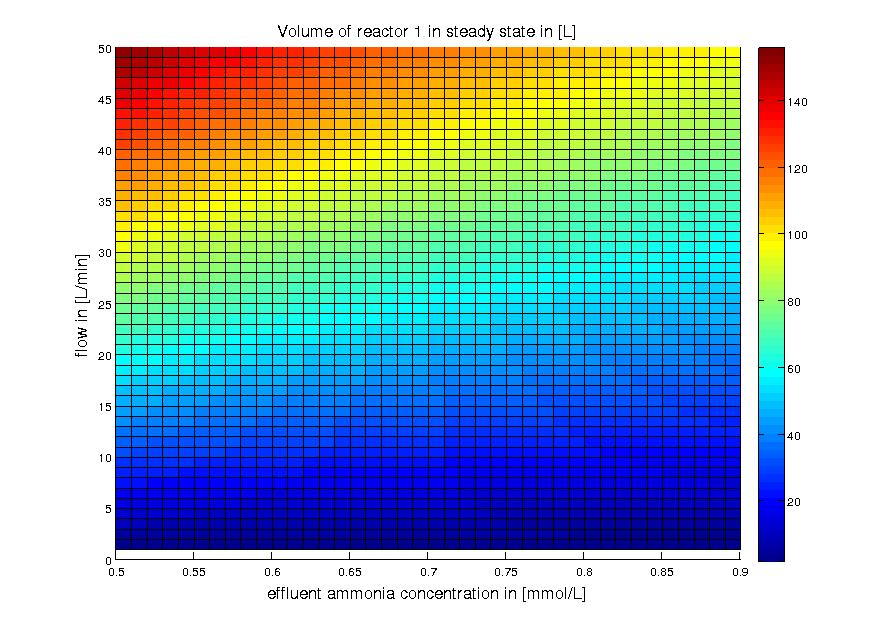
| - | different flows and substrate concentrations is shown in Figure | + | different flows and substrate concentrations is shown in Figure 3. |
The second reactor takes the effluent water of the first reactor as feed water. Assuming 90% of | The second reactor takes the effluent water of the first reactor as feed water. Assuming 90% of | ||
| - | the NH<sub>3</sub>is converted to NO<sub>2</sub> this means that the feed water of the second reactor | + | the NH<sub>3</sub> is converted to NO<sub>2</sub> this means that the feed water of the second reactor |
will contain 5.2848 mM NO<sub>2</sub> (if the NH<sub>3</sub> concentration in the feed water of the first | will contain 5.2848 mM NO<sub>2</sub> (if the NH<sub>3</sub> concentration in the feed water of the first | ||
| - | reactor was 5.872 mM as described above). | + | reactor was 5.872 mM as described above). To reach an initial estimation of the necessary reactor size we assume that the conversion |
of NO to N<sub>2</sub>O happens instantaneously. This is reasonable because NO is toxic to | of NO to N<sub>2</sub>O happens instantaneously. This is reasonable because NO is toxic to | ||
the cells and should therefore not accumulate, further the reaction of NO<sub>2</sub> to NO is | the cells and should therefore not accumulate, further the reaction of NO<sub>2</sub> to NO is | ||
slower than that of NO to N<sub>2</sub>O. | slower than that of NO to N<sub>2</sub>O. | ||
Whith this assumption we can calculate the necessary volume of the second reactor | Whith this assumption we can calculate the necessary volume of the second reactor | ||
| - | in the same way as for the | + | in the same way as for the first. The result is shown in Figure 4. |
=== Results and Discussion === | === Results and Discussion === | ||
| + | |||
| + | The required volume of reactors 1 and 2 to convert around 80% of the of the ammonia in water polluted with 100 mg/L ammonia is shown in Figures 3 and 4. The result is of course highly dependent on the desired flow. Overall, reactor 2 should be around 10 times as big as reactor 1. However the underlying assumption here is that all transformed proteins are produced at the same level. Perhaps it will make sense to vary expression levels in order to reduce the size difference of the two reactors. Our [https://2013.igem.org/Team:DTU-Denmark/pBAD_SPL promotor library] will be useful for this. | ||
| + | |||
| + | |||
| + | [[File:DTU_modeling_cstr_steady_state_volR1.jpg|600px|center]] | ||
| + | |||
| + | <b>Figure 3:</b> Reactor 1: volume for different flow rates and substrate (ammonia) effluent water | ||
| + | concentrations around 10% of the substrate feed water concentrations. The ammonia | ||
| + | concentration in the feed water is 100 mg/L (5.872 mM). The volume was calculated | ||
| + | for a steady state application using the design equation. | ||
| + | |||
| + | |||
| + | [[File:DTU_modeling_cstr_steady_state_vol_reactor2.jpg|600px|center]] | ||
| + | |||
| + | <b>Figure 4:</b> Reactor 2: volume for different flow rates and product (nitrous | ||
| + | oxide) effluent water concentrations. The product concentrations correspond to around 90% of the nitrite and around 80% of the ammonia being converted to nitrous oxide. The | ||
| + | ammonia concentration in the feed water of reactor 1 was 100 mg/L (5.872 mM). The | ||
| + | volume of reactor 2 was calculated for a steady state application using the design equation. | ||
=== References === | === References === | ||
| - | [1] | + | [1] Scherson, Yaniv D. et al. "Nitrogen removal with energy recovery through N2O decomposition" ''Energy&Environmental Science'' 6.1, 2013: 241-248 |
| + | |||
| + | [2] H. Scott Fogler. ''Essentials of Chemical Reaction Engineering''. Prentice Hall, 2010 | ||
| + | |||
| + | ===Scripts=== | ||
| + | |||
| + | [https://2013.igem.org/Team:DTU-Denmark/script_reactor_1_equation Matlab function of design equation for reactor 1] | ||
| + | |||
| + | [https://2013.igem.org/Team:DTU-Denmark/code_reactor1#Matlab_code_to_generate_Figure_3 Matlab code to generate Figure 3] | ||
| + | |||
| + | [https://2013.igem.org/Team:DTU-Denmark/script_reactor_2_equation Matlab function of design equation for reactor 2] | ||
| + | |||
| + | [https://2013.igem.org/Team:DTU-Denmark/code_reactor2 Matlab code to generate Figure 4] | ||
| - | |||
| - | |||
| - | |||
{{:Team:DTU-Denmark/Templates/EndPage}} | {{:Team:DTU-Denmark/Templates/EndPage}} | ||
Latest revision as of 19:20, 4 October 2013
Contents |
The Reactor
Summary
We want to get a first estimate of how large a reactor filled with our transformed E. coli cells must be to treat ammonia polluted wastewater. Since Mutant 2 requires anaerobic conditions, we plan to build two reactors in series. With our model, we find that the second should be around 10 times the size of the first. This is under the assumption that all transformed proteins will be expressed at the same level, so expressing proteins at different levels is something we should look into if we want to avoid a large difference in reactor sizes.
Methods
With our genetically engineered E. coli we want to treat ammonia polluted waste water. The fastest way to do this would be in a continuous process like a continuous stirred tank reactor (CSTR). Ideally this process would generate an amount of nitrous oxide that is so large that the energy needed for running the system can be delivered by catalytically decomposing [1] the nitrous oxide. We have tested a small version of this reactor in the lab. In practice, we would hold the engineered E. coli back in the reactor, so that the outgoing water is free of bacteria. Also we will need to use two CSTRs in sequence because the second mutant requires anaerobic conditions. A picture of two CSTR reactors in series can be found in Figure 1. Another interesting solution would be to grow a bacterial biofilm on solid carriers as shown in Figure 2, a technology known as moving bed biofilm reactor.
Figure 1: Two CSTRs in series.
Figure 2: In moving bed biofilm reactors the biofilm is grown on carriers as shown above. The picture is taken from http://www.hydrotech-group.com/en/products/industrial-wwtp/mbbr/.
A CSTR can be balanced using the following equation [2]:
For a CSTR perfect mixing is assumed, which means that the concentrations of all compounds are the same everywhere in the reactor and also at the exit point. If the system is run in steady state the so called design equation can be used to calculate the necessary volume of the reactor:
We can split the molar flow rate of species j into concentration of species j times flow. The reaction rate is dependent on the substrate concentration and can be described with Michaelis-Menten kinetics in our case: ![]() . So we can calculate the volume of the first reactor for series of different flow rates and substrate concentrations.
To include the right enzyme concentration we need to estimate how many cells per
litre we will have in the reactor and how many enzymes each cell will contain. It
was estimated that the cells take up 40% of the volume in the reactor and that they
contain 1000 copies of each protein of the pathway (see kinetic modeling) resulting in a enzyme
concentration of 8.456 nmol/L.
However this equation does not allow a complete removal of the substrate ammonia
from the system, therefore we look at substrate outlet values around 10% of the
substrate inlet values (this corresponds to 90% of NH3 conversion to NO2).
The matlab function describing the design equation and the script to evaluate it
for different flows and substrate concentrations can be found under scripts below. The result of evaluating the design equation for
different flows and substrate concentrations is shown in Figure 3.
. So we can calculate the volume of the first reactor for series of different flow rates and substrate concentrations.
To include the right enzyme concentration we need to estimate how many cells per
litre we will have in the reactor and how many enzymes each cell will contain. It
was estimated that the cells take up 40% of the volume in the reactor and that they
contain 1000 copies of each protein of the pathway (see kinetic modeling) resulting in a enzyme
concentration of 8.456 nmol/L.
However this equation does not allow a complete removal of the substrate ammonia
from the system, therefore we look at substrate outlet values around 10% of the
substrate inlet values (this corresponds to 90% of NH3 conversion to NO2).
The matlab function describing the design equation and the script to evaluate it
for different flows and substrate concentrations can be found under scripts below. The result of evaluating the design equation for
different flows and substrate concentrations is shown in Figure 3.
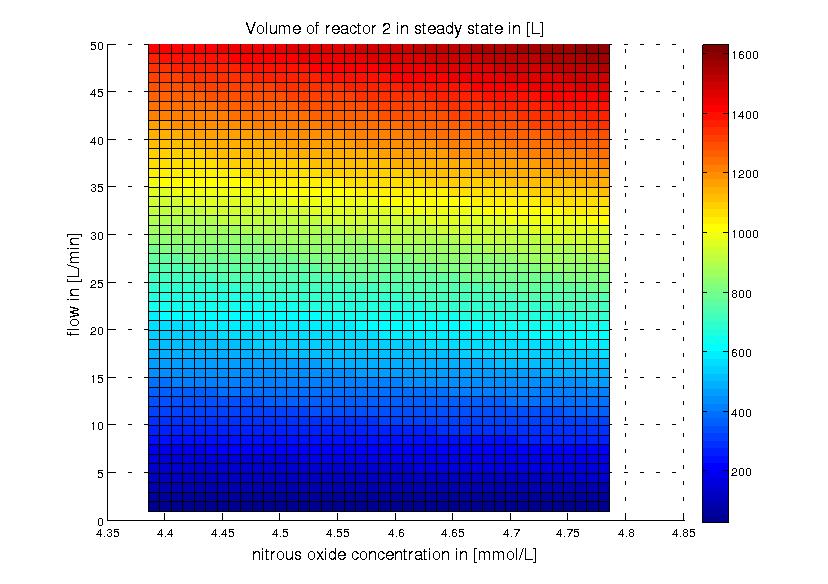
The second reactor takes the effluent water of the first reactor as feed water. Assuming 90% of the NH3 is converted to NO2 this means that the feed water of the second reactor will contain 5.2848 mM NO2 (if the NH3 concentration in the feed water of the first reactor was 5.872 mM as described above). To reach an initial estimation of the necessary reactor size we assume that the conversion of NO to N2O happens instantaneously. This is reasonable because NO is toxic to the cells and should therefore not accumulate, further the reaction of NO2 to NO is slower than that of NO to N2O. Whith this assumption we can calculate the necessary volume of the second reactor in the same way as for the first. The result is shown in Figure 4.
Results and Discussion
The required volume of reactors 1 and 2 to convert around 80% of the of the ammonia in water polluted with 100 mg/L ammonia is shown in Figures 3 and 4. The result is of course highly dependent on the desired flow. Overall, reactor 2 should be around 10 times as big as reactor 1. However the underlying assumption here is that all transformed proteins are produced at the same level. Perhaps it will make sense to vary expression levels in order to reduce the size difference of the two reactors. Our promotor library will be useful for this.
Figure 3: Reactor 1: volume for different flow rates and substrate (ammonia) effluent water concentrations around 10% of the substrate feed water concentrations. The ammonia concentration in the feed water is 100 mg/L (5.872 mM). The volume was calculated for a steady state application using the design equation.
Figure 4: Reactor 2: volume for different flow rates and product (nitrous oxide) effluent water concentrations. The product concentrations correspond to around 90% of the nitrite and around 80% of the ammonia being converted to nitrous oxide. The ammonia concentration in the feed water of reactor 1 was 100 mg/L (5.872 mM). The volume of reactor 2 was calculated for a steady state application using the design equation.
References
[1] Scherson, Yaniv D. et al. "Nitrogen removal with energy recovery through N2O decomposition" Energy&Environmental Science 6.1, 2013: 241-248
[2] H. Scott Fogler. Essentials of Chemical Reaction Engineering. Prentice Hall, 2010
Scripts
Matlab function of design equation for reactor 1
Matlab code to generate Figure 3
Matlab function of design equation for reactor 2
Matlab code to generate Figure 4
 "
"
