Team:DTU-Denmark/Kinetic Model
From 2013.igem.org
(→Summary) |
(→Results and Discussion) |
||
| (12 intermediate revisions not shown) | |||
| Line 6: | Line 6: | ||
=== Summary === | === Summary === | ||
| - | In order to determine the practicality of our solution, we are applying kinetic modeling to investigate how much time our engeneered ''E. coli'' cells will take to convert a certain amount of ammonia to nitrous oxide. For ammonia concentrations typically encountered in wastewater, our modelling shows that our transformed ''E. coli'' cells will be able to do this within minutes. | + | In order to determine the practicality of our solution, we are applying kinetic modeling to investigate how much time our engeneered ''E. coli'' cells will take to convert a certain amount of ammonia to nitrous oxide. For ammonia concentrations typically encountered in wastewater, our modelling shows that our transformed ''E. coli'' cells will be able to do this within less than 15 minutes. |
=== Methods === | === Methods === | ||
| Line 15: | Line 15: | ||
[[File:1a.png|400px|center]] | [[File:1a.png|400px|center]] | ||
| - | + | We constructed a kinetic model of our transformants based on literature research. To describe product formation by the enzymes we used the Michaelis-Menten approach (also the iGEM team from [https://2012.igem.org/Team:NYMU-Taipei Taipei in 2012] was looking into kinetic modelling of Nir and Nos): | |
[[File:DTU_mod_1b.png|330px|center]] | [[File:DTU_mod_1b.png|330px|center]] | ||
| Line 25: | Line 25: | ||
| - | [[File:DTU_modeling_Tab_1.png| | + | [[File:DTU_modeling_Tab_1.png|600px|center]] |
It is necessary to know or estimate the enzyme concentration if k<sub>cat</sub> values are used. Based on a paper we found that gives typical protein concentrations in ''E. coli'' [4] we chose to use four different enzyme concentrations in our model: 100, 500, 1000 and 100 000 enzymes per cell corresponding to low, medium, high and very high concentrations of enzyme. | It is necessary to know or estimate the enzyme concentration if k<sub>cat</sub> values are used. Based on a paper we found that gives typical protein concentrations in ''E. coli'' [4] we chose to use four different enzyme concentrations in our model: 100, 500, 1000 and 100 000 enzymes per cell corresponding to low, medium, high and very high concentrations of enzyme. | ||
| - | [[File:DTU_modeling_Enz_no.png| | + | [[File:DTU_modeling_Enz_no.png|450px|center]] |
| Line 41: | Line 41: | ||
weight of 472 kDa corresponding to 7.838 · 10<sup>−16</sup> mg. With this number we convert | weight of 472 kDa corresponding to 7.838 · 10<sup>−16</sup> mg. With this number we convert | ||
the vmax to 3.116 · 10<sup>−14</sup> μmol min<sup>−1</sup> . Then using the Avogadro number we derive a | the vmax to 3.116 · 10<sup>−14</sup> μmol min<sup>−1</sup> . Then using the Avogadro number we derive a | ||
| - | k< | + | k<sub>cat</sub> value of 18765 min<sup>−1</sup>. |
| Line 48: | Line 48: | ||
in aquatic cultures, 10 mg/L for municipal waste water and more than 100 mg/L for | in aquatic cultures, 10 mg/L for municipal waste water and more than 100 mg/L for | ||
industrial waste water. So the concentrations we want to look at in our model are: 1 | industrial waste water. So the concentrations we want to look at in our model are: 1 | ||
| - | mg/L (58.72μM), 10 mg/L (587.2μM), 100 mg/L(5.872 mM) and 500 mg/L (29.358 | + | mg/L (58.72μM), 10 mg/L (587.2μM), 100 mg/L (5.872 mM) and 500 mg/L (29.358 |
mM) ammonia. | mM) ammonia. | ||
| Line 60: | Line 60: | ||
=== Results and Discussion === | === Results and Discussion === | ||
| - | Concentration versus time plots of ammonia and nitrous oxide are shown in Figures 1-2 for different enzyme concentrations. | + | Concentration versus time plots of ammonia and nitrous oxide are shown in Figures 1-2 for different enzyme concentrations. There should at least be around 500 copies of each enzyme in the cell to convert the ammonia in a reasonable time. Especially in Mutant 2 the conversion takes long but with 1000 enzymes per cell the converion times is little more than 20 minutes for an extreme concentration of 500 mg/L ammonia. The plots shown here are estimations based on literature research and will be corrected once we have experimental data. |
[[File:DTU-NO2_1mg_ammonia.jpg|330px]][[File:DTU-NO2_10mg_ammonia.jpg|330px]][[File:DTU-NO2_100mg_ammonia.jpg|330px]][[File:DTU-NO2_500mg_ammonia.jpg|330px]] | [[File:DTU-NO2_1mg_ammonia.jpg|330px]][[File:DTU-NO2_10mg_ammonia.jpg|330px]][[File:DTU-NO2_100mg_ammonia.jpg|330px]][[File:DTU-NO2_500mg_ammonia.jpg|330px]] | ||
| - | Figure 1: Kinetic modeling of Mutant 1. Nitrite concentration over time based on kinetic parameters found in literature and for different enzyme and substrate (here NO<sub>2</sub>) concentrations. | + | <b>Figure 1:</b> Kinetic modeling of Mutant 1. Nitrite concentration over time based on kinetic parameters found in literature and for different enzyme and substrate (here NO<sub>2</sub>) concentrations. Click on the pictures to see them larger. |
| - | [[File:DTU- | + | [[File:DTU-N2O_1mg_nitrite.jpg|330px]][[File:DTU-N2O_10mg_nitrite.jpg|330px]][[File:DTU-N2O_100mg_nitrite.jpg|330px]][[File:DTU-N2O_500mg_nitrite.jpg|330px]] |
| - | Figure 2: Kinetic modeling of Mutant 2. Nitrous oxide concentration over time based on kinetic parameters found in literature and for different enzyme and substrate (here NO<sub>2</sub>) concentrations. | + | <b>Figure 2:</b> Kinetic modeling of Mutant 2. Nitrous oxide concentration over time based on kinetic parameters found in literature and for different enzyme and substrate (here NO<sub>2</sub>) concentrations. Click on the pictures to see them larger. |
=== References === | === References === | ||
| Line 88: | Line 88: | ||
[6] S Gilch, O Meyer, and I Schmidt. A soluble form of ammonia monooxygenase in | [6] S Gilch, O Meyer, and I Schmidt. A soluble form of ammonia monooxygenase in | ||
nitrosomonas europaea. ''Biological Chemistry'', 390(9):863–873, 2009. | nitrosomonas europaea. ''Biological Chemistry'', 390(9):863–873, 2009. | ||
| - | |||
[7] T.C. Jorgensen and L.R. Weatherley. Ammonia removal from wastewater by ion exchange in the presence of organic contaminants. ''Water Research'', 37:723–1728, 2003. | [7] T.C. Jorgensen and L.R. Weatherley. Ammonia removal from wastewater by ion exchange in the presence of organic contaminants. ''Water Research'', 37:723–1728, 2003. | ||
[8] Systems biology toolbox for matlab: A computational platform for research in systems biology. ''Bioinformatics'', 22(4):514–515, 2006. | [8] Systems biology toolbox for matlab: A computational platform for research in systems biology. ''Bioinformatics'', 22(4):514–515, 2006. | ||
| + | |||
| + | ===Scripts=== | ||
| + | |||
| + | [https://2013.igem.org/wiki/index.php?title=Team:DTU-Denmark/model_mutant1 Model of Mutant 1] | ||
| + | |||
| + | [https://2013.igem.org/wiki/index.php?title=Team:DTU-Denmark/plot_mutant1 Plot time series Mutant 1] | ||
| + | |||
| + | [https://2013.igem.org/wiki/index.php?title=Team:DTU-Denmark/model_mutant2 Model of Mutant 2] | ||
| + | |||
| + | [https://2013.igem.org/wiki/index.php?title=Team:DTU-Denmark/plot_mutant2 Plot time series of Mutant 2] | ||
| + | |||
{{:Team:DTU-Denmark/Templates/EndPage}} | {{:Team:DTU-Denmark/Templates/EndPage}} | ||
Latest revision as of 19:37, 4 October 2013
Contents |
Kinetic model of the Pathway
Summary
In order to determine the practicality of our solution, we are applying kinetic modeling to investigate how much time our engeneered E. coli cells will take to convert a certain amount of ammonia to nitrous oxide. For ammonia concentrations typically encountered in wastewater, our modelling shows that our transformed E. coli cells will be able to do this within less than 15 minutes.
Methods
The reactions of the pathway we are trying to integrate in E. coli are:
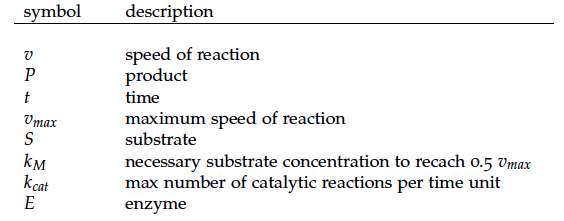
We constructed a kinetic model of our transformants based on literature research. To describe product formation by the enzymes we used the Michaelis-Menten approach (also the iGEM team from Taipei in 2012 was looking into kinetic modelling of Nir and Nos):
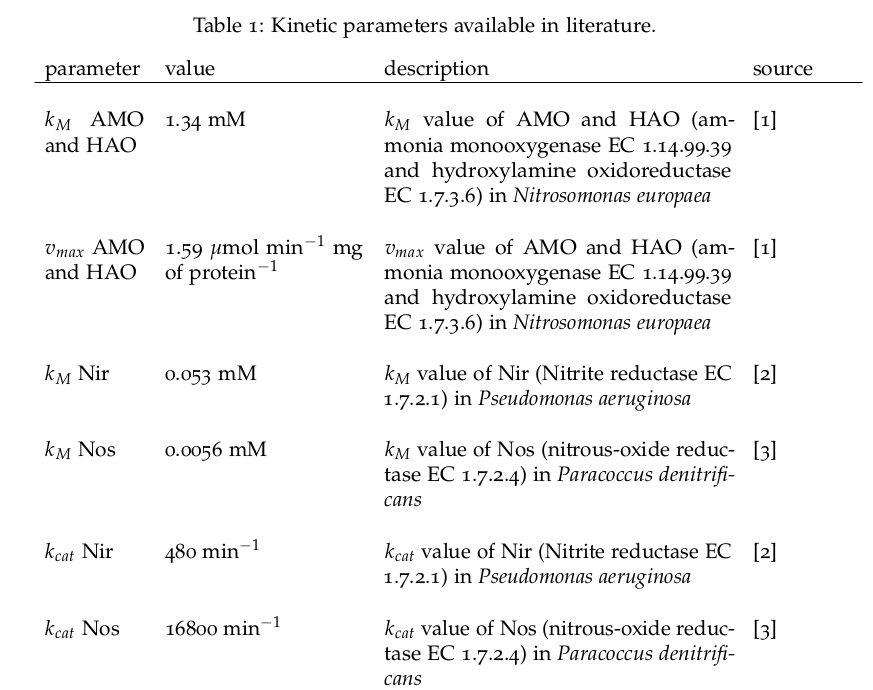
Some of the necessary parameters can be found in literature, they are listed in Table 1.
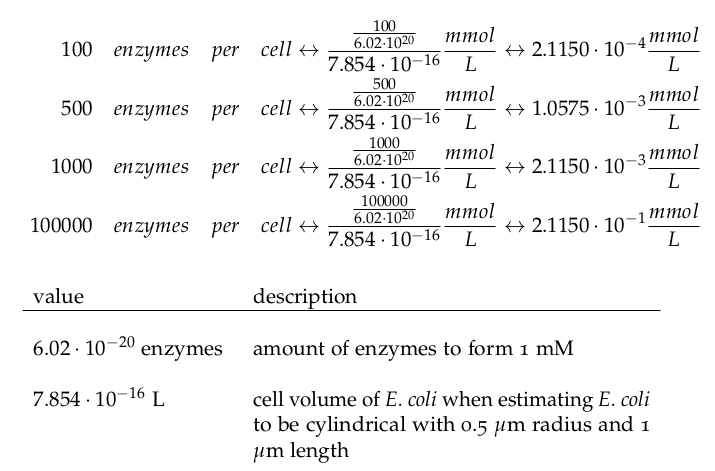
It is necessary to know or estimate the enzyme concentration if kcat values are used. Based on a paper we found that gives typical protein concentrations in E. coli [4] we chose to use four different enzyme concentrations in our model: 100, 500, 1000 and 100 000 enzymes per cell corresponding to low, medium, high and very high concentrations of enzyme.
To be consistent in units we converted the vmax value of AMO and HAO to a kcat
value in the following way:
In [5] the amount of HAO in cell extract is given as 2.6% so for our conversion we
assume 2% of the protein mass corresponds to AMO and another 2% correspond to
HAO, summing up to 4%. This leads to a value of 39.75μmol min−1 mg of enzyme−1 .
The molecular weight of AMO is given in [6] as 283 kDa and the molecular weight
of HAO is given in [5] as 189 kDa. Summing those numbers leads to a molecular
weight of 472 kDa corresponding to 7.838 · 10−16 mg. With this number we convert
the vmax to 3.116 · 10−14 μmol min−1 . Then using the Avogadro number we derive a
kcat value of 18765 min−1.
We also need to know how much ammonia the water we want to treat will contain.
The ammonia concentration in different types of waste water is given in [7] as 1 mg/L
in aquatic cultures, 10 mg/L for municipal waste water and more than 100 mg/L for
industrial waste water. So the concentrations we want to look at in our model are: 1
mg/L (58.72μM), 10 mg/L (587.2μM), 100 mg/L (5.872 mM) and 500 mg/L (29.358
mM) ammonia.
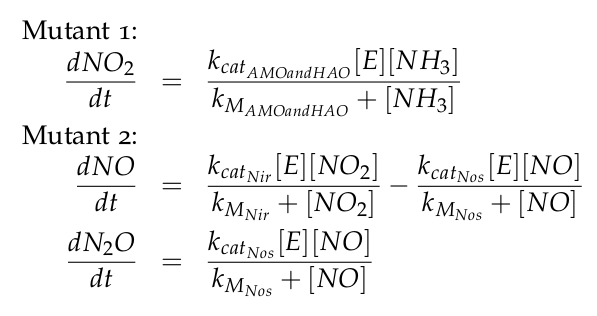
The equations of the two models for Mutant 1 and Mutant 2 are:
The modeling was done in MATLAB using the Systems Biology Toolbox [8] and the scripts are uploaded in the section scripts below.
Results and Discussion
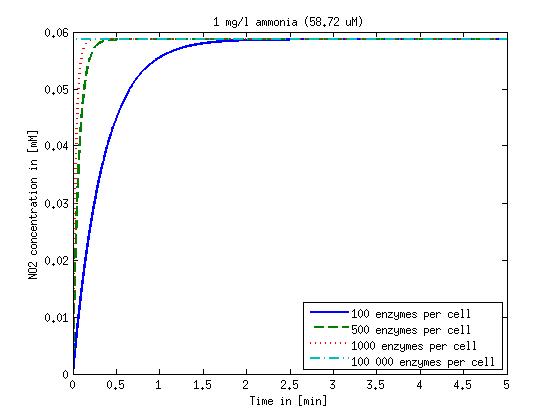
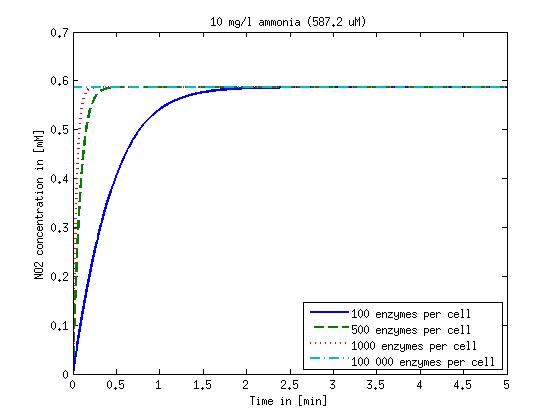
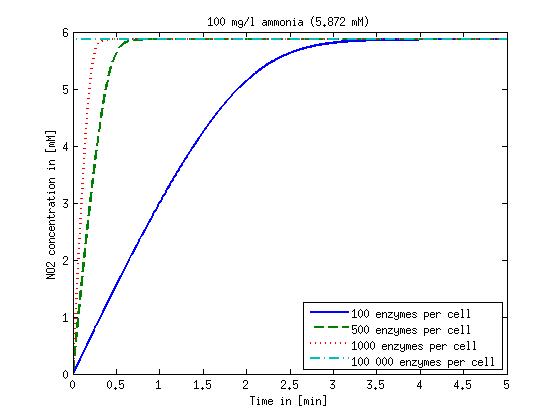
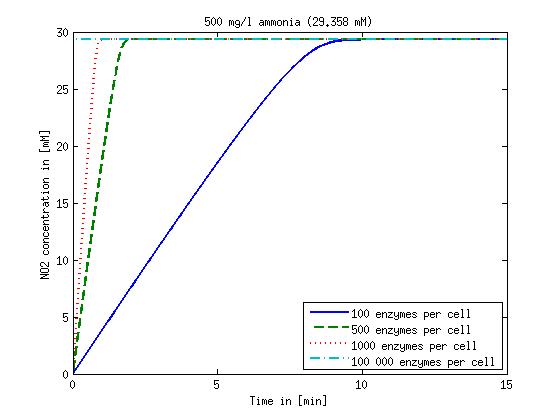
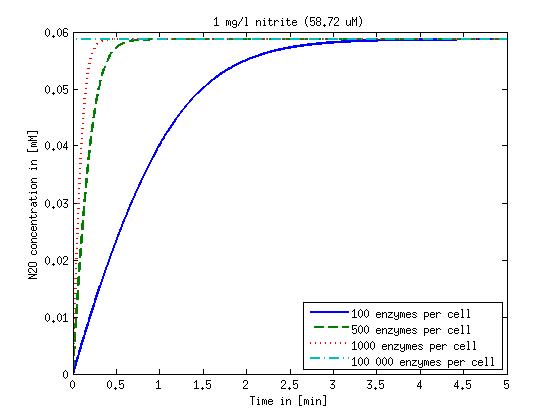
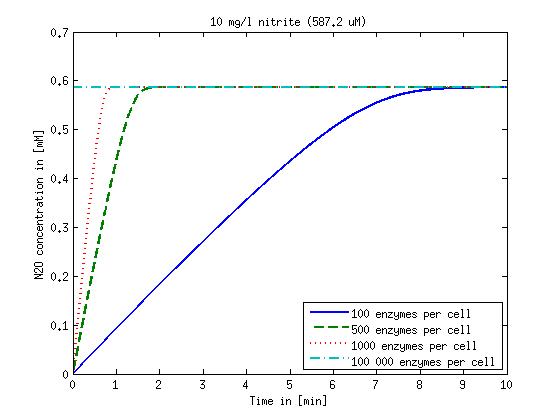
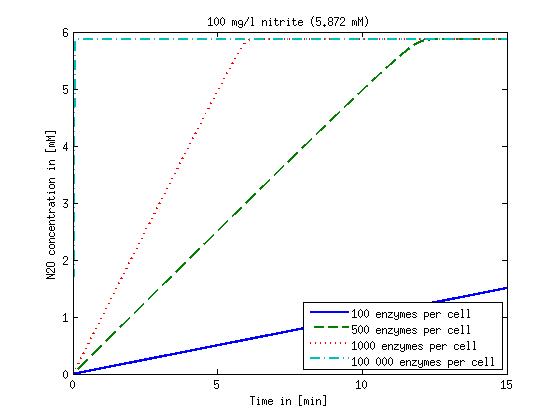
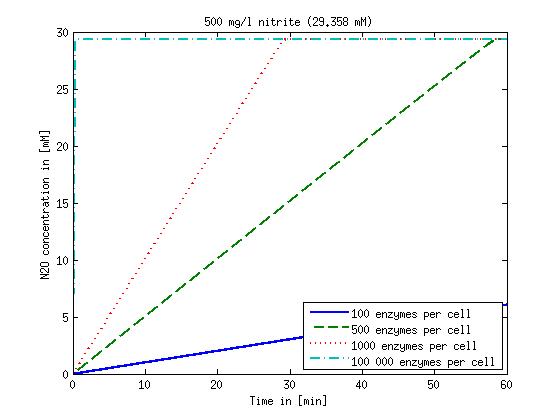
Concentration versus time plots of ammonia and nitrous oxide are shown in Figures 1-2 for different enzyme concentrations. There should at least be around 500 copies of each enzyme in the cell to convert the ammonia in a reasonable time. Especially in Mutant 2 the conversion takes long but with 1000 enzymes per cell the converion times is little more than 20 minutes for an extreme concentration of 500 mg/L ammonia. The plots shown here are estimations based on literature research and will be corrected once we have experimental data.
Figure 1: Kinetic modeling of Mutant 1. Nitrite concentration over time based on kinetic parameters found in literature and for different enzyme and substrate (here NO2) concentrations. Click on the pictures to see them larger.
Figure 2: Kinetic modeling of Mutant 2. Nitrous oxide concentration over time based on kinetic parameters found in literature and for different enzyme and substrate (here NO2) concentrations. Click on the pictures to see them larger.
References
[1] WK Keener and DJ Arp. Kinetic studies of ammonia monooxygenase inhibition in Nitrosomonas europaea by hydrocarbons and halogenated hydrocarbons in an optimized whole-cell assay. Applied and Environmental Microbiology, 59(8): 2501–2510, 1993.
[2] Serena Rinaldo. Biology of the Nitrogen Cycle. Francesca Cutruzzola, 2007 (37-55).
[3] SW Snyder and TC Hollocher. Purification and some characteristics of nitrous oxide reductase from paracoccus denitrificans. Journal of Biological Chemistry, 262: 6515–6525, 1987.
[4] Y Ishihama, T Schmidt, J Rappsilber, M Mann, FU Hartl, MJ Kerner, and D Frishman. Protein abundance profiling of the escherichia coli cytosol. BMC genomics, 9, 2008.
[5] AB Hooper, PC Maxwell, and KR Terry. Hydroxylamine oxidoreductase from nitrosomonas: Absorption spectra and content of heme and metal. Biochemistry, 17:2984–2989, 1978.
[6] S Gilch, O Meyer, and I Schmidt. A soluble form of ammonia monooxygenase in nitrosomonas europaea. Biological Chemistry, 390(9):863–873, 2009.
[7] T.C. Jorgensen and L.R. Weatherley. Ammonia removal from wastewater by ion exchange in the presence of organic contaminants. Water Research, 37:723–1728, 2003.
[8] Systems biology toolbox for matlab: A computational platform for research in systems biology. Bioinformatics, 22(4):514–515, 2006.
Scripts
 "
"


