Team:Heidelberg/Templates/DelH week20
From 2013.igem.org
m (→Result) |
m (→Result) |
||
| (One intermediate revision not shown) | |||
| Line 725: | Line 725: | ||
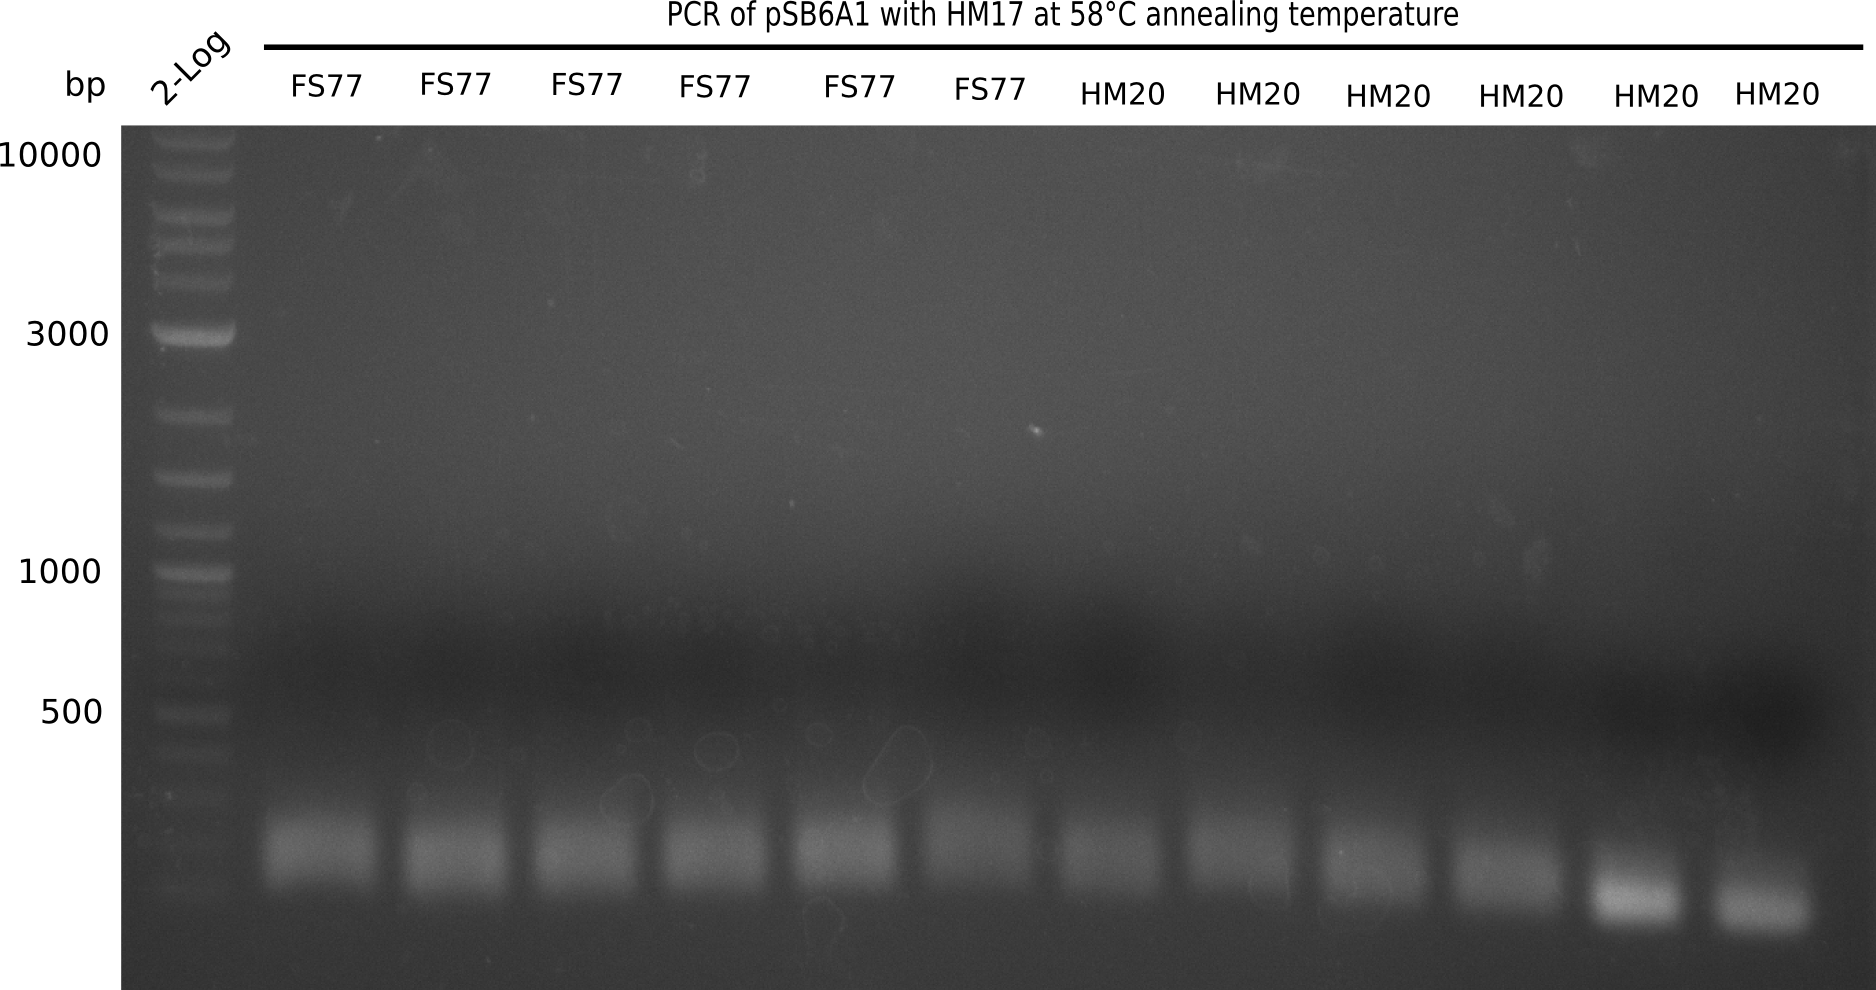
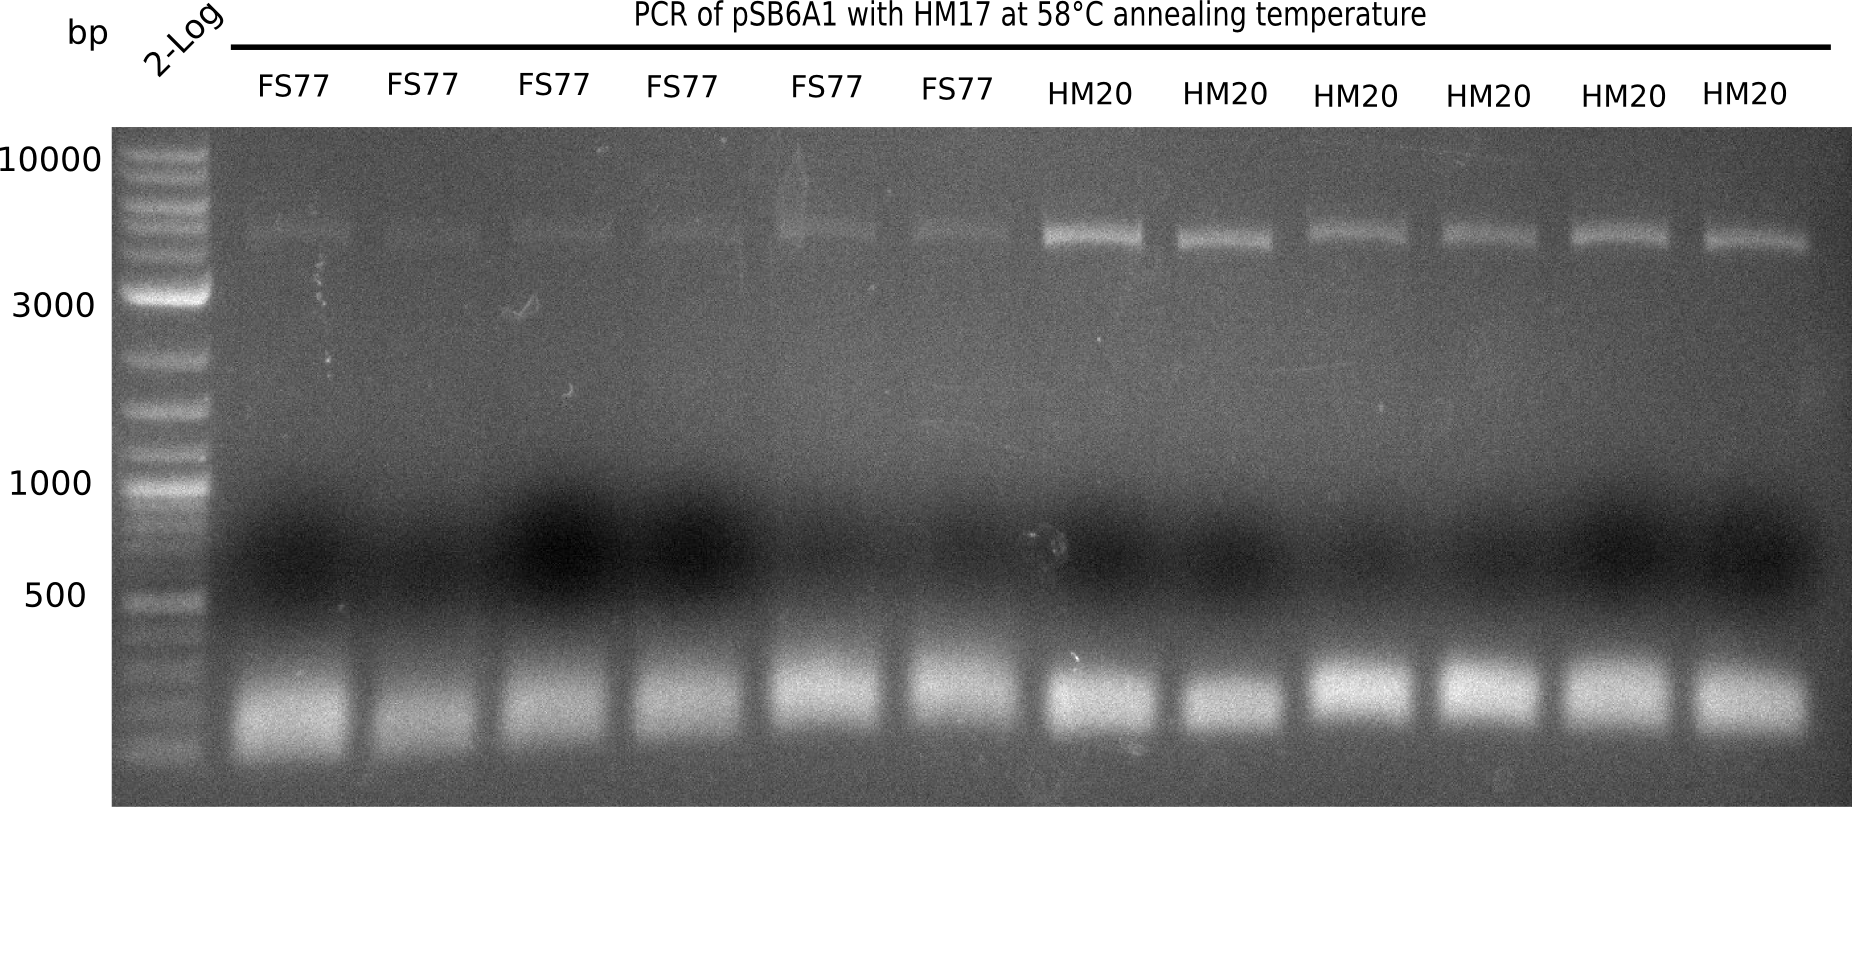
<div class="tright" style="clear:none">[[File:Heidelberg_20130915 2log 6xFS77 6xHM20 58.png|200px|thumb|right|'''Fig.20.20.''' Restriction digested BB pSB6A1 with new primer and primer HM17 at an annealing temperature of 58°C (loaded 20 µL of PCR) <br> ''l1:''2 log ladder,''l2-7:''BB amplified HM17 and FS77,''l8-13:''BB amplified HM17 and HM20 - specific band at 4 Kb]]</div> | <div class="tright" style="clear:none">[[File:Heidelberg_20130915 2log 6xFS77 6xHM20 58.png|200px|thumb|right|'''Fig.20.20.''' Restriction digested BB pSB6A1 with new primer and primer HM17 at an annealing temperature of 58°C (loaded 20 µL of PCR) <br> ''l1:''2 log ladder,''l2-7:''BB amplified HM17 and FS77,''l8-13:''BB amplified HM17 and HM20 - specific band at 4 Kb]]</div> | ||
| - | |||
Gel shows expected bands. | Gel shows expected bands. | ||
:=> Fragments were gel extracted. | :=> Fragments were gel extracted. | ||
| Line 737: | Line 736: | ||
|} | |} | ||
<br/> | <br/> | ||
| + | <div style="clear:both"></div> | ||
| + | |||
===Generation of DelH Plasmid pHM04 15-09=== | ===Generation of DelH Plasmid pHM04 15-09=== | ||
====Gibson Assembly==== | ====Gibson Assembly==== | ||
Latest revision as of 21:22, 25 October 2013
Contents |
09-09 - 15-09-13
Characterization of DelH Plasmid pHM04 30-08 Clones 4, 7, 15
Colony-PCR Conditions CP.W20.A
Because the sequenced DelH-colonies 4, 7, 15 had different kinds of mutations (Deletion of one basepair but also an insertion of a whole sequence part => results are shwon in week 19) we made a new screening PCR of 30 new picked colonies named 31-60 of the plate 2 of the electroporated cells realized in week 19.
There were 30 colonies screened.
| Template | 30x 1 PC of S-A |
| Expected length [bp] | 663 |
| Named | 31-60 |
| Primer fw 10 µM | 30x 2 µl VF2 |
| Primer rev 10 µM | 30x 2 µl DN07 |
| iTaq Polymeras (2x) | 30x 10 µl |
| ddH2O | 30x 6 µl |
| Cycles | Temperature [°C] | Time [s] |
|---|---|---|
| 1 | 95 | 120 |
| 12 | 95 | 60 |
| 68 (touchdown -0.5°C) | 30 | |
| 72 | 45 | |
| 18 | 95 | 60 |
| 65 | 30 | |
| 72 | 45 | |
| 1 | 12 | inf |
Result
Expected band: 663 bp
Colonies 33, 39, 40, 46, 51, 58 showed band.
- => Send in for sequencing after isopropanol ethanol purification.
Sequencing
The colonies 33, 39, 40, 46, 51, 58 were sent in MWG for sequencing. There for we prepared 15 µl of the plasmid (midiprep) with a concentration of 50-100 ng/µl and add 2 µl DN07 primer (10µM).
Result
| Colony | Alignment File | Conclusion |
|---|---|---|
| H33 | sequencing insufficient | |
| H39 | sequencing insufficient | |
| H40 | sequencing insufficient | |
| H46 | sequencing insufficient | |
| H51v | sequencing insufficient | |
| H58 | File:Heidelberg Sequencing Result pHM04 DN07 colony H58 DN07.clustal.txt | insertion in the primer region of DelH-backbone (pHM04) |
Colony-PCR Conditions CP.W20.B
New picked olonies 2x 95 well plate
| Template | 95x 1 µl of colony |
| Expected length [bp] | 663 |
| Named | I 1A - I 12H , II 1A - II 12H |
| Primer fw 10 µM | 105x 2 µl VF2 |
| Primer rev 10 µM | 105x 2 µl DN07 |
| iTaq Polymerase (2x) | 105x 10 µl |
| ddH2O | 105x 5 µl |
| Cycles | Temperature DelH [°C] | Time [s] |
|---|---|---|
| 1 | 95 | 120 |
| 12 | 95 | 30 |
| 68 (touchdown -0.5°C) | 30 | |
| 72 | 45 | |
| 18 | 95 | 30 |
| 65 | 30 | |
| 72 | 45 | |
| 1 | 12 | inf |
Result
Expected band: 663 bp
Colonies collected in table below show a definit result.
- => Add medium and perform a mediprep the next day for send in for sequencing:
| Colony of plate I | Colony of plate II |
|---|---|
| 1F | 2D |
| 1G | 2C |
| 2A | 3G |
| 2H | 4A |
| 3B | 4E |
| 4C | 7C |
| 4E | 7G |
| 4F | 8B |
| 4H | 10E |
| 5E | 10H |
| 5F | 11A |
| 5G | |
| (5H) | |
| 6B | |
| 6C | |
| 6D | |
| 7H | |
| 8B | |
| 8D | |
| 8F | |
| 8G | |
| 9B | |
| 9C | |
| 9F | |
| 10B | |
| 10C | |
| 10G | |
| 11F | |
| 12G |
- => The next step is a test restriction digest with PvuI
Test Restriction Digest
We performed a test digest with PvuI-HF of the screened samples which showed a postive band at 663 bp in the screening PCR. Therefore we prepared a Master Mix with:
| Enzyme | CutSmartBuffer [µl] | ddH2O [µl] | Total amount [µl] |
|---|---|---|---|
| 45x 0.5 µl = 22.5 µl | 45x 2 µl = 90 µl | 45x 16.5 µl = 742.5 µl | 45x 19 µl = 855 µl |
- Incubation time: 1:20 h at 37 °C
Result
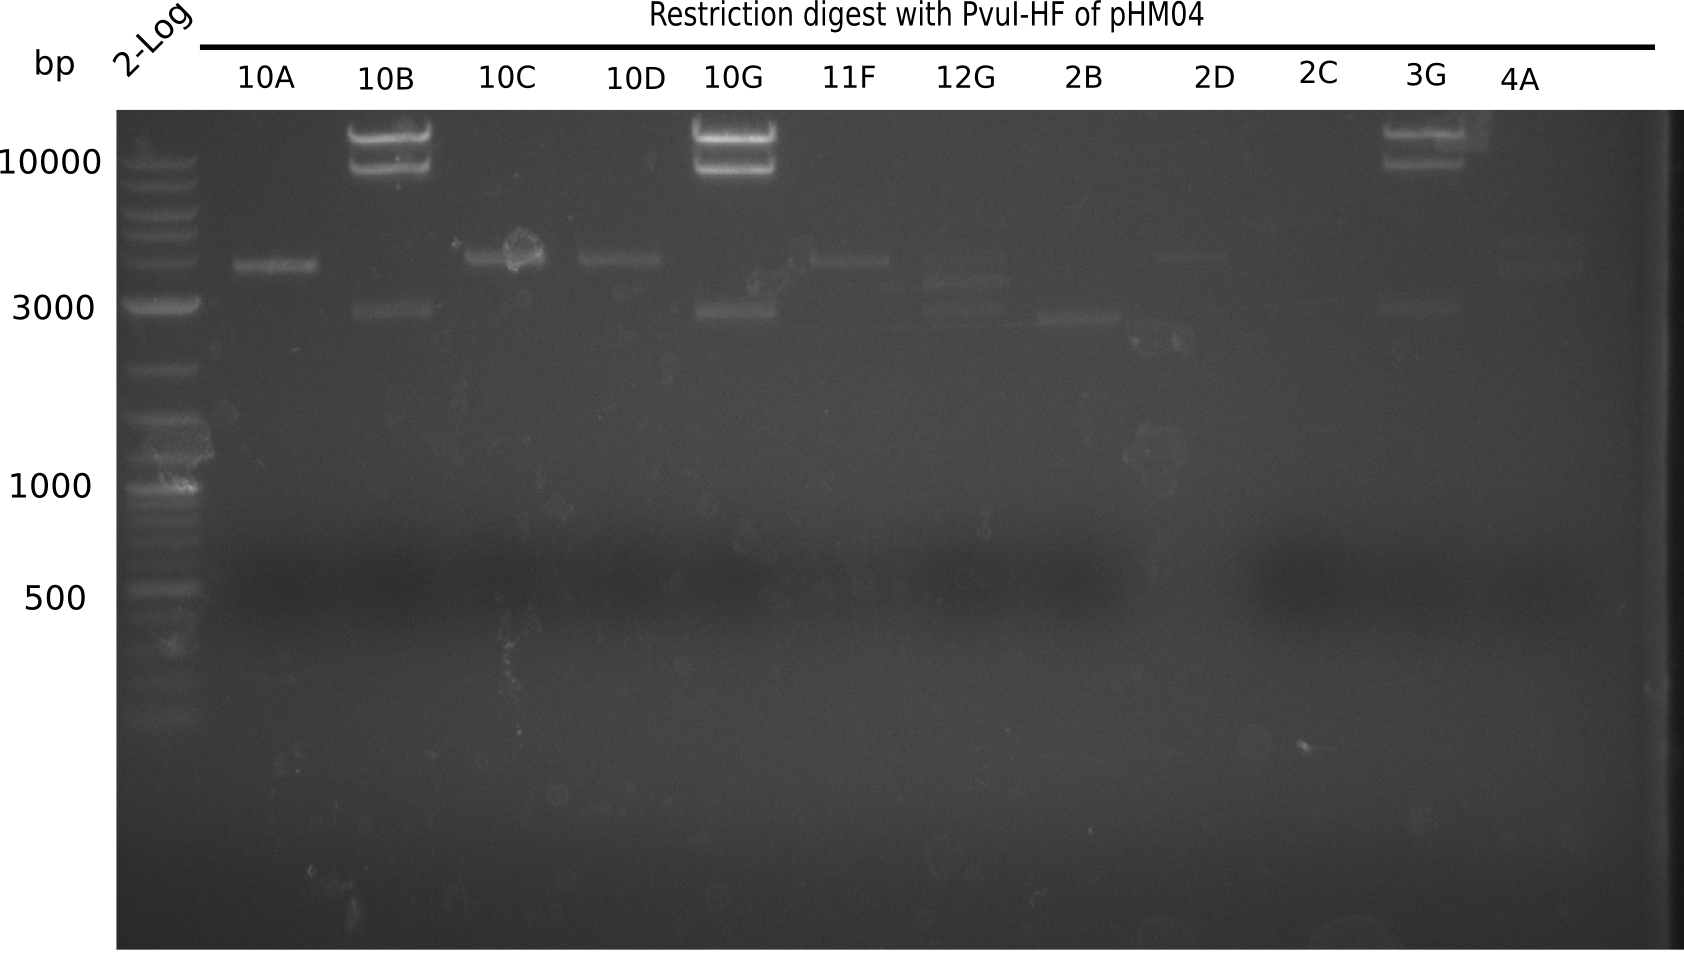
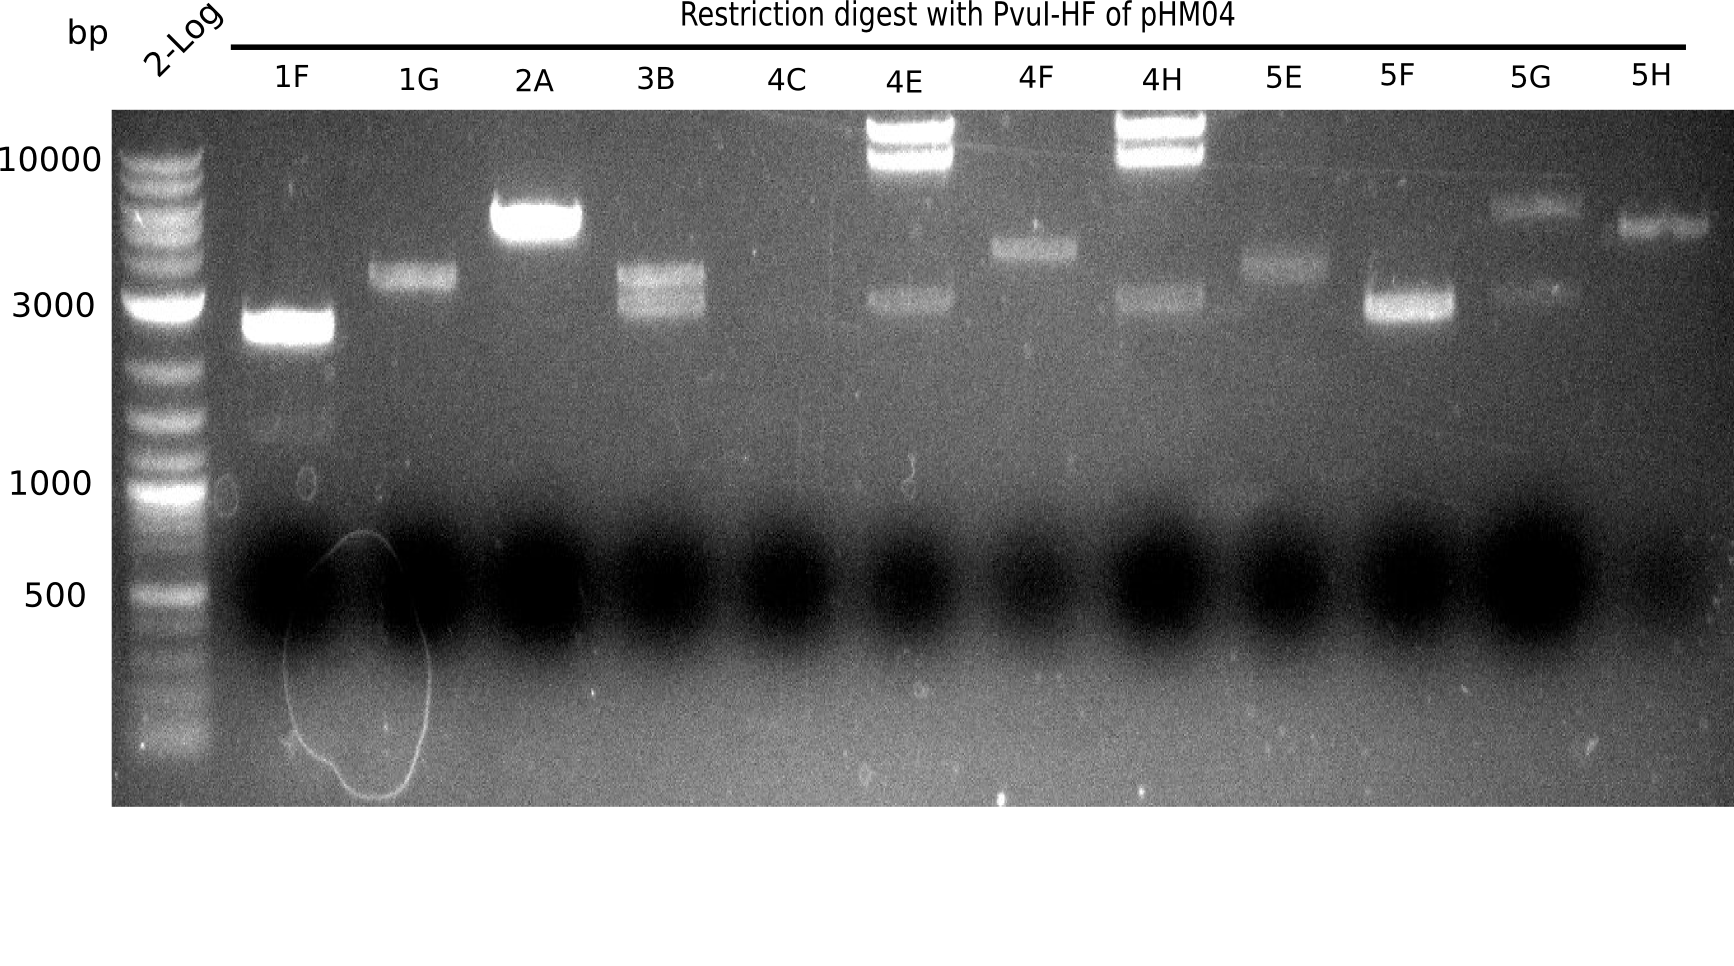
Expected bands: 11.5 Kb, 8.5 Kb and 2.6 Kb.
Some colonies showed the expected bands (see table below).
- => These are sent in for sequencing after a miniprep.
The table below shows the result of the restriction digest of different colonies containing the pHM04 plasmid. The restriction digest was positive if the expected bands were pesent.
| Colony of plate I | Show expected bands | Colony of plate II | Show expected bands |
|---|---|---|---|
| 1F | - | 2D | - |
| 1G | - | 2C | - |
| 2A | - | 3G | + |
| 2H | - | 4A | - |
| 3B | - | 4E | + |
| 4C | - | 7C | - |
| 4E | + | 7G | + |
| 4F | - | 8B | + |
| 4H | + | 10E | - |
| 5E | - | 10H | - |
| 5F | - | 11A | - |
| 5G | - | - | - |
| (5H) | - | - | - |
| 6B | + | - | - |
| 6C | + | - | - |
| 6D | + | - | - |
| 7H | + | - | - |
| 8B | - | - | - |
| 8D | - | - | - |
| 8F | - | - | - |
| 8G | + | - | - |
| 9B | - | - | - |
| 9C | - | - | - |
| 9F | - | - | - |
| 10B | + | - | - |
| 10C | - | - | - |
| 10G | + | - | - |
| 11F | + | - | - |
| 12G | - | - | - |
| Colony | Concentration ng/µl |
|---|---|
| I 4E | 1597 |
| I 4H | 495 |
| I 6B | 255 |
| I 6C | 2445 |
| I 6D | 2101 |
| I 7H | 1539 |
| I 8G | 1589 |
| I 10B | 1359 |
| I 10G | 1863 |
| I 11F | 1886 |
| II 3G | 564 |
| II 4E | 2107 |
| II 7G | 1913 |
| II 8B | 955 |
Sequencing
| Colony of plate I | Concentration ng/µl | Amount for sequencing [µl] | ddH2O [µl] | Primer (DN07 [10 µM]) added [µl] |
|---|---|---|---|---|
| I 4E | 1597 | 1 | 14 | 2 |
| I 4H | 495 | 1.5 | 13.5 | 2 |
| I 6B | 255 | 5 | 10 | 2 |
| I 6C | 2445 | 0.5 | 14.5 | 2 |
| I 6D | 2101 | 0.5 | 14.5 | 2 |
| I 7H | 1539 | 1 | 14 | 2 |
| I 8G | 1589 | 1 | 14 | 2 |
Result
| Colony | Sequencing | Notes | Alignment File |
|---|---|---|---|
| I 4E | - | (Deletion of G in coding sequence) | File:Heidelberg Sequencing Result pHM04 DN07 colony I4E.clustal.txt |
| I 4H | - | (Deletion of G in coding sequence) | File:Heidelberg Sequencing Result pHM04 DN07 colony I4H.clustal.txt |
| I 6B | + ? | a deletion in the RBS | File:Heidelberg Sequencing Result pHM04 DN07 colony I6B.clustal.txt File:Heidelberg Sequencing Result pHM04 VF2 colony 6B VF2 VF 2.clustal.txt |
| I 6C | - | (9 deletion) | File:Heidelberg Sequencing Result pHM04 DN07 colony I6C.clustal.txt |
| I 6D | - | Deletion | File:Heidelberg Sequencing Result pHM04 DN07 colony I6D.clustal.txt |
| I 7H | - | Deletion | File:Heidelberg Sequencing Result pHM04 DN07 colony I7H.clustal.txt |
| I 8G | - | Deletion | File:Heidelberg Sequencing Result pHM04 DN07 colony I8G.clustal.txt |
| I 8B | - | Deletion of G in coding sequence | discarded |
| I 10B | - | Deletion of G in coding sequence | discarded |
| I 10G | - | Insertion of G in coding sequence | discarded |
| I 11F | - | Deletion of G in coding sequence | discarded |
| II 3G | - | G Deletion of the ATG (start-codon) and 3 bp later deletion of C | discarded |
| II 4E | - | Deletion of G in coding sequence | discarded |
| II 7G | - | G Deletion of the ATG (start-codon) and 3 bp later deletion of C | discarded |
Because the colony 6B is possibly positive, the next steps are:
- 1. SDS-PAGE
- 2. Sequencing over gibson-assembled parts
- 3. Triple electroporation with the plasmig of Del-rest and MalonylCoA (see lab book Delftibactin)
Amplification of Backbone pSB6A1
PCR Conditions BB.W20.A
| Reagent | BB pSB6A1 | BB pSB6A1 |
|---|---|---|
| Expected length [Kb] | 4.4 | 4.4 |
| Template | 0.5 µl pSB6A1 30-8 | 0.5 µl pSB6A1 30-8 |
| Primer 10 µM fw | 2 µl HM_17 | 2 µl HM_17 |
| Primer 10 µM rev | 2 µl FS_77 | 2 µl FS_77 |
| Phusion Flash Master Mix (2x) | 10 µl | 10 µl |
| DMSO | 1 µl | 1 µl |
| ddH2O | 4.5 µl | 4.5 µl |
| Cycles | Temperature [°C] | Time [s] |
|---|---|---|
| 1 | 98 | 10 |
| 12 | 98 | 1 |
| 68↓ | 5 | |
| 72 | 3:00 min | |
| 18 | 98 | 1 |
| 66 | 5 | |
| 72 | 3:00 min | |
| 1 | 72 | 5:00 min |
| 1 | 4 | inf |
| Cycles | Temperature [°C] | Time [s] |
|---|---|---|
| 1 | 98 | 10 |
| 30 | 98 | 1 |
| 72 | 3:00 min | |
| 1 | 72 | 5:00 min |
| 1 | 4 | inf |
Result
Expected band: 4.4 Kb
Very weak amplification, Primer-Dimers/Oligomers, carry over of Backbone pSB6A1 (including mRFP and therefore creating a double band, since template is 700bp longer than expected PCR product).
- => Repeat PCR with less stringent conditions to increase yield until unexpected bands appear or yield is high enough and reduce amount of template DNA (use 0.5 µL of a 1:10 delution)
- =>Furthermore, elongation time was reduced, as template is only about 4.4 Kb long instead of the putative 7 Kb.
PCR Conditions BB.W20.B
| Reagent | BB pSB6A1 | BB pSB6A1 |
|---|---|---|
| Expected length [Kb] | 4.4 | 4.4 |
| Template | 0.5 µl pSB6A1 (3 ng/µL) | 0.5 µl pSB6A1 (3 ng/µL) |
| Primer 10 µM fw | 2 µl HM_17 | 2 µl HM_17 |
| Primer 10 µM rev | 2 µl FS_77 | 2 µl FS_77 |
| Phusion Flash Master Mix (2x) | 10 µl | 10 µl |
| DMSO | 1 µl | 1 µl |
| ddH2O | 4.5 µl | 4.5 µl |
| Cycles | Temperature [°C] | Time [s] |
|---|---|---|
| 1 | 98 | 10 |
| 12 | 98 | 1 |
| 66↓ | 5 | |
| 72 | 80 | |
| 18 | 98 | 1 |
| 64 | 5 | |
| 72 | 80 | |
| 1 | 72 | 5:00 min |
| 1 | 4 | inf |
| Cycles | Temperature [°C] | Time [s] |
|---|---|---|
| 1 | 98 | 10 |
| 30 | 98 | 1 |
| 58 | 5 | |
| 72 | 80 | |
| 1 | 72 | 5:00 min |
| 1 | 4 | inf |
Result
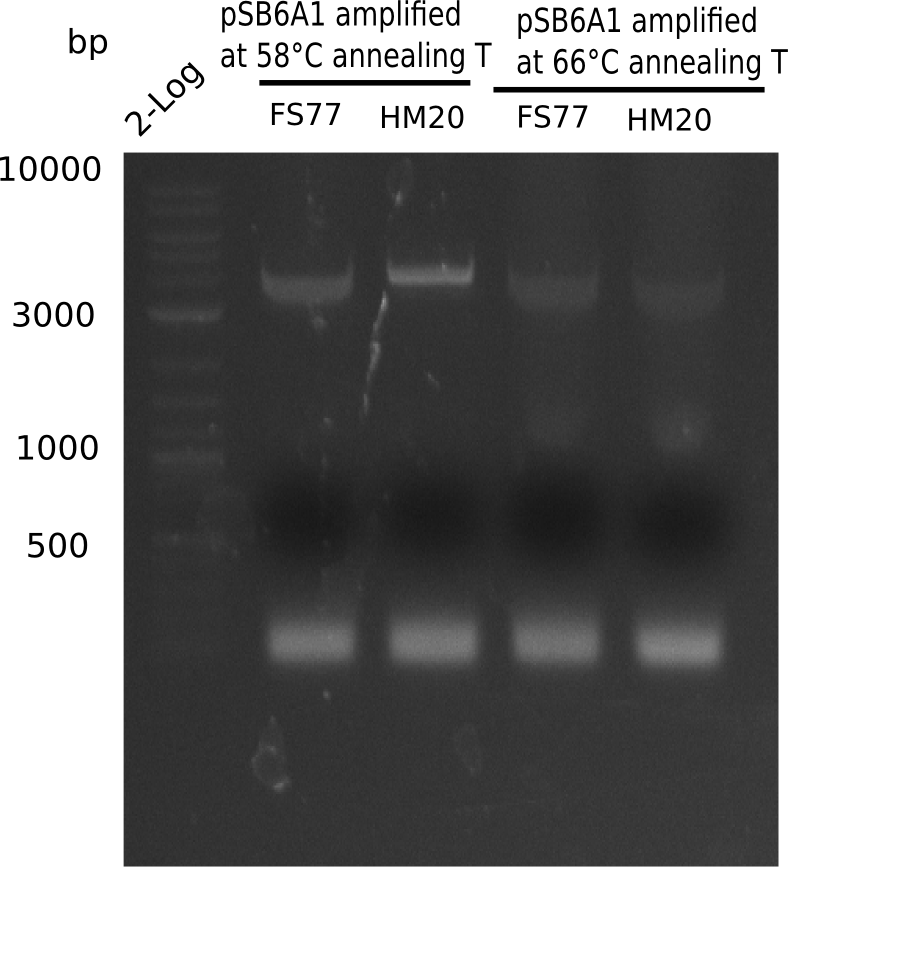
Expected band: 4.4 Kb

l1:2 log ladder,l2:BB amplified HM17 and HM20 (66°C),l3:BB amplified HM17 and FS77 (66°C),l4:BB amplified HM17 and HM20 (58°C), l5:BB amplified HM17 and FS77 (58°C) - l4-5 show the expected band at 4.4 KB
Gel shows best amplification of fragment using annealing temperature at 58°C.
- => Repetition of PCR at a constant annealing temperature of 58°C.
PCR Conditions BB.W20.C
Performed 6x PCR with FS77 & 6x PCR with HM20, so we have enough yield for the Gibson assembly.
| Reagent | BB pSB6A1 | BB pSB6A1 |
|---|---|---|
| Expected length [Kb] | 4.4 | 4.4 |
| Template | 0.5 µl pSB6A1 (3 ng/µL) | 0.5 µl pSB6A1 (3 ng/µL) |
| Primer 10 µM fw | 2 µl HM_17 | 2 µl HM_17 |
| Primer 10 µM rev | 2 µl FS_77 | 2 µl FS_77 |
| Phusion Flash Master Mix (2x) | 10 µl | 10 µl |
| DMSO | 1 µl | 1 µl |
| ddH2O | 4.5 µl | 4.5 µl |
| Cycles | Temperature [°C] | Time [s] |
|---|---|---|
| 1 | 98 | 10 |
| 30 | 98 | 1 |
| 58 | 5 | |
| 72 | 80 | |
| 1 | 72 | 5:00 min |
| 1 | 4 | inf |
Result
Expected band: 4.4 Kb
Gel does not show the expected bands.
- => What happened? Why is it not reproducible? Run a PCR with other conditions.
PCR Conditions BB.W20.D
| Reagent | BB pSB6A1 | BB pSB6A1 |
|---|---|---|
| Expected length [Kb] | 4.4 | 4.4 |
| Template | 1 µl pSB6A1 (3 ng/µL) | 1 µl pSB6A1 (3 ng/µL) |
| Primer 10 µM fw | 2 µl HM_17 | 2 µl HM_17 |
| Primer 10 µM rev | 2 µl FS_77 | 2 µl FS_77 |
| Phusion Flash Master Mix (2x) | 10 µl | 10 µl |
| ddH2O | 5.0 µl | 5.0 µl |
| Cycles | Temperature [°C] | Time [s] |
|---|---|---|
| 1 | 98 | 10 |
| 12 | 98 | 1 |
| 60↓ | 5 | |
| 72 | 80 | |
| 18 | 98 | 1 |
| 68 | 5 | |
| 72 | 80 | |
| 1 | 72 | 5:00 min |
| 1 | 4 | inf |
Result
Expected band: 4.4. Kb
Gel shows again no amplification of backbone.
- => Further optimize PCR conditions.
PCR Conditions BB.W20.E
| Reagent | BB pSB6A1 | BB pSB6A1 |
|---|---|---|
| Expected length [Kb] | 4.4 | 4.4 |
| Template | 0.5 µl pSB6A1 (3 ng/µL) | 0.5 µl pSB6A1 (3 ng/µL) |
| Primer 10 µM fw | 1 µl HM_17 | 1 µl HM_17 |
| Primer 10 µM rev | 1 µl FS_77 | 1 µl FS_77 |
| Phusion Flash Master Mix (2x) | 10 µl | 10 µl |
| DMSO | 1 | 1 |
| ddH2O | 6.5 µl | 6.5 µl |
| Cycles | Temperature [°C] | Time [s] |
|---|---|---|
| 1 | 98 | 10 |
| 30 | 98 | 1 |
| 58 | 5 | |
| 72 | 80 | |
| 1 | 72 | 5:00 min |
| 1 | 4 | inf |
| Cycles | Temperature [°C] | Time [s] |
|---|---|---|
| 1 | 98 | 10 |
| 12 | 98 | 1 |
| 66↓ | 5 | |
| 72 | 1:20 min | |
| 18 | 98 | 1 |
| 64 | 5 | |
| 72 | 80 | |
| 1 | 72 | 5:00 min |
| 1 | 4 | inf |
Result
Expected band: 4.4 Kb
Gel shows amplification using new HM17.
- => Fragments were cut and gel extracted.
PCR Conditions BB.W20.F
Run 6x PCR with HM20 and 6x PCR with FS77 for higher yield
| Reagent | BB pSB6A1 | BB pSB6A1 |
|---|---|---|
| Expected length [Kb] | 4.4 | 4.4 |
| Template | 0.5 µl pSB6A1 (3 ng/µL) | 0.5 µl pSB6A1 (3 ng/µL) |
| Primer 10 µM fw | 1 µl HM_17 | 1 µl HM_17 |
| Primer 10 µM rev | 1 µl FS_77 | 1 µl FS_77 |
| Phusion Master Mix (2x) | 10 µl | 10 µl |
| DMSO | 1 | 1 |
| ddH2O | 6.5 µl | 6.5 µl |
| Cycles | Temperature [°C] | Time |
|---|---|---|
| 1 | 98 | 10 |
| 30 | 98 | 1 |
| 58 | 5 | |
| 72 | 80 | |
| 1 | 72 | 5:00 min |
| 1 | 4 | inf |
The PCR was direcly digested with DpnI afterwards.
Restriction Digest with DpnI
- 10 of the 12 PCRs (5x FS & 5x HM) were cut with DpnI. There we used the exact PCR product as generated earlier.
- Incubated at 37°C ON
- The following table presents the amount for all reactions
| Sample | Buffer | Enzyme | ddH2O |
|---|---|---|---|
| 10x 20 µl PCR | 10x 2.5 µl CutSmart Buffer | 2.5 µl DpnI | 23 µl |
Afterwards, a 0.8% gel was run for 1 h at 100 V and a gel-purification was performed with the Qiagen Gel Extraction Kit
Result
Expected band: 4.4 Kb
Gel shows expected bands.
- => Fragments were gel extracted.
| Sample | DpnI digested | Concentration [ng/µl] |
|---|---|---|
| BB 16 (amplified with FS77) | yes | 6.2 |
| BB 16 (amplified with HM20) | yes | 6.6 |
Generation of DelH Plasmid pHM04 15-09
Gibson Assembly
| Fragment | Concentration [ng/µl] | Amount with BB16 (FS77) [µl] | Amount with BB16 (HM20) [µl] |
|---|---|---|---|
| DN11-FS66 | 172.5 | 0.78 | 0.81 |
| FS67-FS68 | 120.7 | 0.95 | 0.99 |
| FS69-FS70 | 211.3 | 0.94 | 0.98 |
| FS71-HM08 | 146 | 0.55 | 0.57 |
| BB16 amplified with FS77 | 6.2 | 6.78 | - |
| BB16 amplified with HM20 | 6.6 | - | 6.64 |
- Incubate for 1h at 50°C
Electroporation
- Afterwards, 5 µl of each Gibson assembly were taken out and 10 µl ddH2O was added
- With 10 µl of the Gibson assembly, isopropanol purification was performed
- 6 different electroporations were performed (see scheme below)
| Electroporation name | Inserted amount of Gibson Assembly | Plated out on agar plates |
|---|---|---|
| HM20 1 | 1 µl (Gibson + ddH2O) | * 10 µl * rest |
| HM20 14 | 14 µl (Gibson + ddH2O) | * 10 µl * rest |
| HM20 20 | 20 µl (isopropanol purified) | * 10 µl * rest |
| FS77 1 | 1 µl (Gibson + ddH2O) | * 10 µl * rest |
| FS77 14 | 14 µl (Gibson + ddH2O) | * 10 µl * rest |
| FS77 20 | 20 µl (isopropanol purified) | * 10 µl * rest |
 "
"


