|
- Small Phage
- March-April
- May-June
- July-August
- September-October
|
1. Goals for the week
- Our two main goals for this week were to determine the mutagen concentration to use during mutagenesis, and to amplify the T7 minor capsid protein with PCR.
2.Experiments and results
5.9 T7+ Liquid Culture Phage Concentration Test #2
- We infected E. coli BL21 with different concentrations (1ul, 10ul, and 100ul) of phage to see which would yield the highest titer. Plaques formed up to -8 on all the spot tests, showing that the concentration difference had no effect on the titer. However, the plates were badly contaminated.
5.13 Determining E. coli Concentration With Spectrophotometer
- To check if we could determine E. coli concentration with a spectrophotometer, we created a 7/5 dilution series of E. coli. We then measured the absorption at 600nm of each E. coli dilution. When plotted, these measurements showed a linear relationship between E. coli concentration and the absorption reading.
-

5.15 Titer Test on 5.3 T7 new Phage Stock
- Created a 1:10 dilution series with 5.3 T7 stock. We then created titers of -5, -6, -7, and -8. -5, -6, and -7 plates all had overlapping plaques. However, the -8 plate had 7 plaques, giving us an estimated phage concentration of 7E8 particles/20ul.
5.20 Mutagen Concentration Experiment
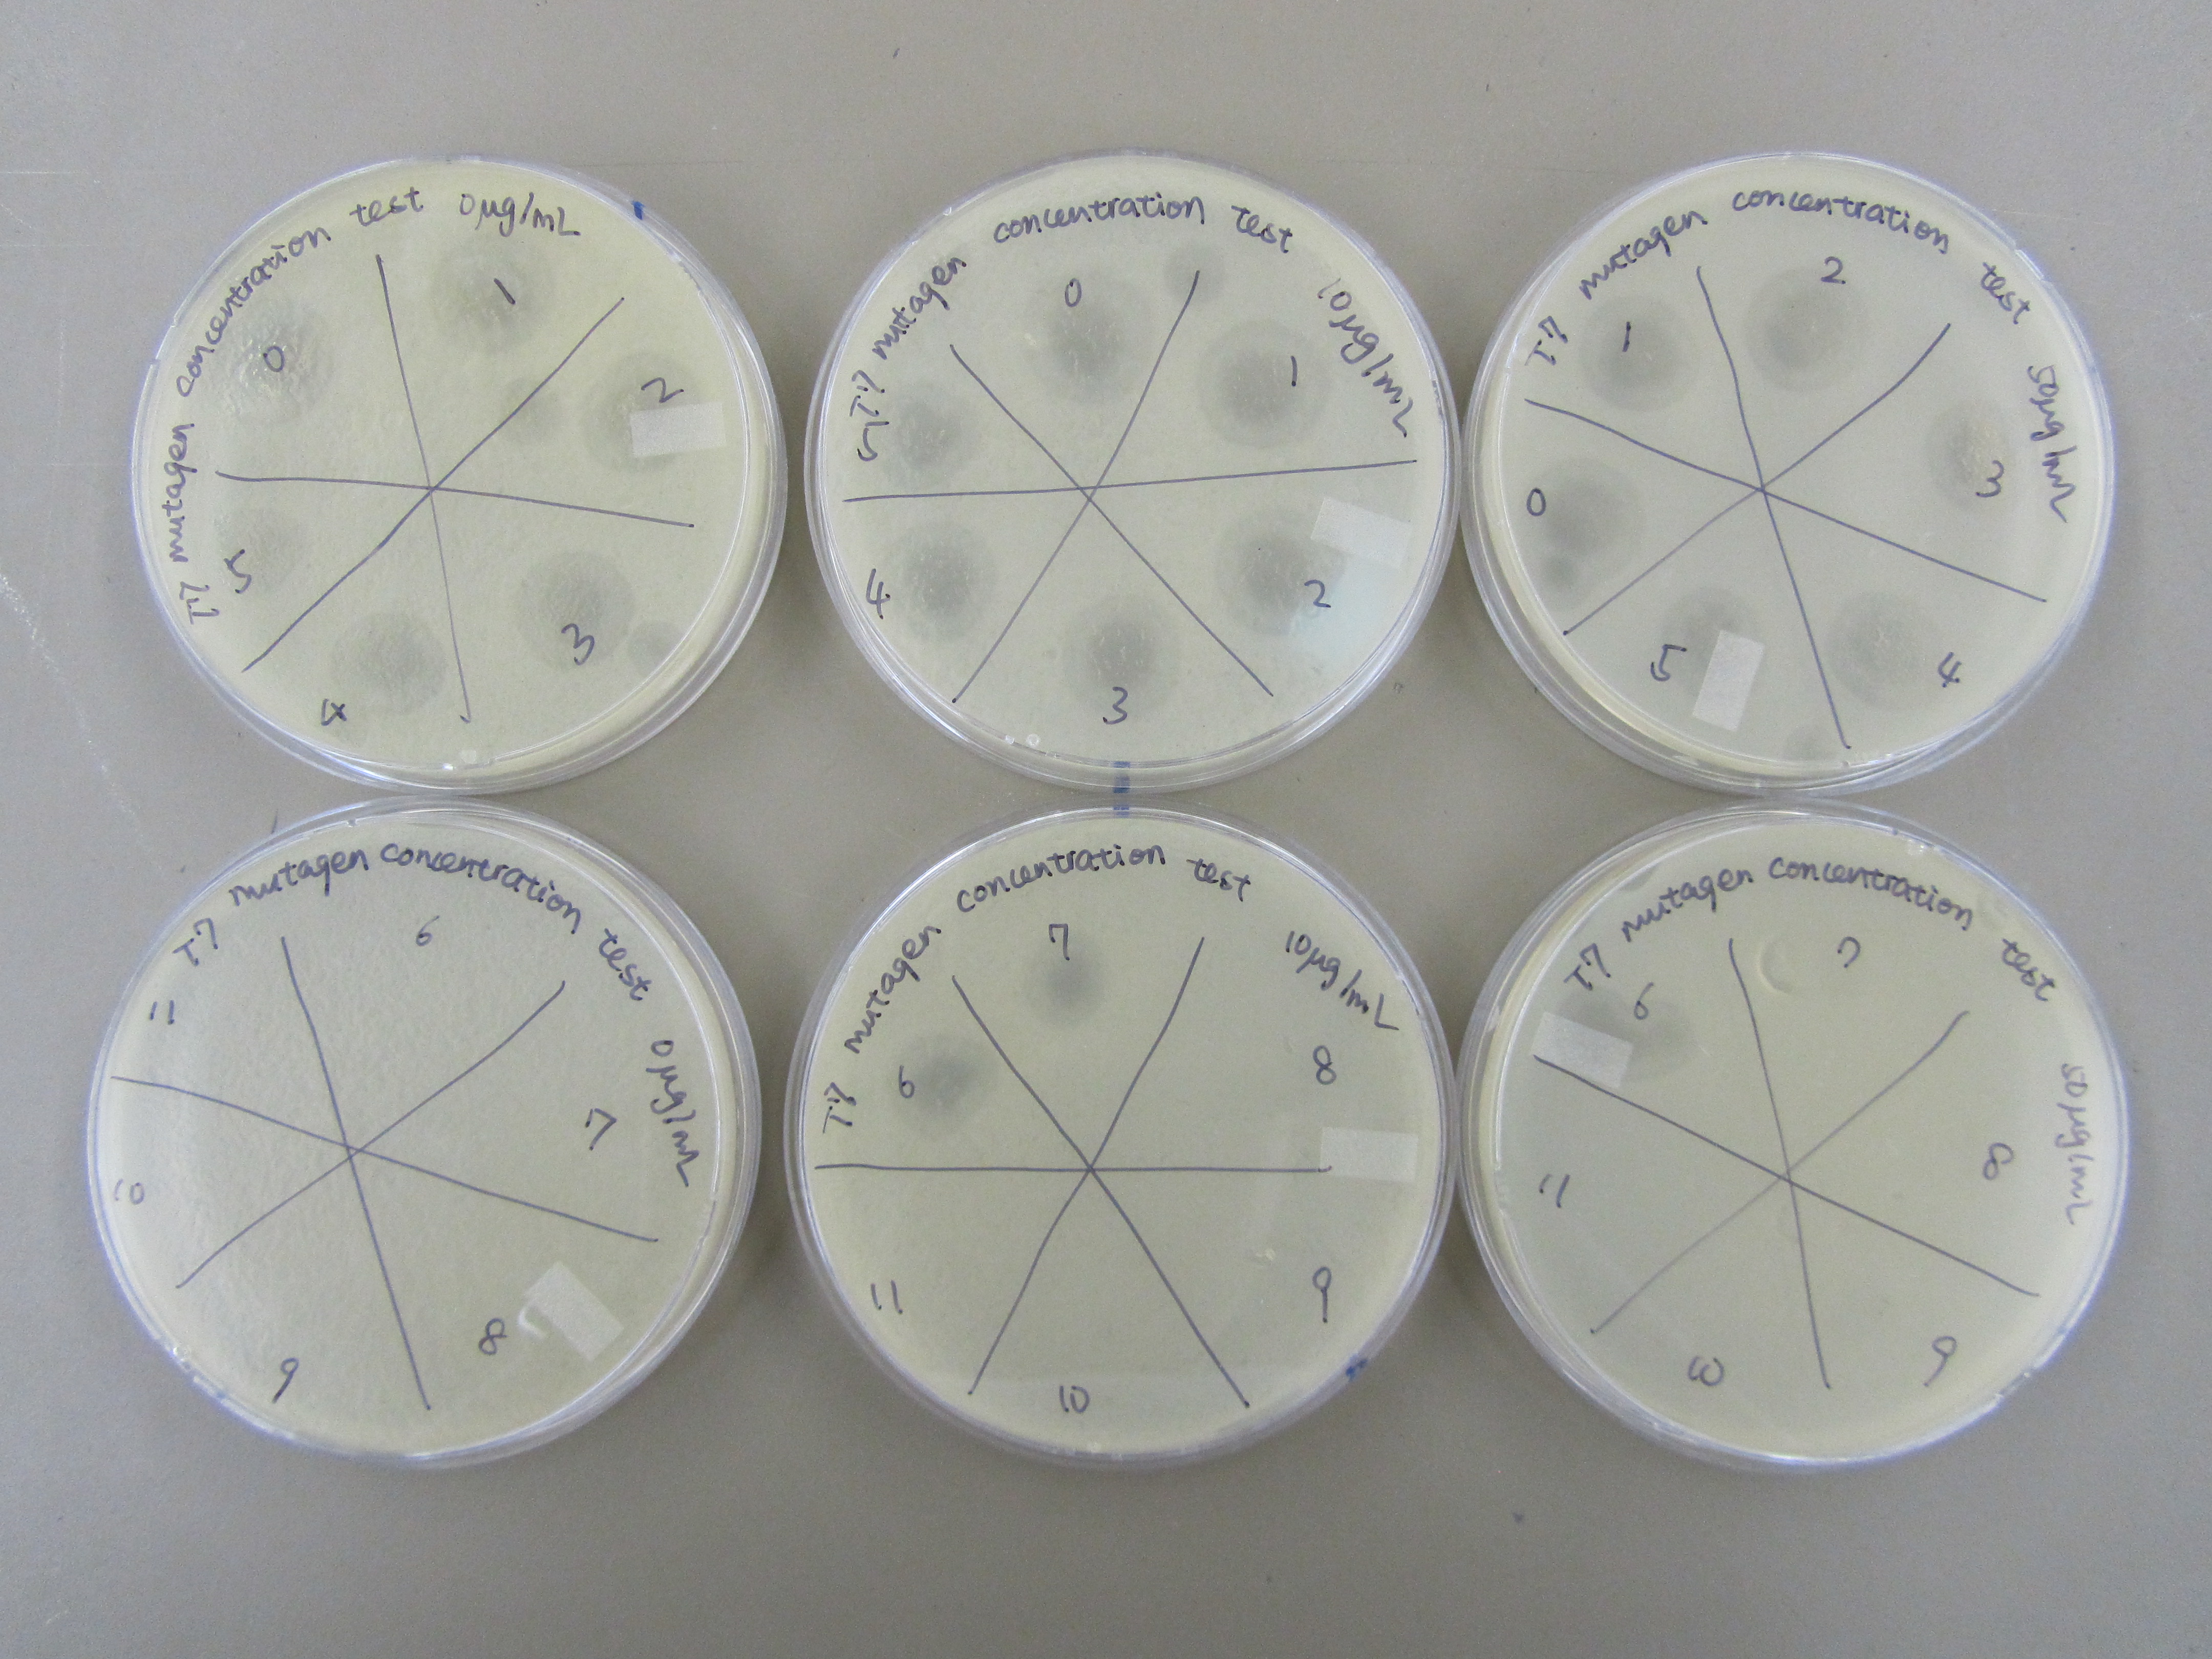
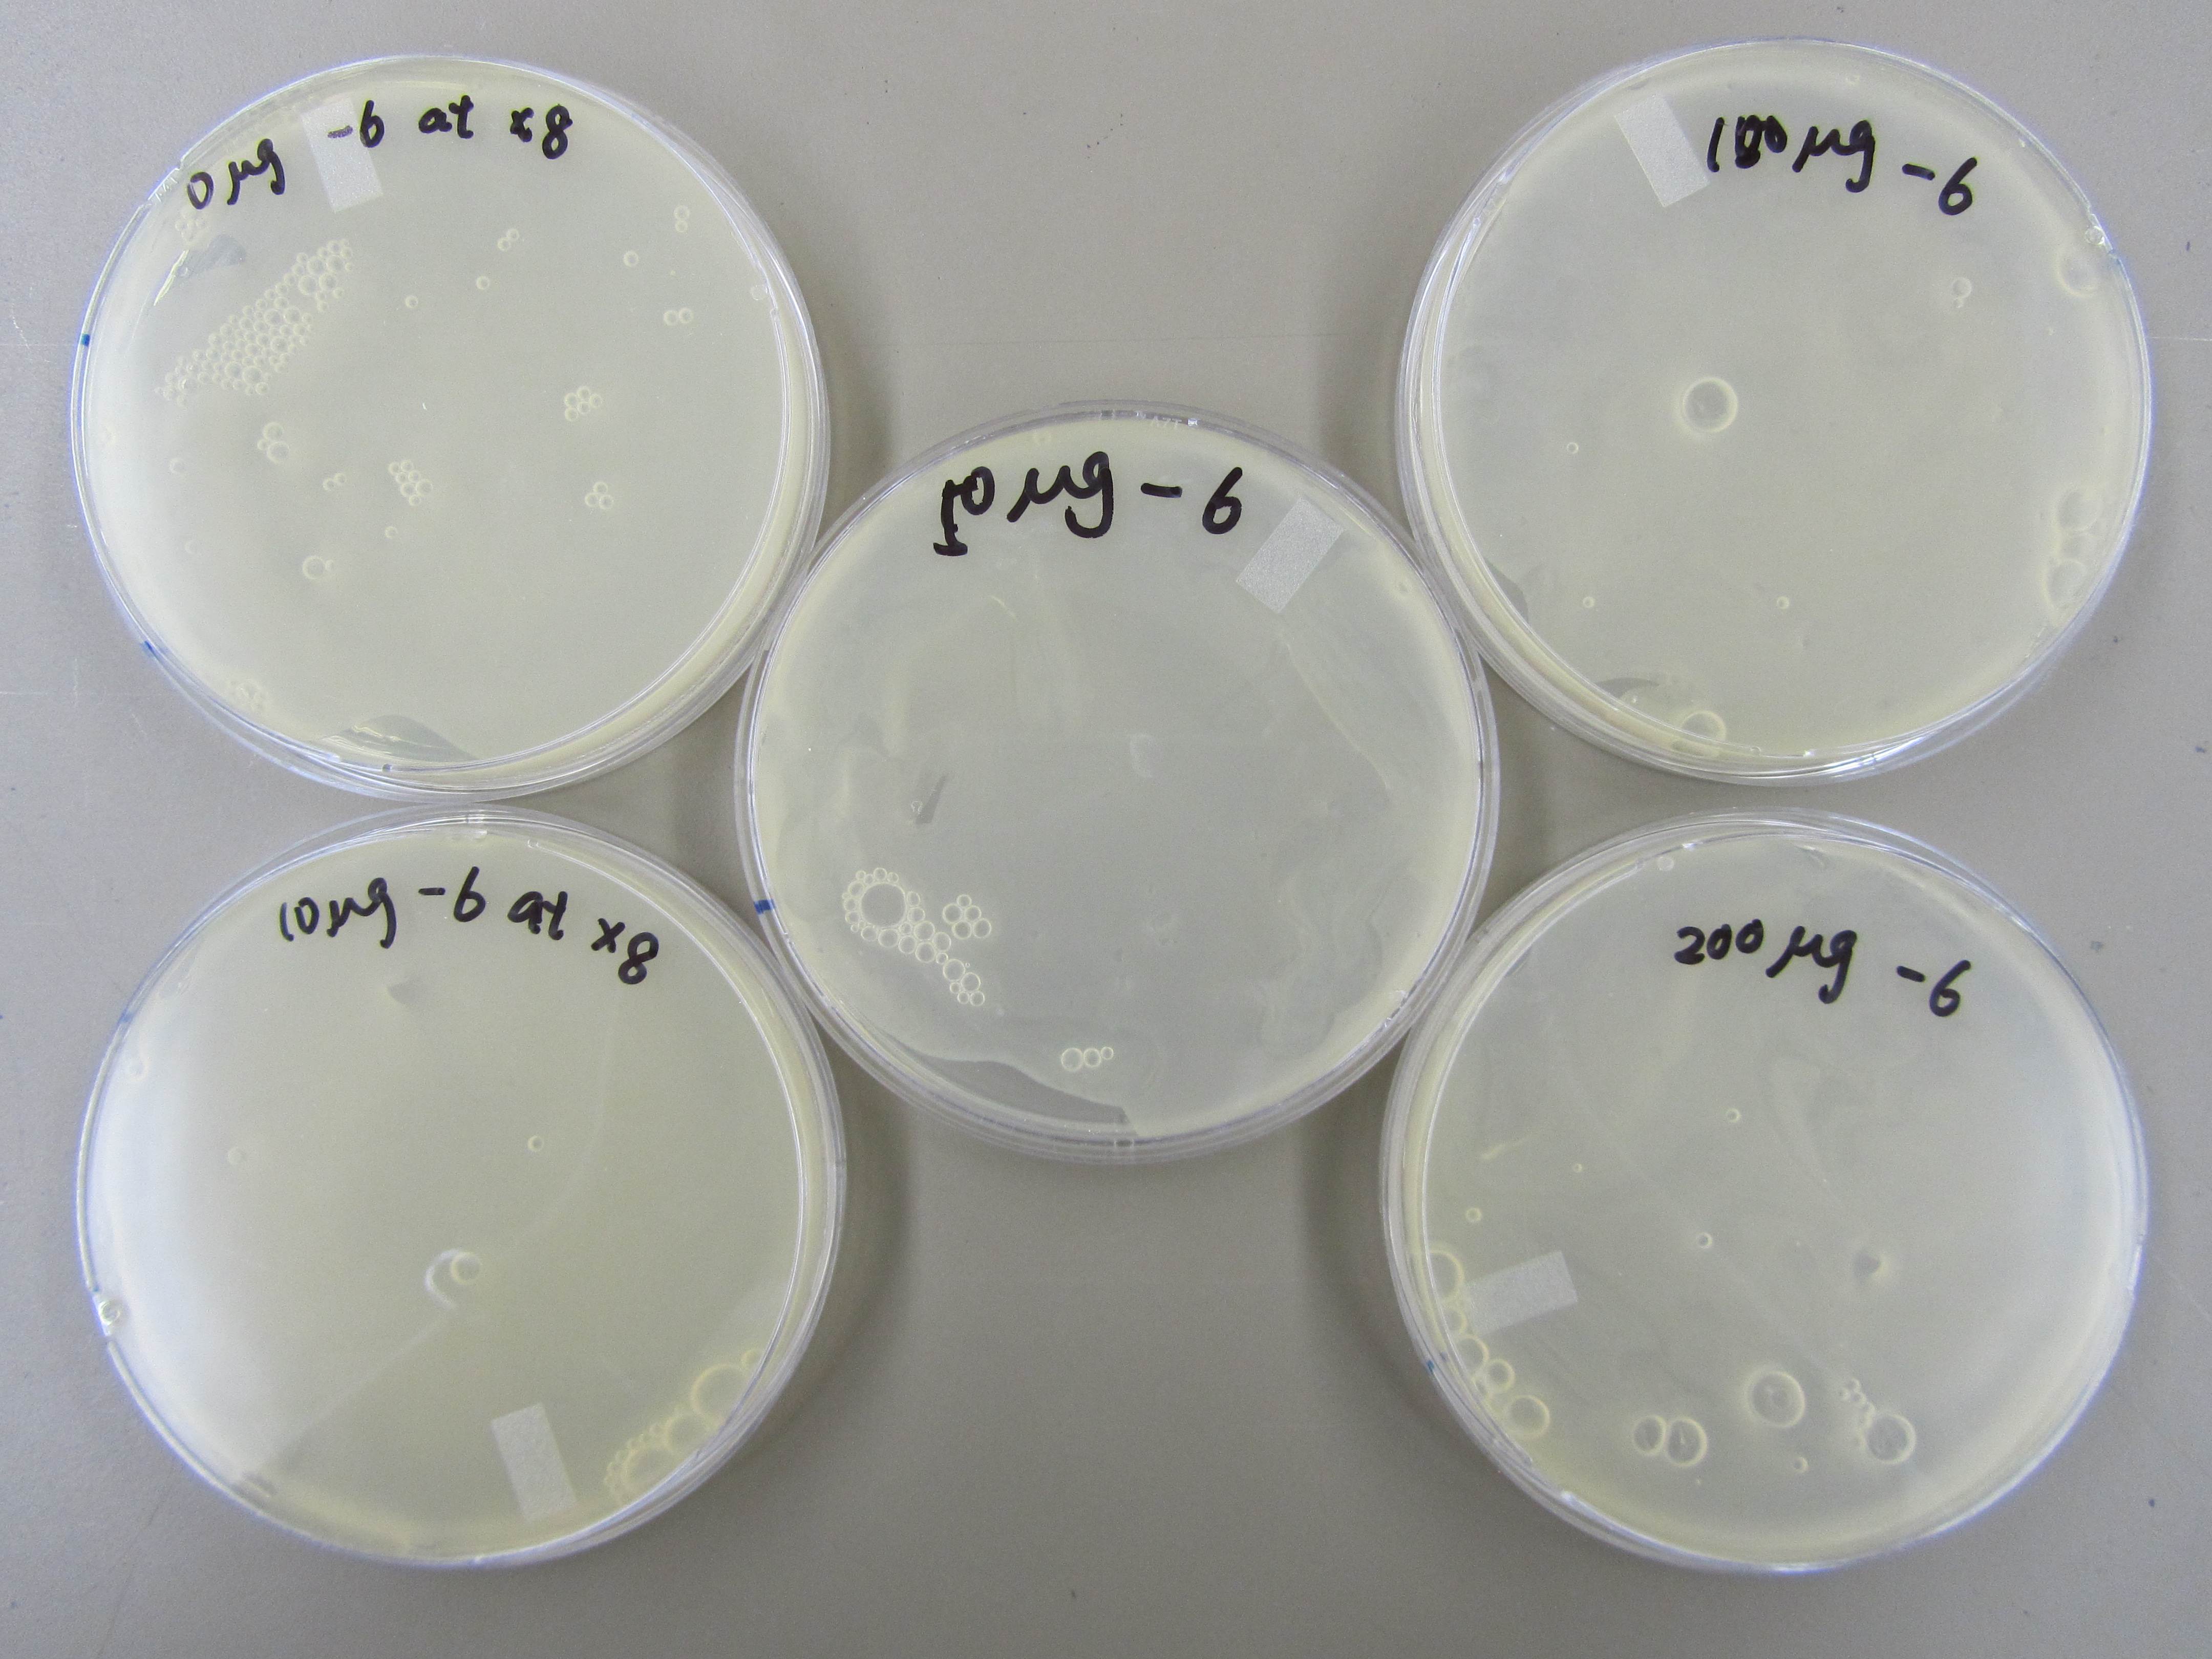
- In order to determine the best concentration of mutagen to use, we infected the E. coli in 5 tubes with 0ul, 10ul, 50ul, 100ul, and 200ul of our mutagen, 5-bromodeoxyuridine. We then added 6uL of 5.3 phage stock to each tube, allowed it to incubate for 20 minutes, and purified the phage. Next, we made a dilution series and performed a spot test and found that when the mutagen concentration is increased, the concentration of phage is decreased.
We then performed titers from -6, -7, and -8 of phage from our dilution series with x8 top agar. There are a couple plaques on each plate.
5.20 T7 Minor Capsid Protein PCR
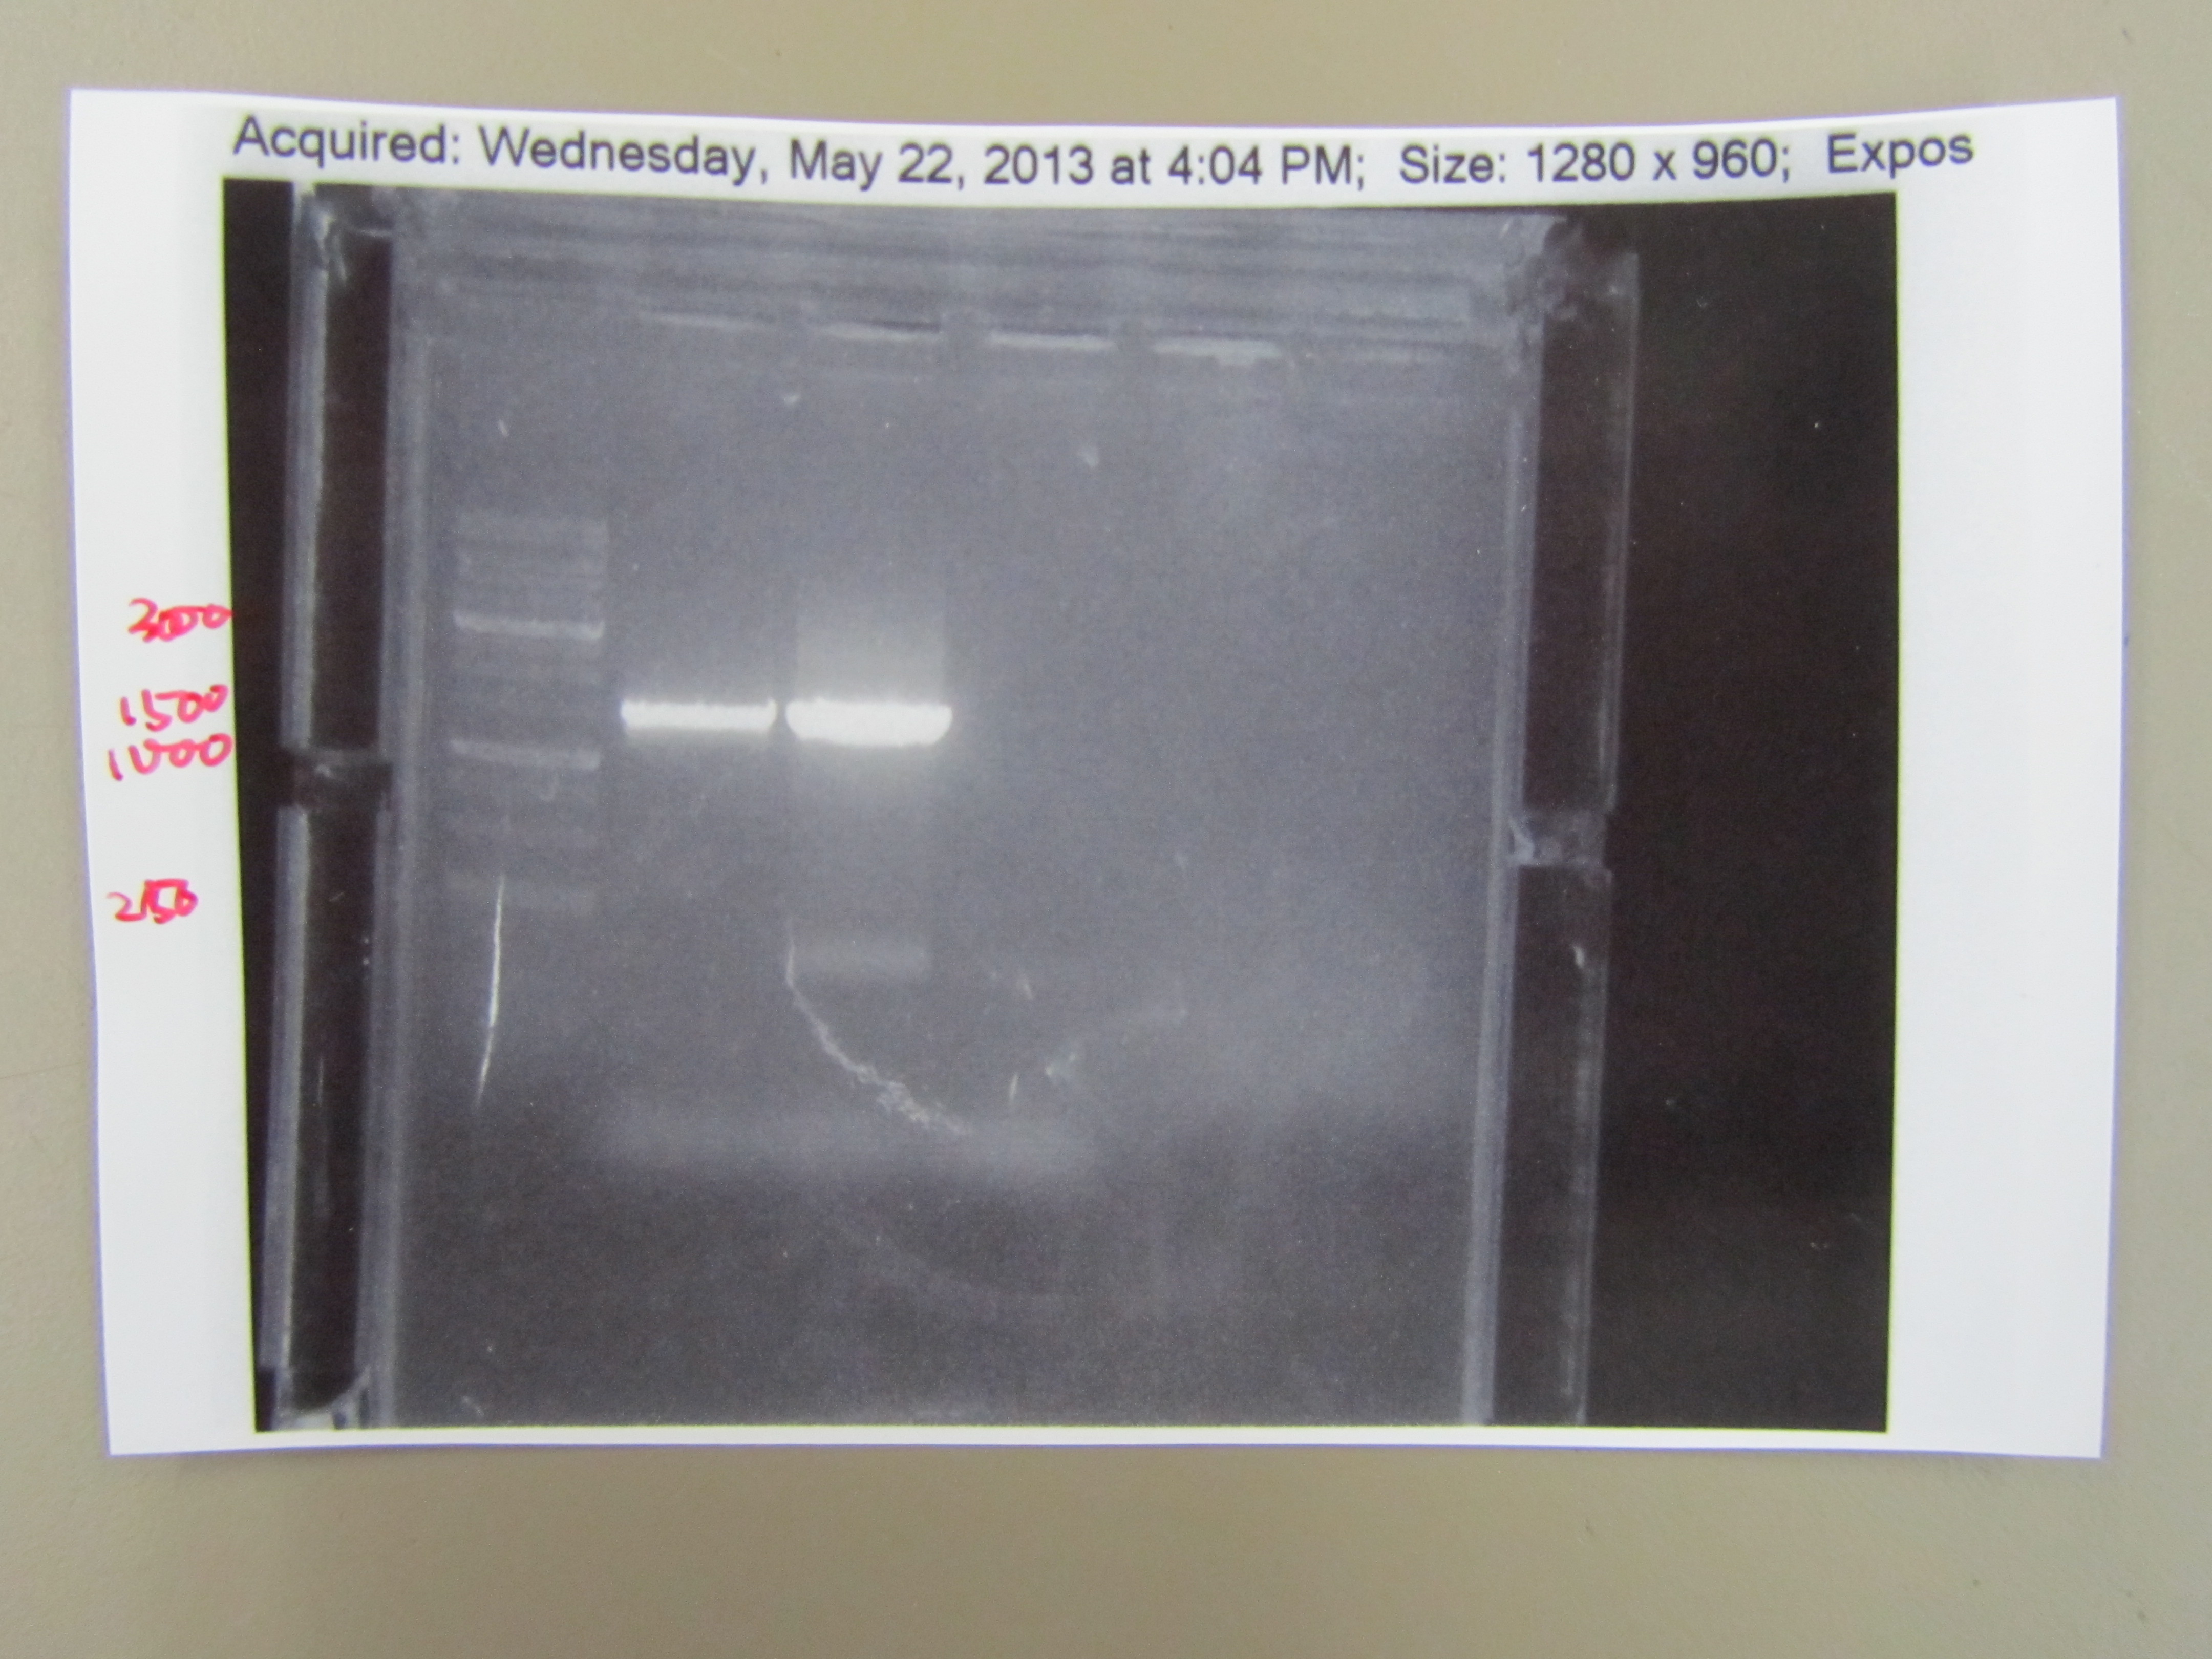
- In order to sequence the T7 minor capsid protein, we had to amplify the gene using PCR. We first isolated the DNA by boiling phage in a PCR machine and centrifuging it for a minute, leaving the T7 DNA in the supernatant. Then we added ddH20, TAQ buffer, dNTPs, the forward and reverse minor capsid protein primers, the template DNA from the supernatant, and TAQ polymerase in a PCR tube. We ran 35 cycles of PCR and then froze it. To make sure we isolated the T7 minor capsid protein, we ran it with gel electrophoresis and found a single band that corresponds with the the proper base pair length. This showed that we successfully cloned the T7 minor capsid protein gene.
3. Next Steps
- Our next steps are to 1) Sequence the minor capsid protein and 2) Start the mutagenesis process in order to select for smaller phage.
|
 "
"


