Team:Yale/Project Bioassay
From 2013.igem.org
(Difference between revisions)
(→FACS Sorting) |
|||
| Line 170: | Line 170: | ||
<li><a href='https://2013.igem.org/Team:Yale/Project_MAGE'><span>Apply Mage</span></a></li> | <li><a href='https://2013.igem.org/Team:Yale/Project_MAGE'><span>Apply Mage</span></a></li> | ||
<li><a href='https://2013.igem.org/Team:Yale/Project_Export'><span>Introduce Export System</span></a></li> | <li><a href='https://2013.igem.org/Team:Yale/Project_Export'><span>Introduce Export System</span></a></li> | ||
| - | <li class='last'><a href='https://2013.igem.org/Team:Yale/ | + | <li><a href='https://2013.igem.org/Team:Yale/Project_Bioplastic'><span>Make a Bioplastic</span></a></li> |
| + | <li class='last'><a href='https://2013.igem.org/Team:Yale/Project_Collaboration'><span>Collaboration</span></a></li> | ||
</ul> | </ul> | ||
</div> | </div> | ||
Revision as of 00:25, 27 September 2013
Contents |
Develop bioassay to screen PLA production
- We needed a way to detect the PLA once we produced it using the heterologous enzymes
- We decided to use the fluorescent dye Nile red, a intercellular lipid strain
- Nile red does not affect the growth of bacteria, and its fluorescence is quenched in water

This is a figure from Spiekermann et al. 1996 demonstrating Nile red staining of both PHB+ E. coli and PHB negative E. coli
Positive Control
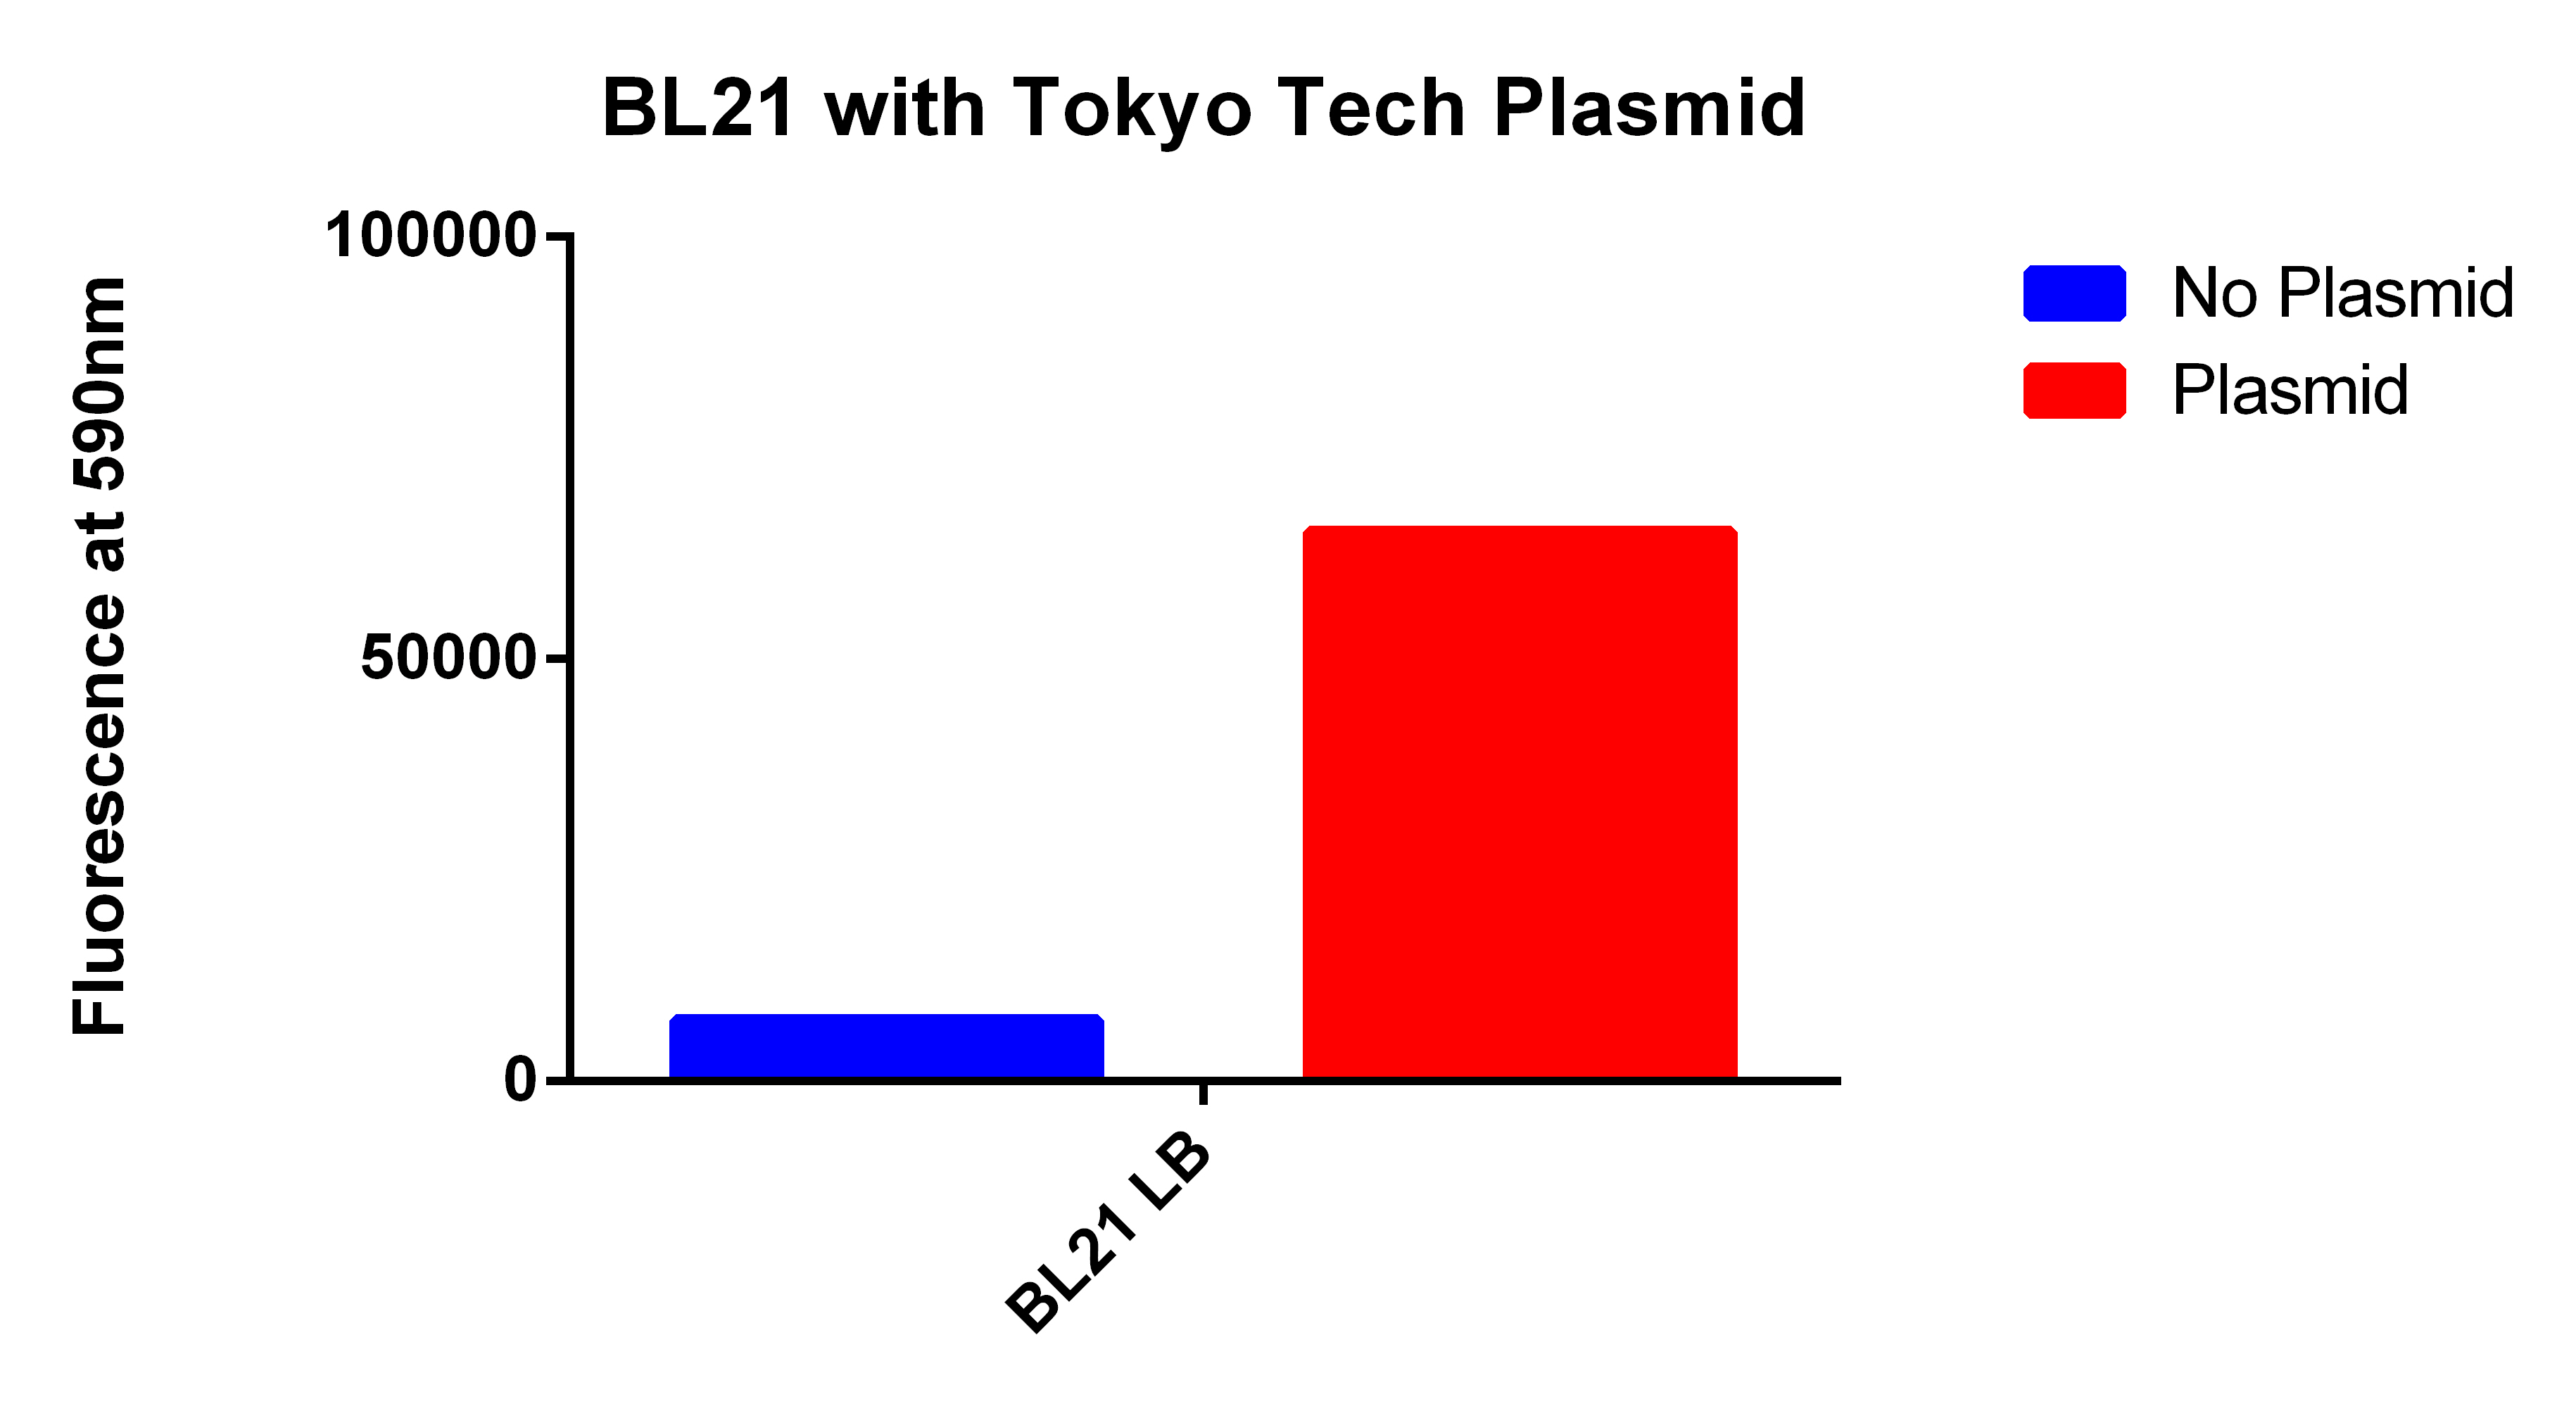
- We used the 2012 Tokyo Tech Biobrick (BBa_K934001) as a positive control to attempt to detect Nile red fluorescence on our plate reader (ex. 530nm, em. 590nm)
- This plasmid had three enzymes which together give E. coli that ability to synthesize P(3HB) a similar plastic PLA
- Cells were grown for 24 hours in the presence of Nile red. The cells were washed and resuspended in PBS.

Our Construct
- We then proceeded to test our plasmid in the plate reader.
- Cells were grown for 24 hours with both enzymes induced and in the presence of Nile red. The cells were washed and re-suspended in PBS. The readings were normalized for optical density.

FACS Sorting
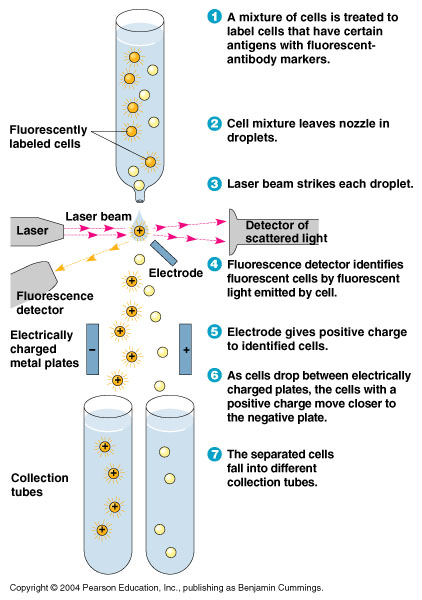
- In order to quickly screen the large diversity created using MAGE, we employed Fluorescence-activated cell sorting (FACS)
- FACS could sort cells based on the Nile red fluorescence, thus indicating those cells that have produced larger quantities of PLA

Testing for PLA
- Nile red has an emission maximum at 598nm when bound to p(3HB) granules according to Spiekermann et al. 1998
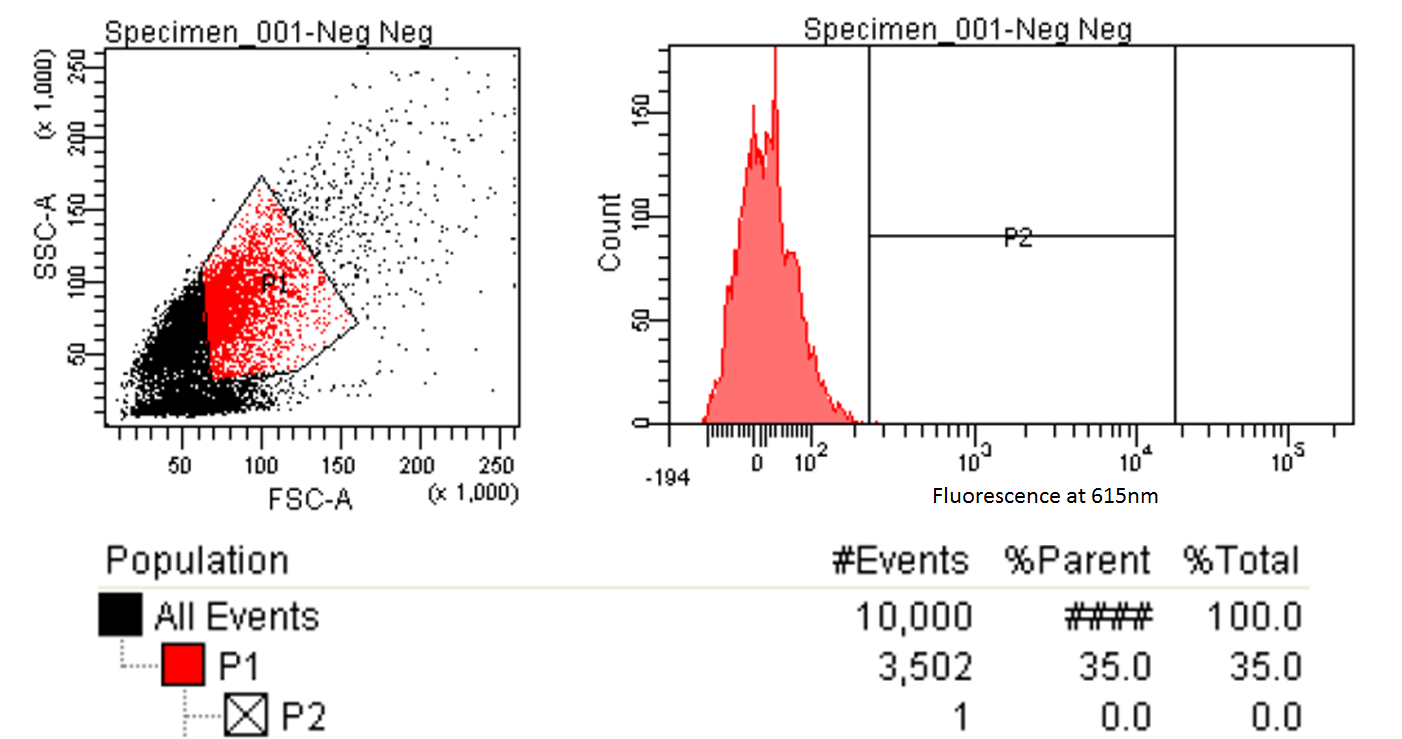
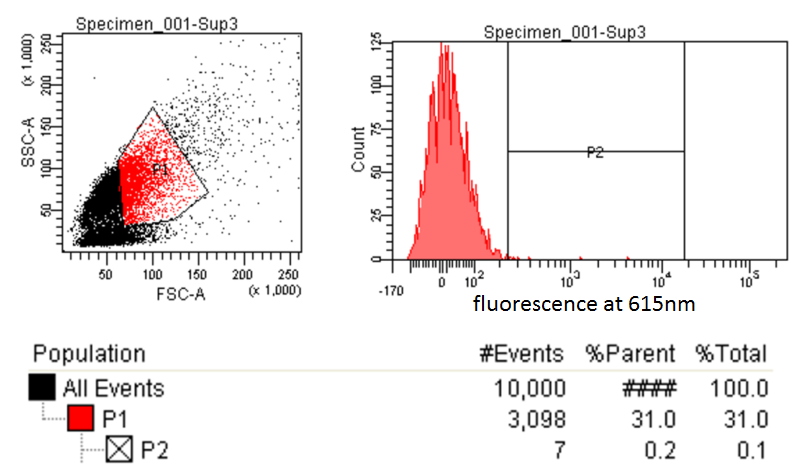
- Thus we decided to use PE-Texas Red which has an emission maximum at 615nm in order pick the best colonies.
- PE-Texas Red is a covalently linked fluorochrome used as the detector. The FACS machine measure the emission of this fluorochrome because Nile Red is not a common fluorochrome that a FACS machine would have detector specific to Nile red.
- Next we tested these FACS sorted cells on the plate reader to see if we could detect a difference from the FACS sorted and non-FACS sorted cells

- This graph demonstrates that our FACS bioassay method was successful in selecting for cells that exhibit higher levels of PLA-induced fluorescence.
 "
"


