Team:Kyoto/Humanpractice/Data
From 2013.igem.org
(→Q5 Who answered ‘partly yes’ to the fifth question, please answer this question. Which of these creatures’ gene can be modified? Please give X as many as you think it is permissible.) |
|||
| Line 105: | Line 105: | ||
===Q5 Who answered ‘partly yes’ to the fifth question, please answer this question. Which of these creatures’ gene can be modified? Please give X as many as you think it is permissible.=== | ===Q5 Who answered ‘partly yes’ to the fifth question, please answer this question. Which of these creatures’ gene can be modified? Please give X as many as you think it is permissible.=== | ||
<br> | <br> | ||
| - | + | check<br> | |
| - | + | no check<br> | |
Q5.1 Bacteria Q5.2 wheat Q5.3 honeybee Q5.4 killifish Q5.5 frog | Q5.1 Bacteria Q5.2 wheat Q5.3 honeybee Q5.4 killifish Q5.5 frog | ||
Q5.6 chickens Q5.7 mouse Q5.8 dog Q5.9 monkey Q5.10 human beings<br><br><br> | Q5.6 chickens Q5.7 mouse Q5.8 dog Q5.9 monkey Q5.10 human beings<br><br><br> | ||
| Line 112: | Line 112: | ||
[[File:Q5 religion(chi-square).jpg]]<br> | [[File:Q5 religion(chi-square).jpg]]<br> | ||
| - | Fig13.The graph shows the difference according to religion.<br> | + | Fig13.(Chiristian N=71 Buddist N=105 Irreligionist N=189)<br> |
| + | The graph shows the difference according to religion.<br> | ||
The graph of Buddhist is almost the same with that of Irreligionist, which shows that the higher the animals are, the less people who thinks their genes can be modified. | The graph of Buddhist is almost the same with that of Irreligionist, which shows that the higher the animals are, the less people who thinks their genes can be modified. | ||
From honey bee to human beings,Christian who thinks genetically modification is permitted takes up about 15%.<br> | From honey bee to human beings,Christian who thinks genetically modification is permitted takes up about 15%.<br> | ||
| - | |||
[[File:Q5 Asia vs Europe.jpg]]<br> | [[File:Q5 Asia vs Europe.jpg]]<br> | ||
| - | Fig14.A comparison between Asian and Europe.<br> | + | Fig14.(Asia N=332 Europe N=82)<br> |
| + | A comparison between Asian and Europe.<br> | ||
The graph is similar with the one which compares between religions. The graph of Asian is similar to that of Buddhist and Irreligionist, while the graph of Europe is similar to that of Christian.<br> | The graph is similar with the one which compares between religions. The graph of Asian is similar to that of Buddhist and Irreligionist, while the graph of Europe is similar to that of Christian.<br> | ||
| - | |||
[[File:Q5 Asia male vs female.jpg]]<br> | [[File:Q5 Asia male vs female.jpg]]<br> | ||
| - | Fig15.A comparison between male and females in Asia.<br> | + | Fig15.(male N=150 female N=166)<br> |
| + | A comparison between male and females in Asia.<br> | ||
This graph shows the difference between male and female from Asia. | This graph shows the difference between male and female from Asia. | ||
The number of males who allow genetically modification is larger than that of females.<br> | The number of males who allow genetically modification is larger than that of females.<br> | ||
| - | |||
[[File:Europe male vs female.jpg]]<br> | [[File:Europe male vs female.jpg]]<br> | ||
| - | Fig16.A comparison between male and female in Europe.<br> | + | Fig16.(male N=30 female N=44)<br> |
| + | A comparison between male and female in Europe.<br> | ||
The number of males who answered that genetically modification is admitted in E. coli and mice is larger than that of females. About other living things, there is no difference between male and female.<br> | The number of males who answered that genetically modification is admitted in E. coli and mice is larger than that of females. About other living things, there is no difference between male and female.<br> | ||
| - | |||
<br><br><br> | <br><br><br> | ||
Revision as of 01:51, 28 September 2013
count down
Q1 Have you ever thought about experiments using living things?
1Yes 2No
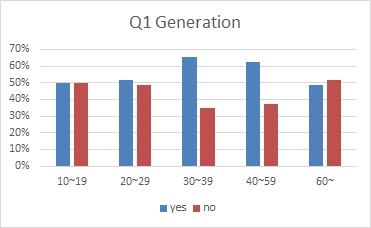
Fig1.A(10~19 N=92 20~29 N=68 30~39 N=26 40~59 N=32 60~=33)
comparison by generation
the number of 20s to 50s people who chose yes is larger than that of other generation.
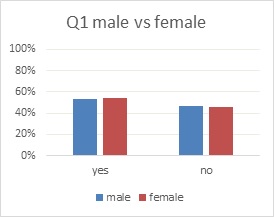
Fig2.(male=111 female=141)
A comparison between male and female
There does not seem to be much difference.
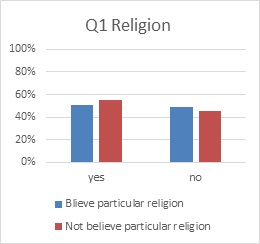
Fig3.(Believe particular religion N=126 Not believe particular religion N=126)
A comparison between people who have specific religion and people who do not.
There does not seem to be much difference.
Q2 Do you think these experiments using living-creatures are permissible? Please give X as many as you think it is permissible.
check
no check
Q2.1 Subjects are killed in the experiment, but it can save people in disease.
Q2.2 Subjects can be killed in the experiment, but it can save people in disease.
Q2.3 Subjects are not killed in the experiment but they never go back in nature. However, it can save people in disease.
Q2.4 Subjects are only observed in nature and it can save people in disease.
Q2.5 Subjects are killed in the experiment, but it can improve our life.
Q2.6 Subjects can be killed in the experiment, but it can improve our life.
Q2.7 Subjects are not killed in the experiment but they never go back in nature. However, it can improve our life.
Q2.8 Subjects are only observed in nature and it can improve our life.
Q2.9 Subjects are killed in the experiment, but it can advance science.
Q2.10 Subjects can be killed in the experiment, but it can advance science.
Q2.11 Subjects are not killed in the experiment but they never go back in nature. However, it can advance science.
Q2.12 Subjects are only observed in nature and it can advance science.
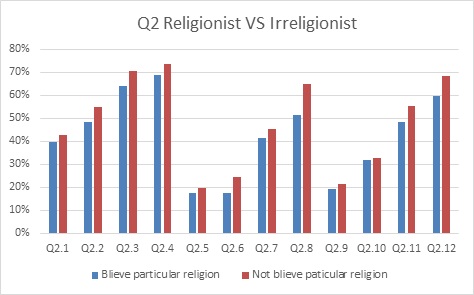
Fig4.(Believe particular religion N=126 Not believe particular religion N=126)
A comparison between people who have specific religion and people who do not.
People who do not have specific religion permit using living things for experiments than people who have specific religion.

Fig5.(Believe particular religion N=126 Not believe particular religion N=126)
A comparison between people who have specific religion and people who do not.
People who do not have specific religion permit using living things for experiments than people who have specific religion.
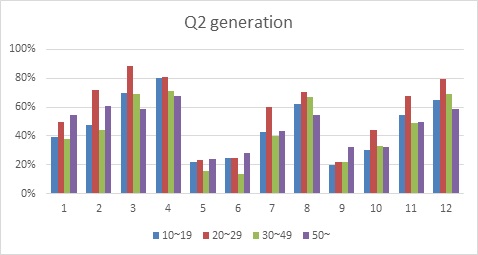
Fig6.(10~19 N=92 20~29 N=68 30~49 N=45 50~ N=46)
A comparison by generation
20s permit using living things for experiments than other generation.
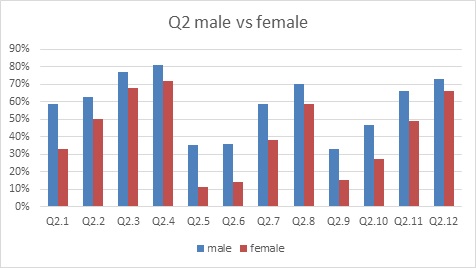
Fig7.(male N=111 female N=141)
A comparison between male and female
Male permit using living things for experiments than female.
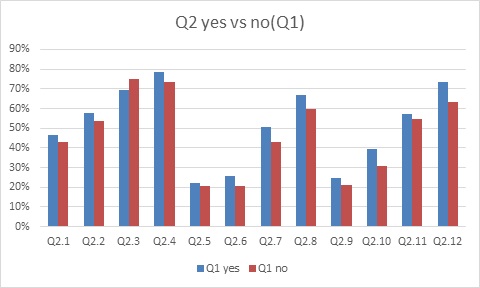
Fig8.(Q1 yes N=135 Q1 no N=117)
A comparison between people who answered YES at Q1 and who answered NO.
There doesn't seem to be any difference.
Q3 How much do you know about genetically modifying (GM) technology?
1 I know well.
2 I know only its name.
3 I do not know at all.
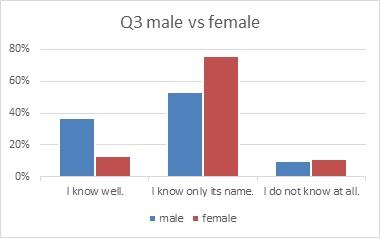
Fig9.(male N=173 female N=210)
A comparison between male and female
The propotion of males who answered "I kwow" about genetically modification (GM) is higher than that of females.
Q4 Do you think modifying creature’s gene is ethically permissible or not?
1 Yes, we can modify every creatures’ gene.
2 Partly yes, some can be but others are not.
3 No, any living things’ gene cannot be modified.
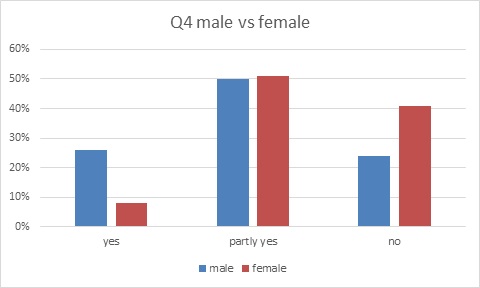
Fig10.(male N=204 female N=227)
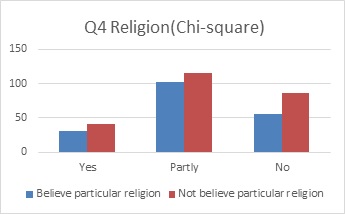
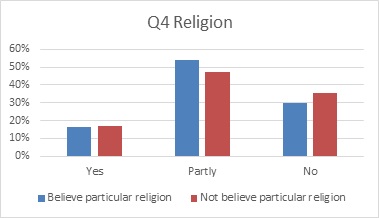
Fig11.(Belive particular religion N=242 Not believe particular religion N=189)

Fig12.(Yes N=72 Partly yes N=217 no N=142)
Q5 Who answered ‘partly yes’ to the fifth question, please answer this question. Which of these creatures’ gene can be modified? Please give X as many as you think it is permissible.
check
no check
Q5.1 Bacteria Q5.2 wheat Q5.3 honeybee Q5.4 killifish Q5.5 frog
Q5.6 chickens Q5.7 mouse Q5.8 dog Q5.9 monkey Q5.10 human beings
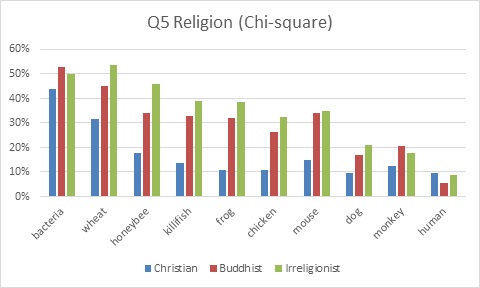
Fig13.(Chiristian N=71 Buddist N=105 Irreligionist N=189)
The graph shows the difference according to religion.
The graph of Buddhist is almost the same with that of Irreligionist, which shows that the higher the animals are, the less people who thinks their genes can be modified.
From honey bee to human beings,Christian who thinks genetically modification is permitted takes up about 15%.
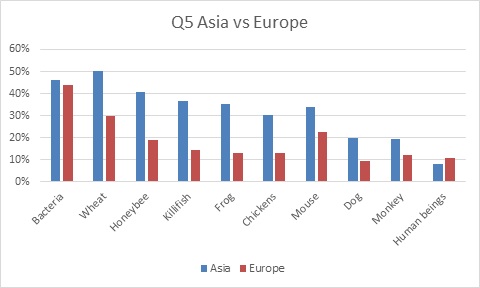
Fig14.(Asia N=332 Europe N=82)
A comparison between Asian and Europe.
The graph is similar with the one which compares between religions. The graph of Asian is similar to that of Buddhist and Irreligionist, while the graph of Europe is similar to that of Christian.
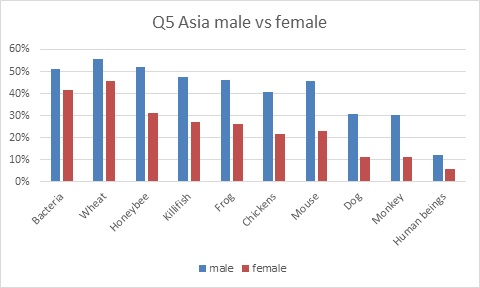
Fig15.(male N=150 female N=166)
A comparison between male and females in Asia.
This graph shows the difference between male and female from Asia.
The number of males who allow genetically modification is larger than that of females.
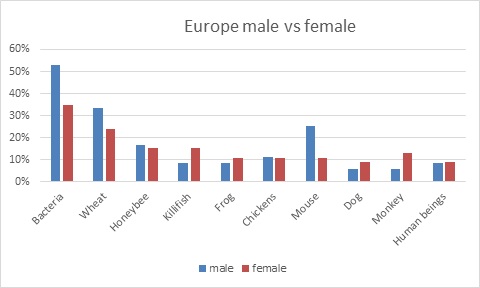
Fig16.(male N=30 female N=44)
A comparison between male and female in Europe.
The number of males who answered that genetically modification is admitted in E. coli and mice is larger than that of females. About other living things, there is no difference between male and female.
Conclusion
Q1
When we see fig2 and fig3 there doesn't seem any difference.
When we see fig1 the number of 20s to 50s people who chose yes is larger than that of other generation.
Q2
The standard of the answer to this question is whether the answer places an importance on the profit they may gain through animal experiments, or the agony the animals feel through these experiments.
We asked whether animal experiments can be allowed from three points, “saving human beings”, “useful to our life”, “contribution to the development of science”
As a result, people who answered that animal experiment can be performed if it is for saving human beings was obviously larger than the other two points.
As for the difference by sex, male seems to be more generous to animal experiment, and place an importance on the profit of the human beings while female seem to place an importance on the animals’ pain.
When we compared by the salary or age, there seemed to be no significant difference.
Q5
性別、地域、宗教別にみた結果に差が認められる。
性別差を見ると、男性の方が、女性より遺伝子組み換えを認めている。
地域差を見ると、アジア圏の人々が、大腸菌や小麦といった生物に対する実験に約50%の人が許容すると答えており、ネズミは約35%、犬、猿は約20%近くが許容している。比較して、ヨーロッパ圏の人々の答えは、大腸菌と小麦はやはり高めだが、その他全ての動物が約15%の許容をしている。
(各設問のコメント記載)
(まとめ)
 "
"