Team:DTU-Denmark/Experiment2
From 2013.igem.org
(→Control: Untransformed E. coli -- Round 2) |
(→Nir Transformed E. coli) |
||
| Line 37: | Line 37: | ||
=== Nir Transformed ''E. coli'' === | === Nir Transformed ''E. coli'' === | ||
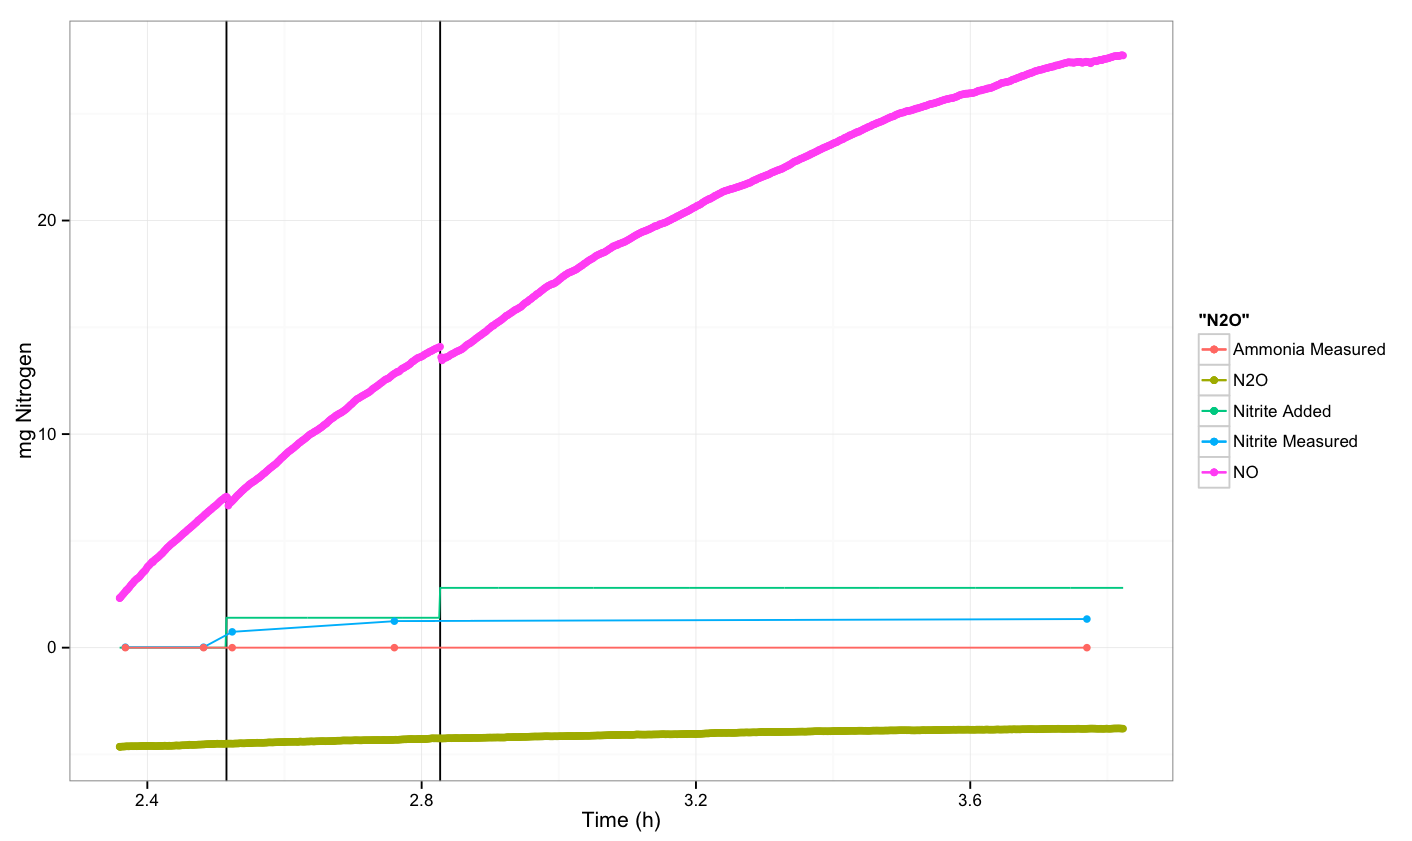
| - | Finally, we measured both N<sub>2</sub>O and NO, but did not see an increase in N<sub>2</sub>O. The NO sensor did not stabilize over the course of the experiment, and these results are not realistic. | + | Finally, we measured both N<sub>2</sub>O and NO, but did not see an increase in N<sub>2</sub>O. The NO sensor did not stabilize over the course of the experiment, and these results are not realistic. Additionally, the N<sub>2</sub>O sensor was calibrated correctly, but when the experimental readings were converted to mg nitrogen, the values were negative. Since this is not realistic, it is likely that the readings are not accurate and that possibly the sensor should be replaced. Unfortunately, we did not have enough time to repeat the experiment with a new sensor. |
[[File:Dtu-nir.png|600px]] | [[File:Dtu-nir.png|600px]] | ||
Revision as of 13:37, 29 September 2013
Anaerobic production of nitrous oxide from nitrite
Contents |
Introduction
In this anaerobic experiment we add nitrite (NO2- ) in a series of spikes to:
- an untransformed strain of E. coli
- an untransformed strain of P. aeruginosa
- Mutant 2: a strain of E. coli transformed with the Nir gene from P. aeruginosa
in order to characterize how readily nitrite is converted to nitric oxide (NO), and subsequently to nitrous oxide (N2O). We also monitor nitrite, ammonia and nitrate concentrations before each spike. The concentrations of nitrous oxide is measured continually and the ammonia, nitrite and nitrate concentrations are measured at a series of time points around the spike. For some experiments, we have data for the concentration of nitric oxide as well, however, the sensor frequently gave unreliable results and was replaced during the summer. While we were waiting for the new one to arrive, we were not able to take NO measurements.
Methods
The experimental procedure follows Protocol for Experiment 2.
For the calibration of the N2O and NO electrodes we follow the calibration protocol.
Results and Discussion
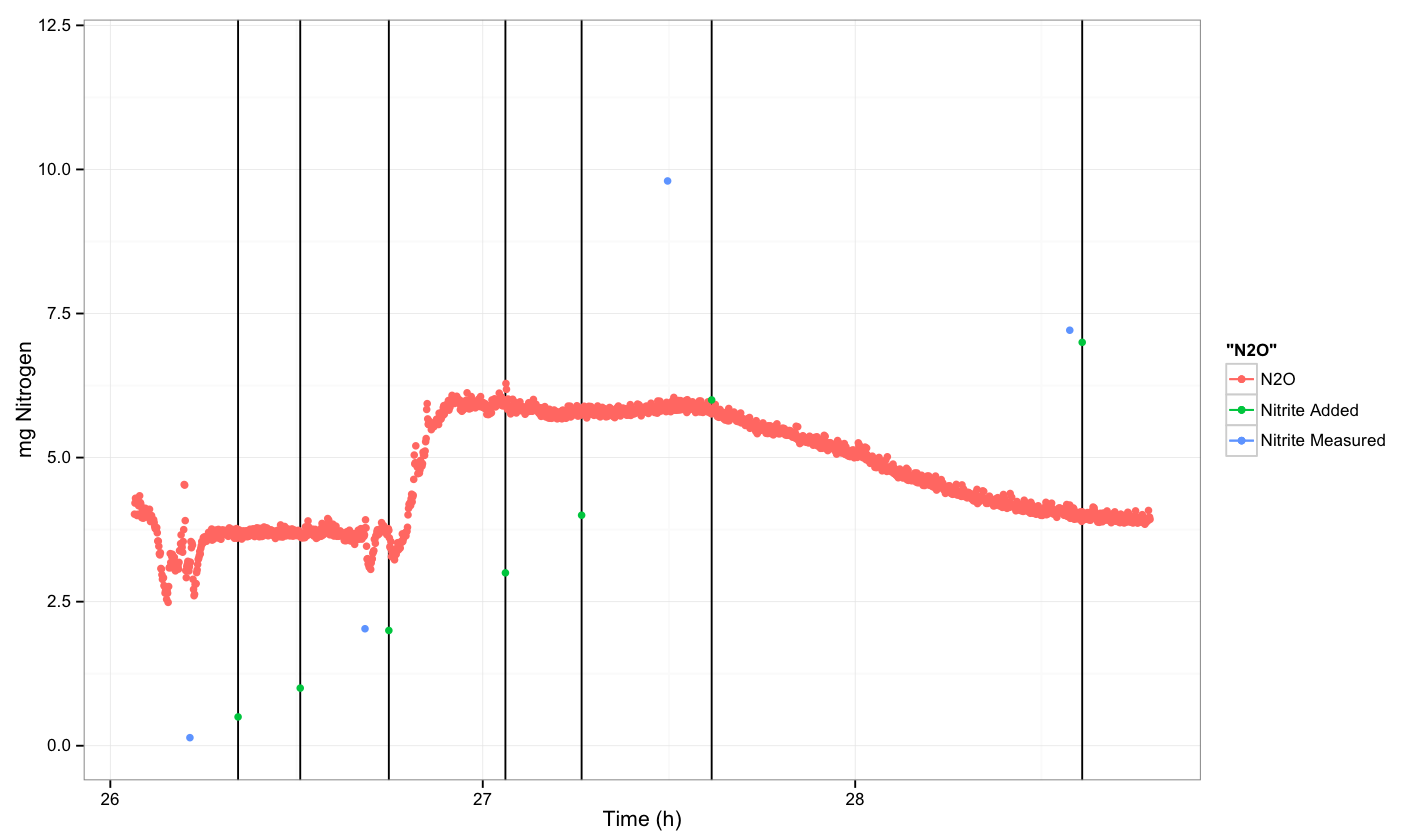
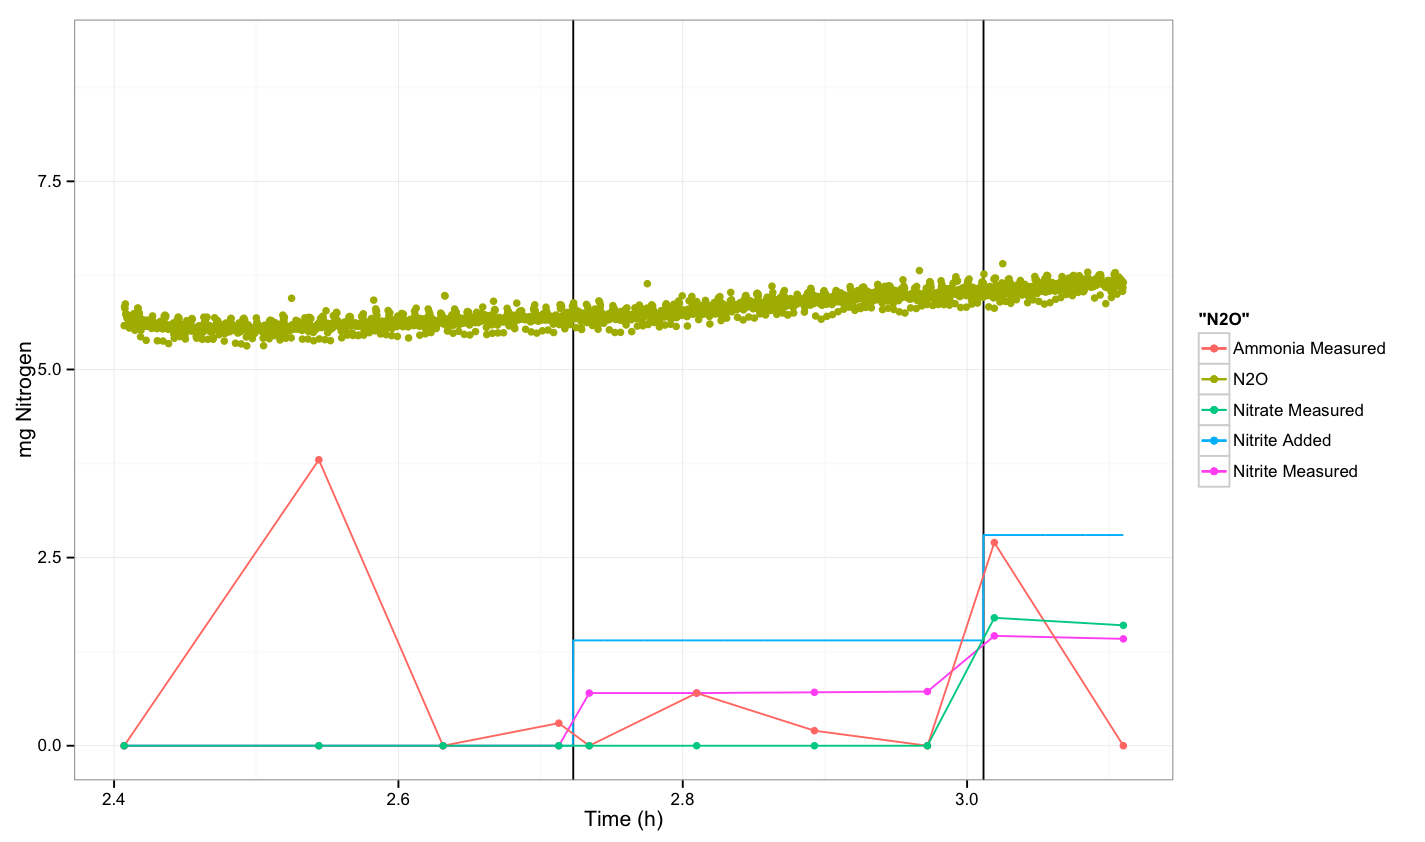
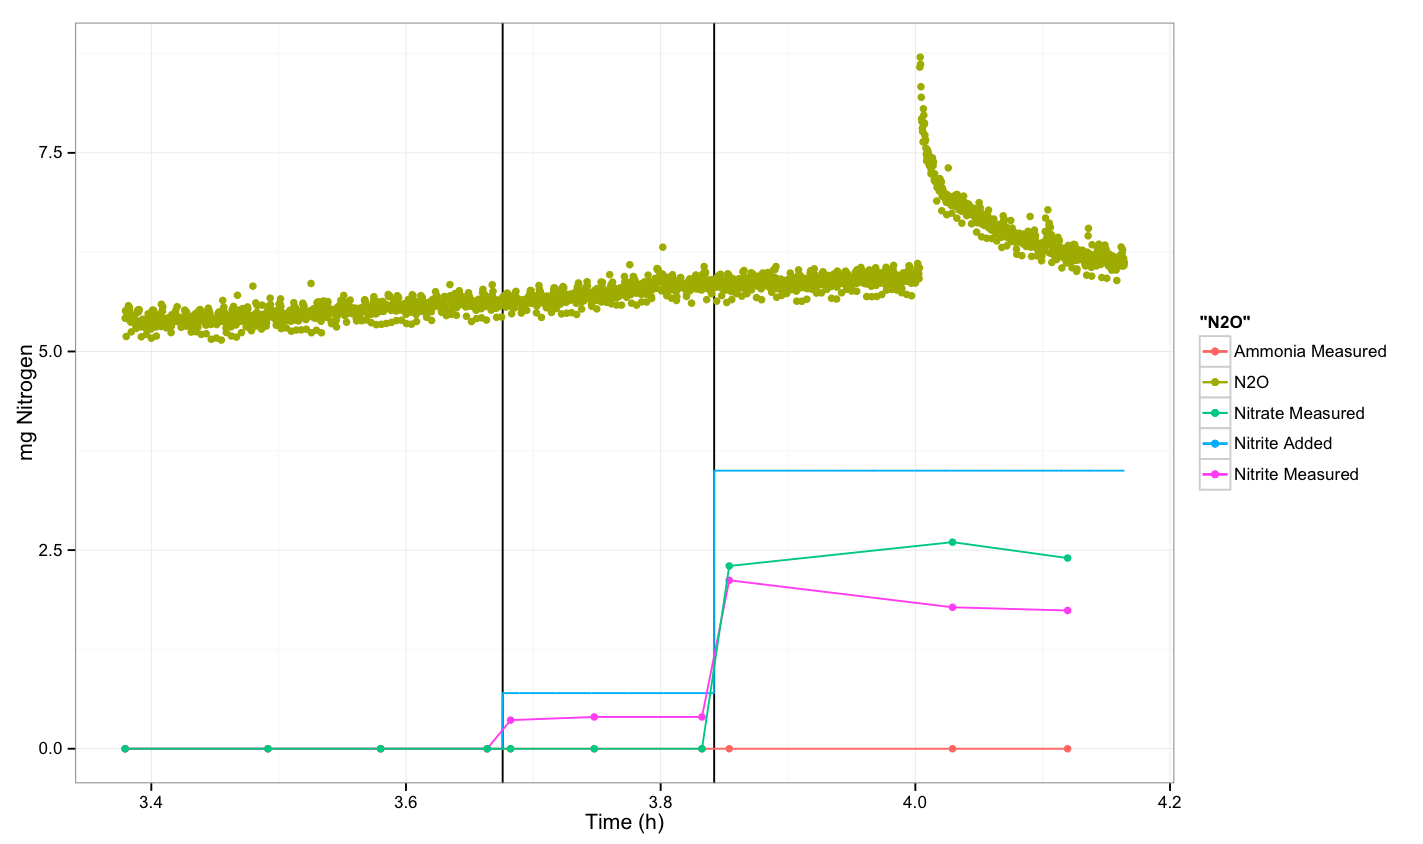
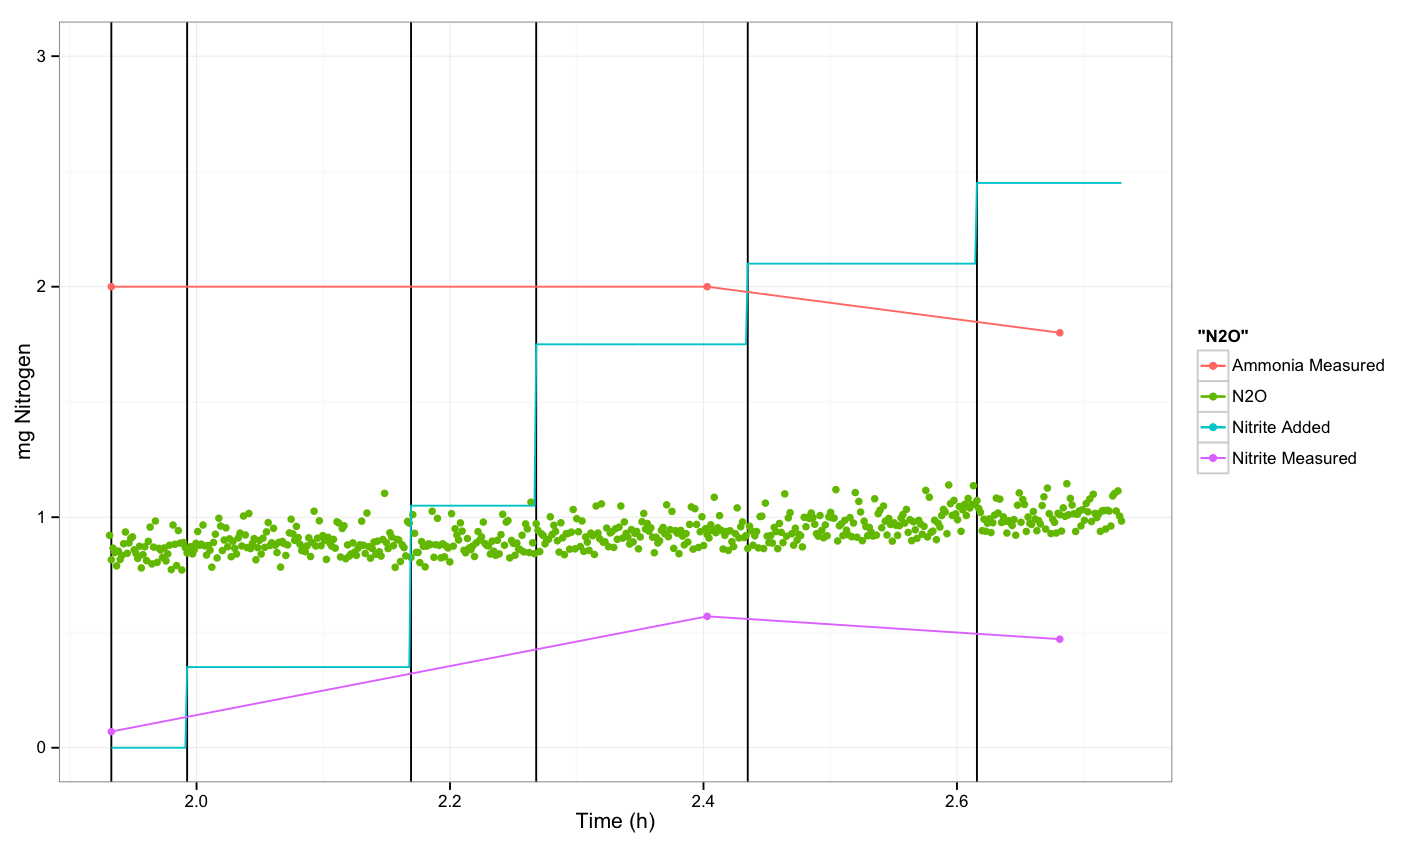
In the following diagrams, the y-axis shows mg of Nitrogen (as nitrite, nitrous oxide or other N-source) per litre vs time. Vertical lines indicate the time at which we spiked with nitrite. All experiments were performed anaerobically.
Control: Untransformed E. coli -- Round 1
It appears that we observed a response from the cells after the third spike. However, this could also be due to fluctuations in the sensor.
Control: Untransformed E. coli -- Round 2
We repeated the experiment to try to reproduce the response that we saw in round 1. We were not able to see a response in either replicate that we did this round. At the end of the second replicate, the sensor gave a jump in reading, but due to the quick drop off, it is most likely that this is due to fluctuation in the sensor and is not a reliable reading.
Untransformed P. aeruginosa
We also did not see a response for the P. aeruginosa, which we would expect.
Nir Transformed E. coli
Finally, we measured both N2O and NO, but did not see an increase in N2O. The NO sensor did not stabilize over the course of the experiment, and these results are not realistic. Additionally, the N2O sensor was calibrated correctly, but when the experimental readings were converted to mg nitrogen, the values were negative. Since this is not realistic, it is likely that the readings are not accurate and that possibly the sensor should be replaced. Unfortunately, we did not have enough time to repeat the experiment with a new sensor.
 "
"
