Team:DTU-Denmark/Experiment4
From 2013.igem.org
(→AMO Transformant) |
(→AMO Transformant) |
||
| Line 18: | Line 18: | ||
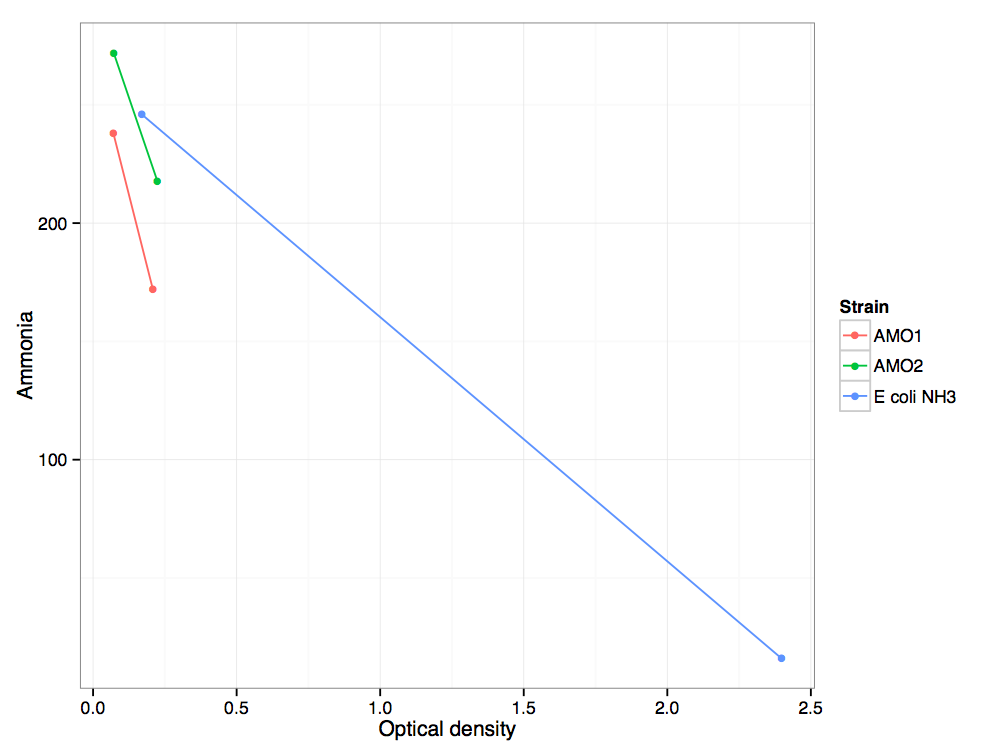
Ammonia measured plotted vs optical density from minutes 129 to 885 for two replicates of the AMO transformant, and an untransformed ''E. coli'' control. The slope (change in concentration of Ammonia / change in optical density) of this graph indicates consumption of Ammonia. | Ammonia measured plotted vs optical density from minutes 129 to 885 for two replicates of the AMO transformant, and an untransformed ''E. coli'' control. The slope (change in concentration of Ammonia / change in optical density) of this graph indicates consumption of Ammonia. | ||
| - | {| | + | {| class="wikitable" |
! Strain | ! Strain | ||
! d[NH<sub>4</sub><sup>+</sup>]/dOD | ! d[NH<sub>4</sub><sup>+</sup>]/dOD | ||
|- | |- | ||
| - | | | + | |AMO replicate 1 |
| -479.3 | | -479.3 | ||
|- | |- | ||
| - | | | + | |AMO replicate 2 |
| -356.2 | | -356.2 | ||
|- | |- | ||
Revision as of 14:28, 4 October 2013
Aerobic consumption of ammonium and hydroxylamine
Contents |
Introduction
In this aerobic experiment, we add ammonium NH4+ to AMO transformed E. coli cells and measure the consumption of ammonium to determine whether our AMO transformant is converting ammonium to hydroxylamine (NH2OH) faster than an untransformed E. coli control. A similar protocol is used to determine whether our HAO transformant is converting hydroxylamine to nitrite NO2-, by measuring production of nitrite.
Methods
The experiment is based on the protocol Experiment 4 and it was performed on August 27th and August 28th.
Results
AMO Transformant
Ammonia measured plotted vs optical density from minutes 129 to 885 for two replicates of the AMO transformant, and an untransformed E. coli control. The slope (change in concentration of Ammonia / change in optical density) of this graph indicates consumption of Ammonia.
| Strain | d[NH4+]/dOD |
|---|---|
| AMO replicate 1 | -479.3 |
| AMO replicate 2 | -356.2 |
| E. coli | -103.2 |
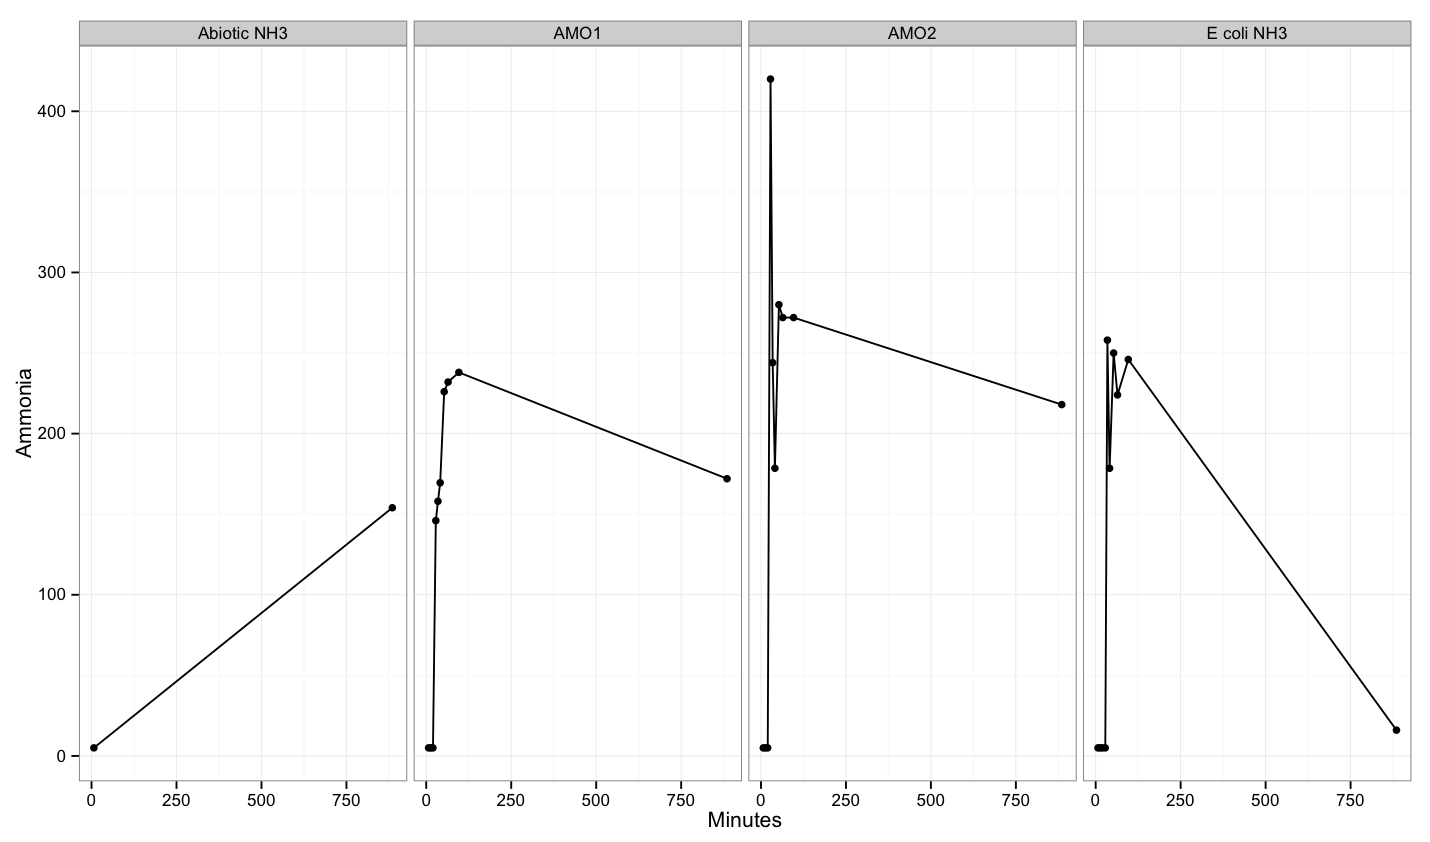
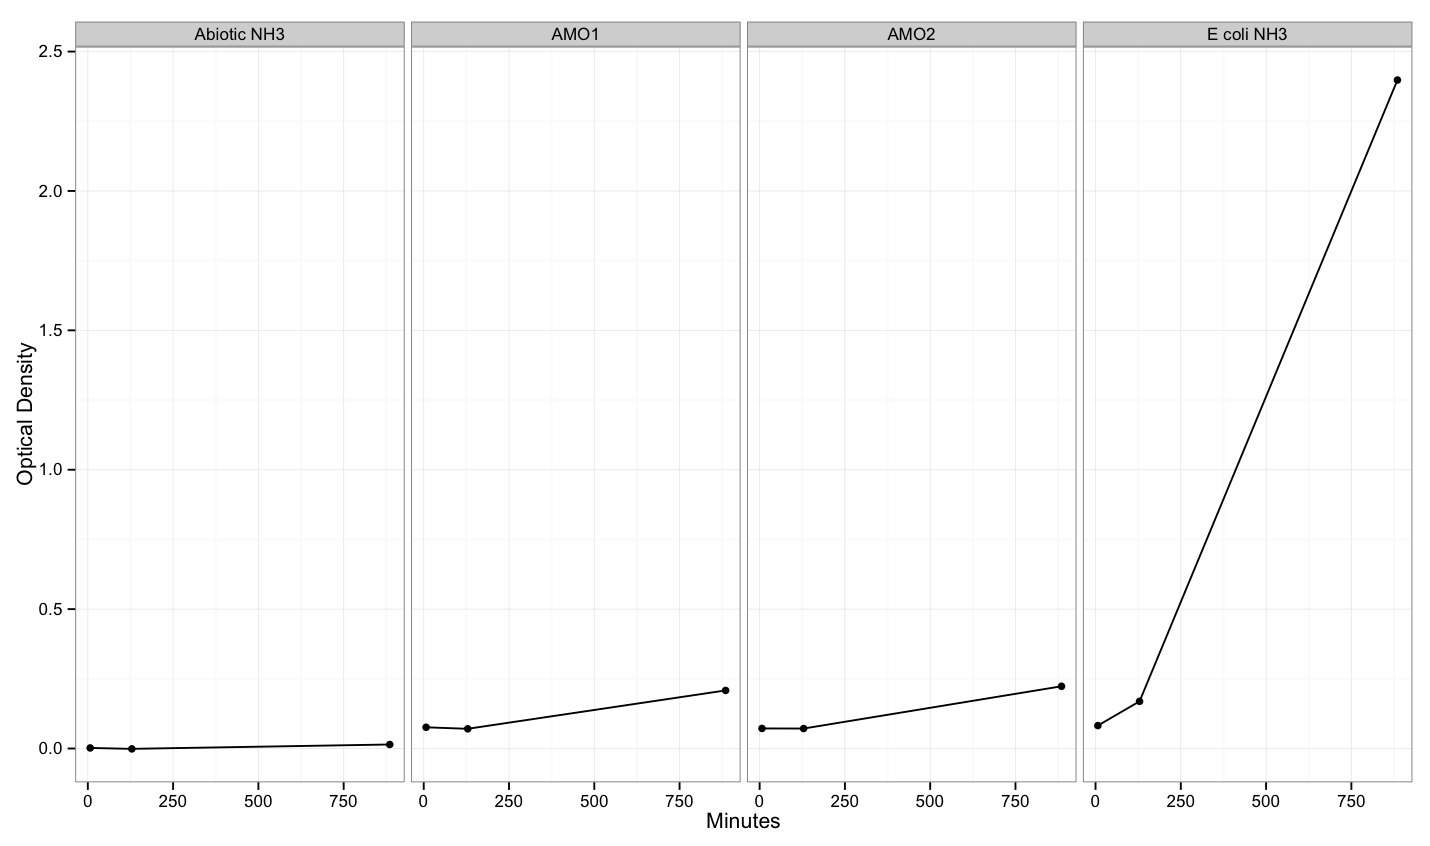
Supplemental figures follow.
HAO Transformant
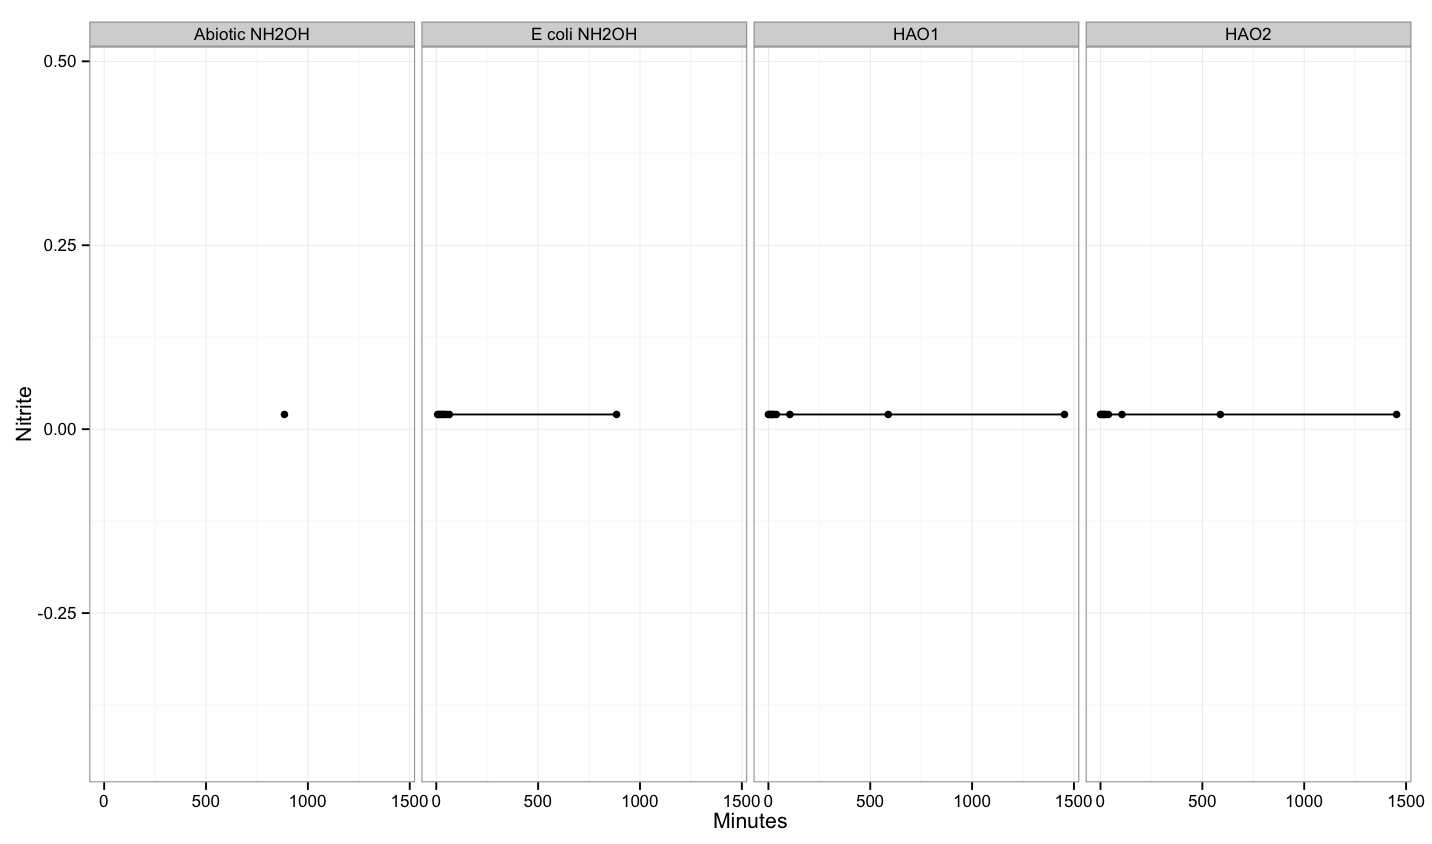
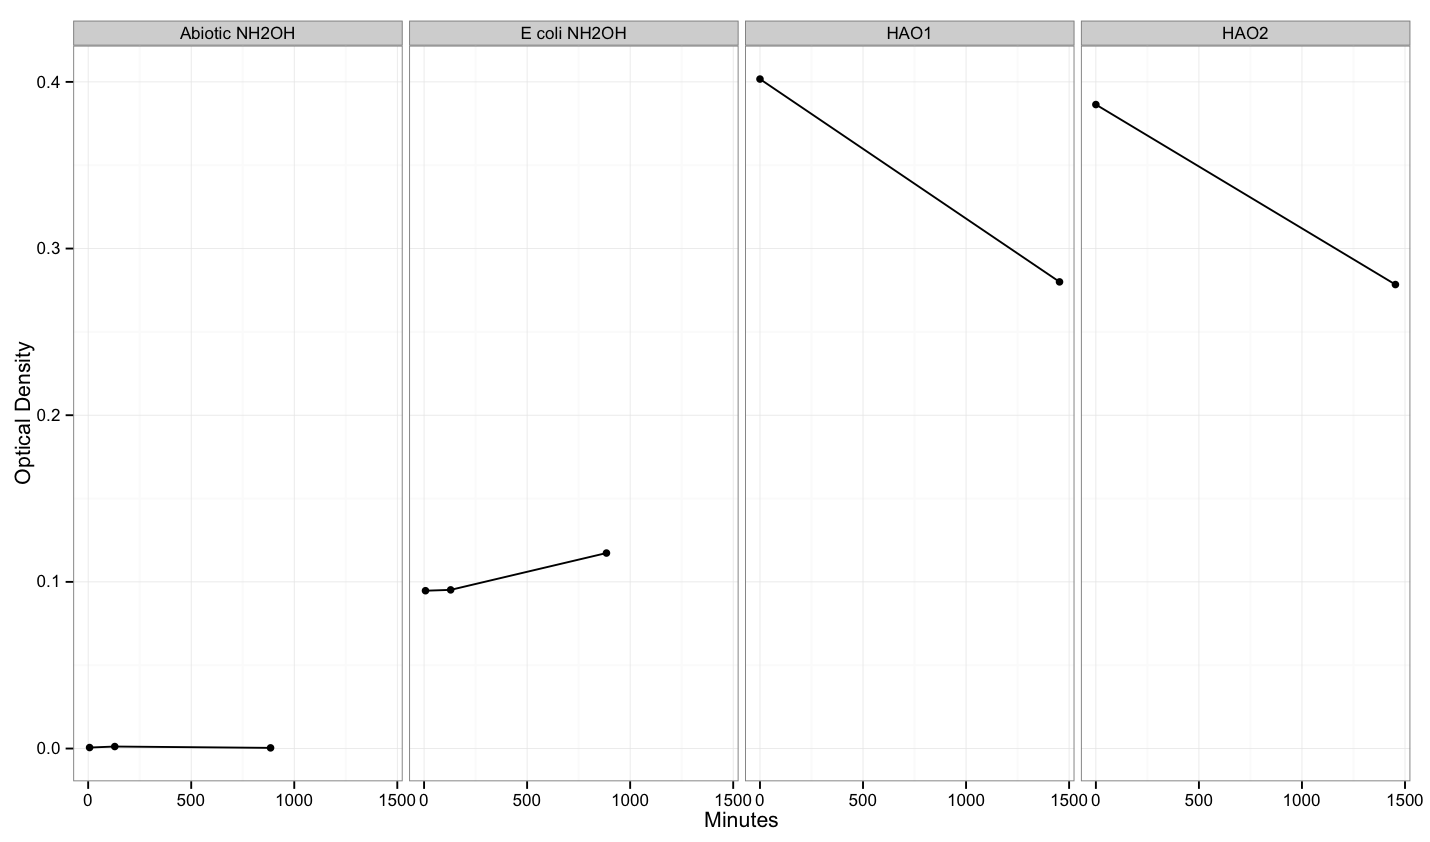
Over the course of the experiment, the OD for all treatments that hydroxylamine was added to decreased or remained essentially constant. Additionally, no nitrite was detected in any of the treatments.
Conclusion and Discussion
The AMO transformant uses ammonia at a rate greater than the untransformed E. coli control. This suggests that the AMO is consuming ammonia and converting it to hydroxylamine. Additionally, however, the AMO transformant grows significantly more slowly than the control.
It is clear that hydroxylamine is toxic to the cells at this concentration. With more time, it would be interesting to repeat the toxicity experiment using hydroxylamine to determine the threshold concentration that causes cell death. We expect that in vivo, the hydroxylamine to nitrite reaction catalyzed by HAO happens very quickly (TODO add ref) and that even at high throughput, hydroxylamine should not accumulate in the cell.
 "
"
