Team:NCTU Formosa/modeling
From 2013.igem.org
Lsps9141105 (Talk | contribs) (→Plux efficiency) |
Lsps9141105 (Talk | contribs) (→Single Unit) |
||
| Line 54: | Line 54: | ||
<div class="li"><div class="card"> | <div class="li"><div class="card"> | ||
| + | |||
| + | ======Reference====== | ||
| + | <div class="rev"> | ||
| + | <ol start="1"> | ||
| + | <li>iGEM 2007 Imperial https://2007.igem.org/Imperial</li> | ||
| + | </ol> | ||
| + | </div> | ||
| + | </div></div> | ||
| + | |||
| + | {{:Team:NCTU Formosa/source/card-end}} | ||
| + | <html> | ||
| + | <p>Cover image credit: <a href="http://www.dvq.co.nz/" target="_blank">DVQ</a></p> | ||
| + | </div> </div> | ||
===Single Circuit=== | ===Single Circuit=== | ||
Revision as of 12:38, 28 October 2013
Modeling was our first step forward. When validated with our experimental data, modeling is also a verification of the accuracy of our experiments.
Contents |
MATLAB Introduction
MATLAB (matrix laboratory) is a numerical computing environment and fourth-generation programming language. It is developed by MathWorks, a company in United States. MATLAB allows matrix manipulations, plotting of functions and data, implementation of algorithms, creation of user interfaces, and interfacing with programs written in other languages, including C, C++, Java, and Fortran. Although MATLAB is intended primarily for numerical computing, an optional toolbox uses the MuPAD symbolic engine, allowing access to symbolic computing capabilities. An additional package, Simulink, adds graphical multi-domain simulation and Model-Based Design for dynamic and embedded systems.
ANFIS Introduction
Adaptive-Network-Based Fuzzy Inference System, in short ANFIS, is a power tool for constructing a set of fuzzy if-then rules to generate stipulated output and input pairs. Unlike system modeling using mathematical rules that lacks the ability to deal with ill-defined and uncertain system, ANFIS can transform human knowledge into rule base, and therefore, ANFIS can effectively tune membership functions, minimizing the output error.
Single Unit
Red Promoter
Lux Promoter
We did the following modeling based on the data obtained from Imperial 2007 iGEM team. The data notes the strength of Plux under different concentrations of AHL and different time frames.
Using ANFIS to train 76 sets of data and to test 20 sets of data, we ontained Figure 3. It shows that our training data exhibits a similar trend as the testing data, even though the computer has no based knowledge of the trend. This simply means that our modeling has successfully simulated the actually data.
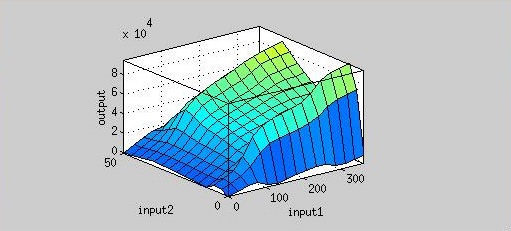
Figure 4 is the resultant graph from input 1(time) and input 2(AHL concentration). According to this graph, we can observe the fluorescence has two peaks about AHL concentration(at concentration of 4 nM and 40 nM). That means we could achieve our regulation goal with little AHL. Also, pleas note that there is more output as time passes.
37 °C RBS
We used Figure 1 biobrick to model our 37oC RBS's function at different temperatures.
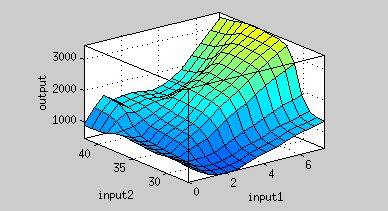
First, we did a experiment that test the fluroscence at different temperature and different time. Then we input these sets of data to ANFIS system to model the graph like Figure 2.
From Figure 1, the maximum output is obtained at 37 oC. Under the same time frame, the output (the normalized expression of the reporter gene) is maximized at 37 oC while minimized at 25 oC. There is a dramatic decrease in the output below 30 oC and the outputs around 37oC are much higher. This modeling demonstrates that using 37 oC RBS is a plausible approach for achieving gene expression through temperature.
Reference
- iGEM 2007 Imperial https://2007.igem.org/Imperial
We did the following modeling based on the data obtained from Imperial 2007 iGEM team. The data notes the strength of Plux under different concentrations of AHL and different time frames.
[[File:Plux_testbiobrick.jpg|400px|center|Figure 2. the biobrick to test expression of the lux promoter]]Using ANFIS to train 76 sets of data and to test 20 sets of data, we ontained Figure 3. It shows that our training data exhibits a similar trend as the testing data, even though the computer has no based knowledge of the trend. This simply means that our modeling has successfully simulated the actually data.
[[File:Nctu_Plux_train_wikifig.jpg|745px|center|Figure 3. The training and testing data using ANFIS system]] Figure 4 is the resultant graph from input 1(time) and input 2(AHL concentration). According to this graph, we can observe the fluorescence has two peaks about AHL concentration(at concentration of 4 nM and 40 nM). That means we could achieve our regulation goal with little AHL. Also, pleas note that there is more output as time passes. [[file:Nctu_Plux_ahl_time_wikifig.jpg|500px|center|Figure 4. Input 1 is time(min), input 2 is AHL concentration, and output is fluorescence.]] "
"


