Team:Buenos Aires/ resqrfp
From 2013.igem.org
| Line 40: | Line 40: | ||
As shown above, RFP shows a typical degradation curve through time.There is a high fall in the concentration of mRFP after the first 24 hours of removing arsenic. | As shown above, RFP shows a typical degradation curve through time.There is a high fall in the concentration of mRFP after the first 24 hours of removing arsenic. | ||
<html> | <html> | ||
| - | |||
| - | |||
<br> | <br> | ||
</html> | </html> | ||
Revision as of 18:33, 27 September 2013
Contents |
mRFP under Arsenic Inducible Promoter ([http://parts.igem.org/Part:BBa_K1106003 Bba_K1106003]) characterization
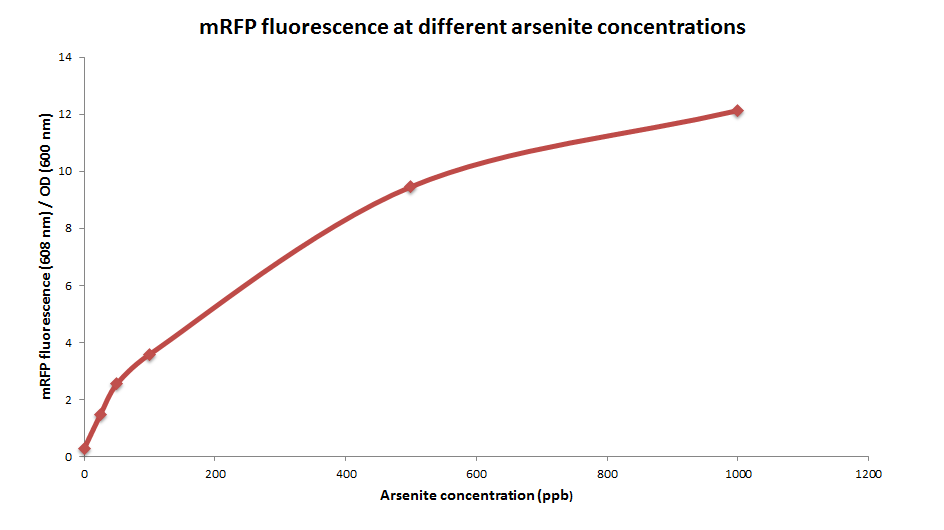
mRFP production at different arsenite concentrations
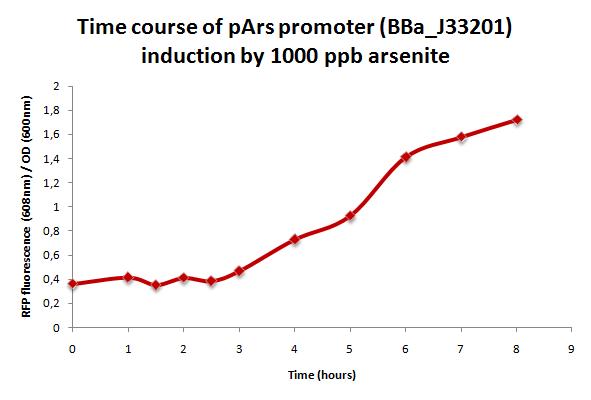
mRFP production over time
Method
First of all in the characterization of this part, mRFP fluorescence production was measured over time. To accomplish that a 100 ml culture of EColi DH5alfa carrying a plasmid with a mRFP generator under arsenite sensitive promoter was grown at 30°C until they reach OD=0.4 (600nm). At this point arsenite was added (1000ppb of arsenite final concentration) and fluorescence was measured every 30 minutes for 8 hours with a fluorimeter at 584 nm excitation peak and 607 nm emission peak. Each measure was normalized by culture density measured by OD (680nm).
Results
As it is shown in the figure below, in the presence of arsenite (1000 ppb) a typical transcriptional induction is observed over time. There is a lag of 3 hours in the mRFP produciton after adding arsenite.
mRFP stability over time
Protocol
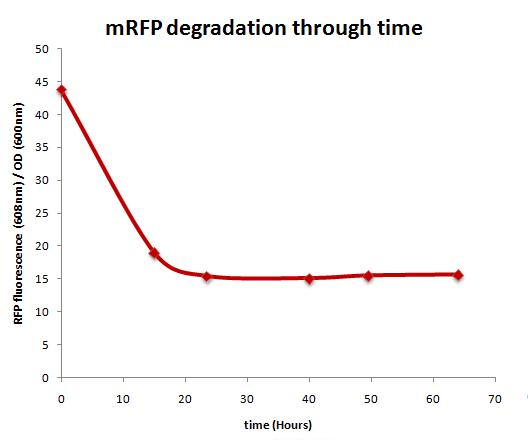
E. coli carrying a plasmid that encodes mRFP under an arsenite inducible promoter was grown overnight in 10 ml. LB medium with arsenic (2000 ppb). The following day, the culture was centrifuged and the supernatant was discarded in order to remove the arsenic, stopping the induction. After that, new medium was added and the pellet was resuspended. This was done twice. 1 ml of this culture was removed and centrifuged after every 12 hours for the following 4 days. At the end, it was measure the fluorescence of the samples and normalized by the OD (600 nm).
Results
As shown above, RFP shows a typical degradation curve through time.There is a high fall in the concentration of mRFP after the first 24 hours of removing arsenic.
Naked eye discernibility range of mRFP production by arsenite inducible promoter
Method
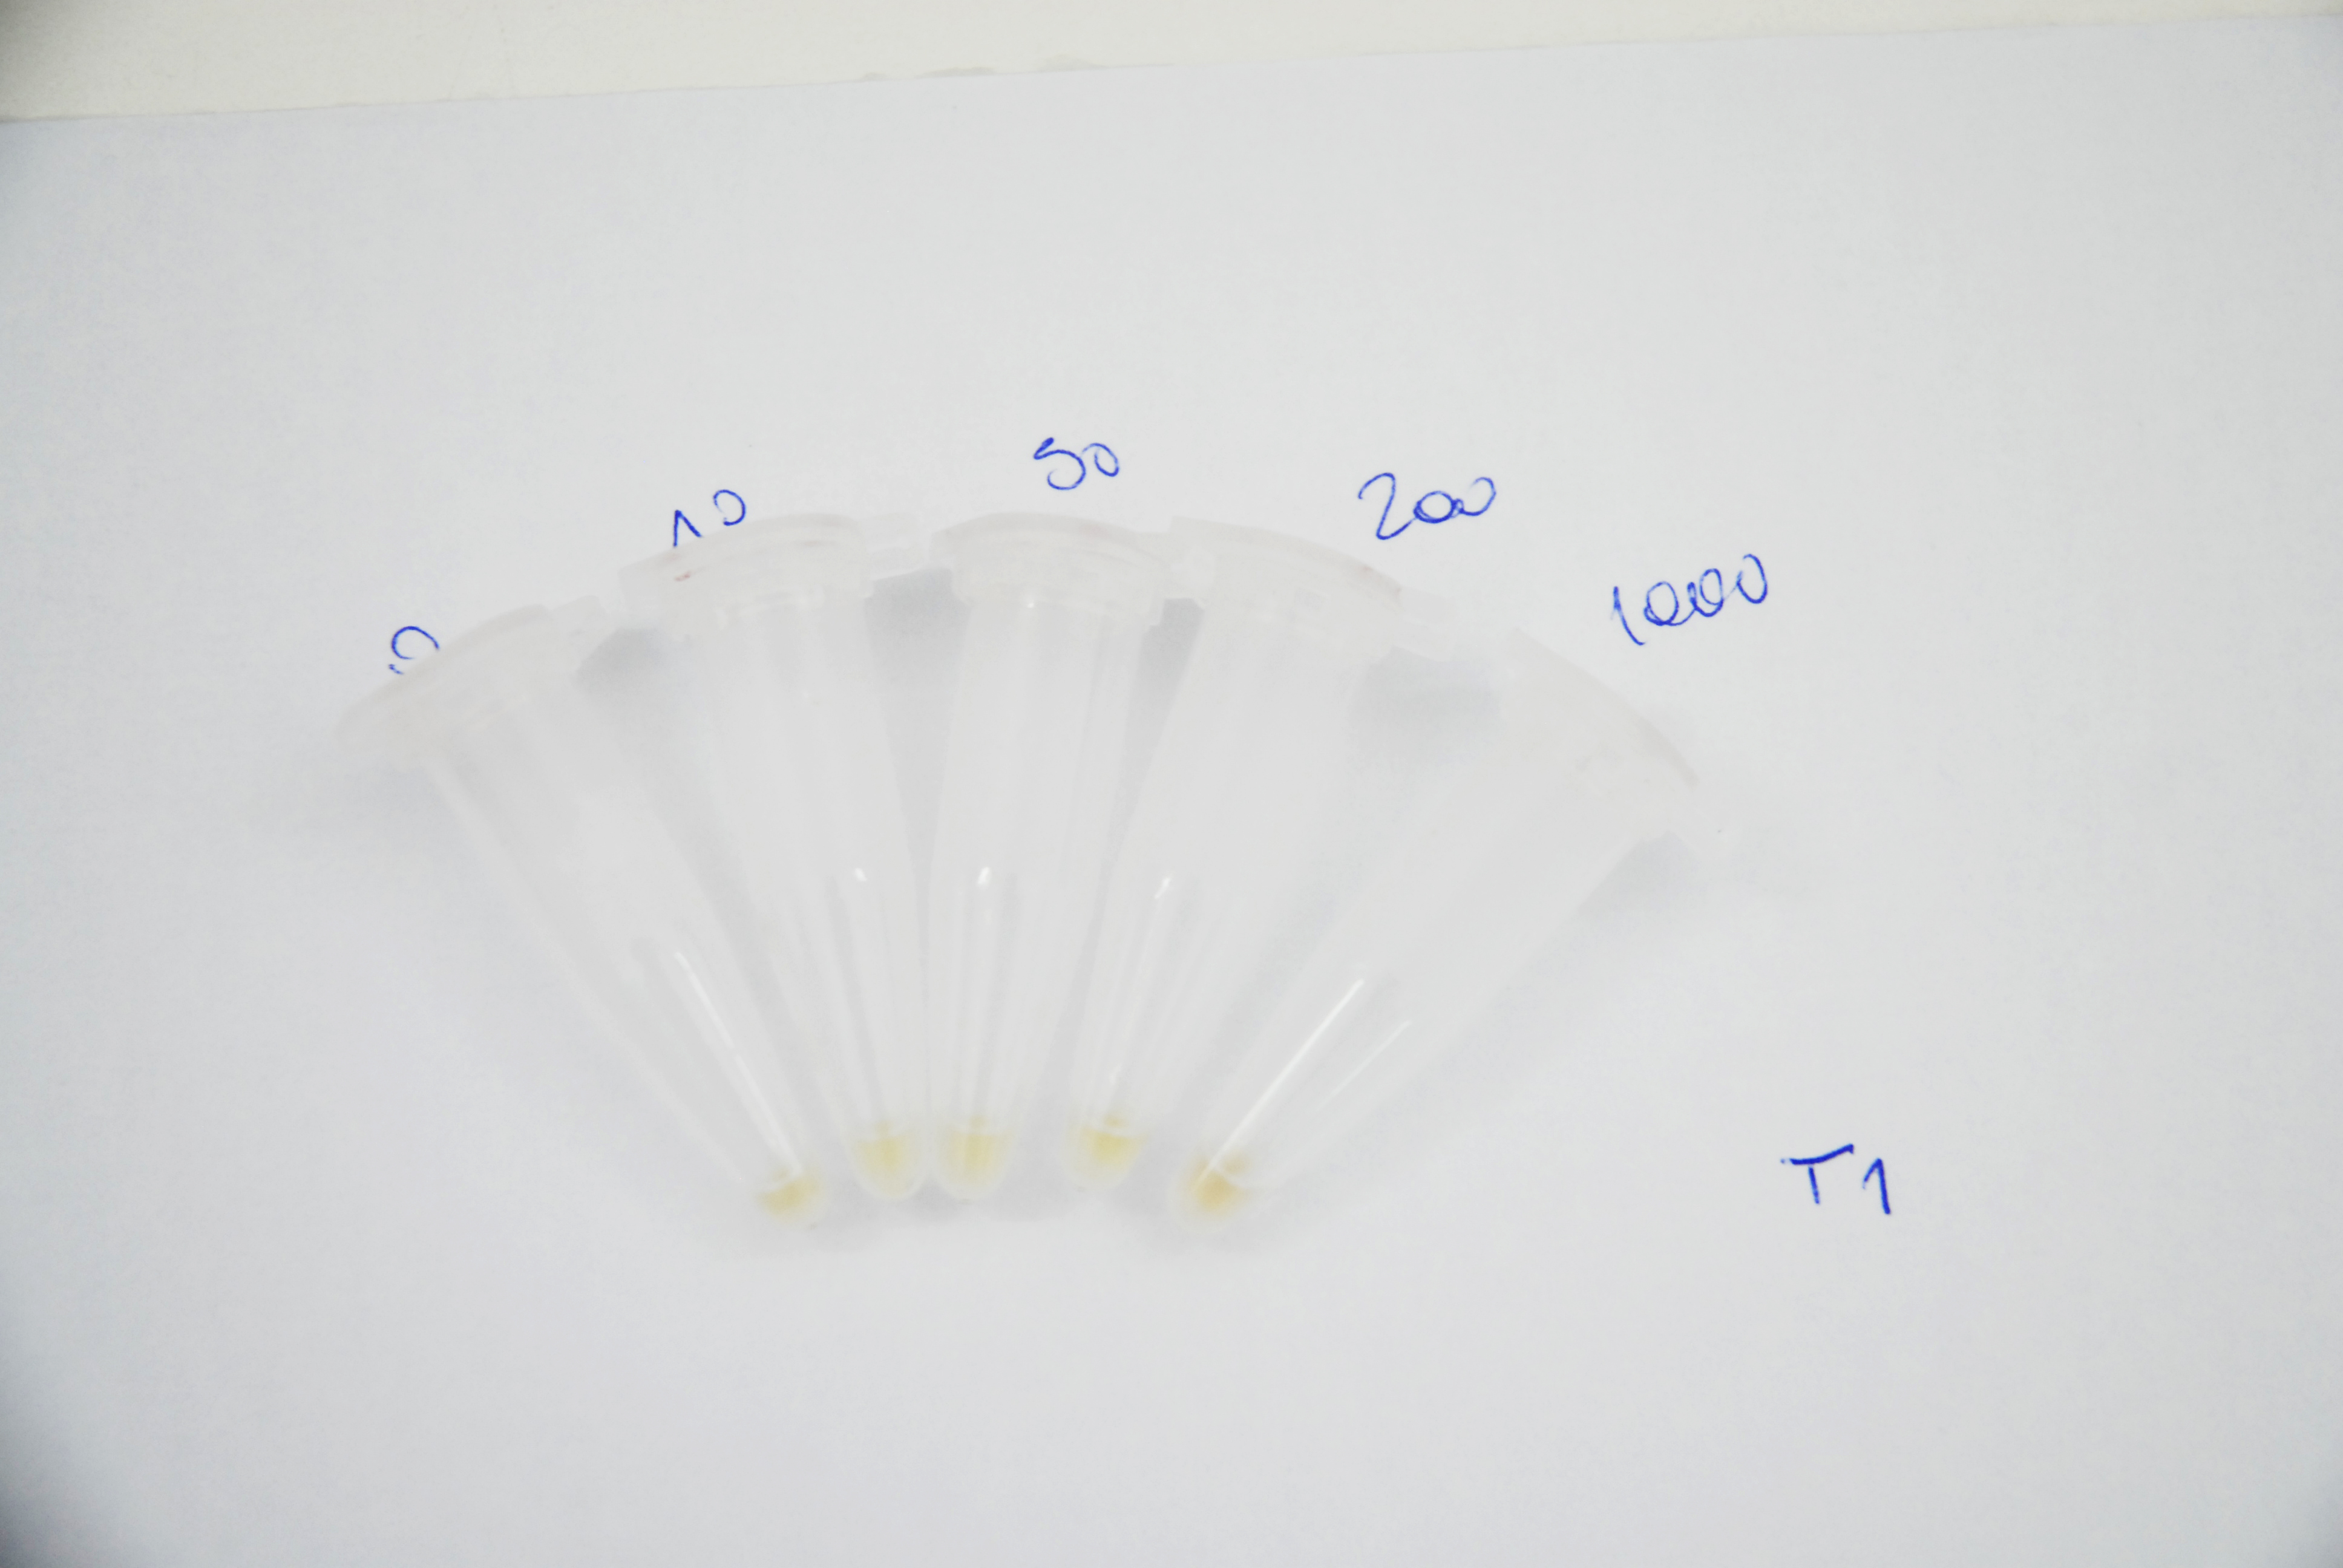
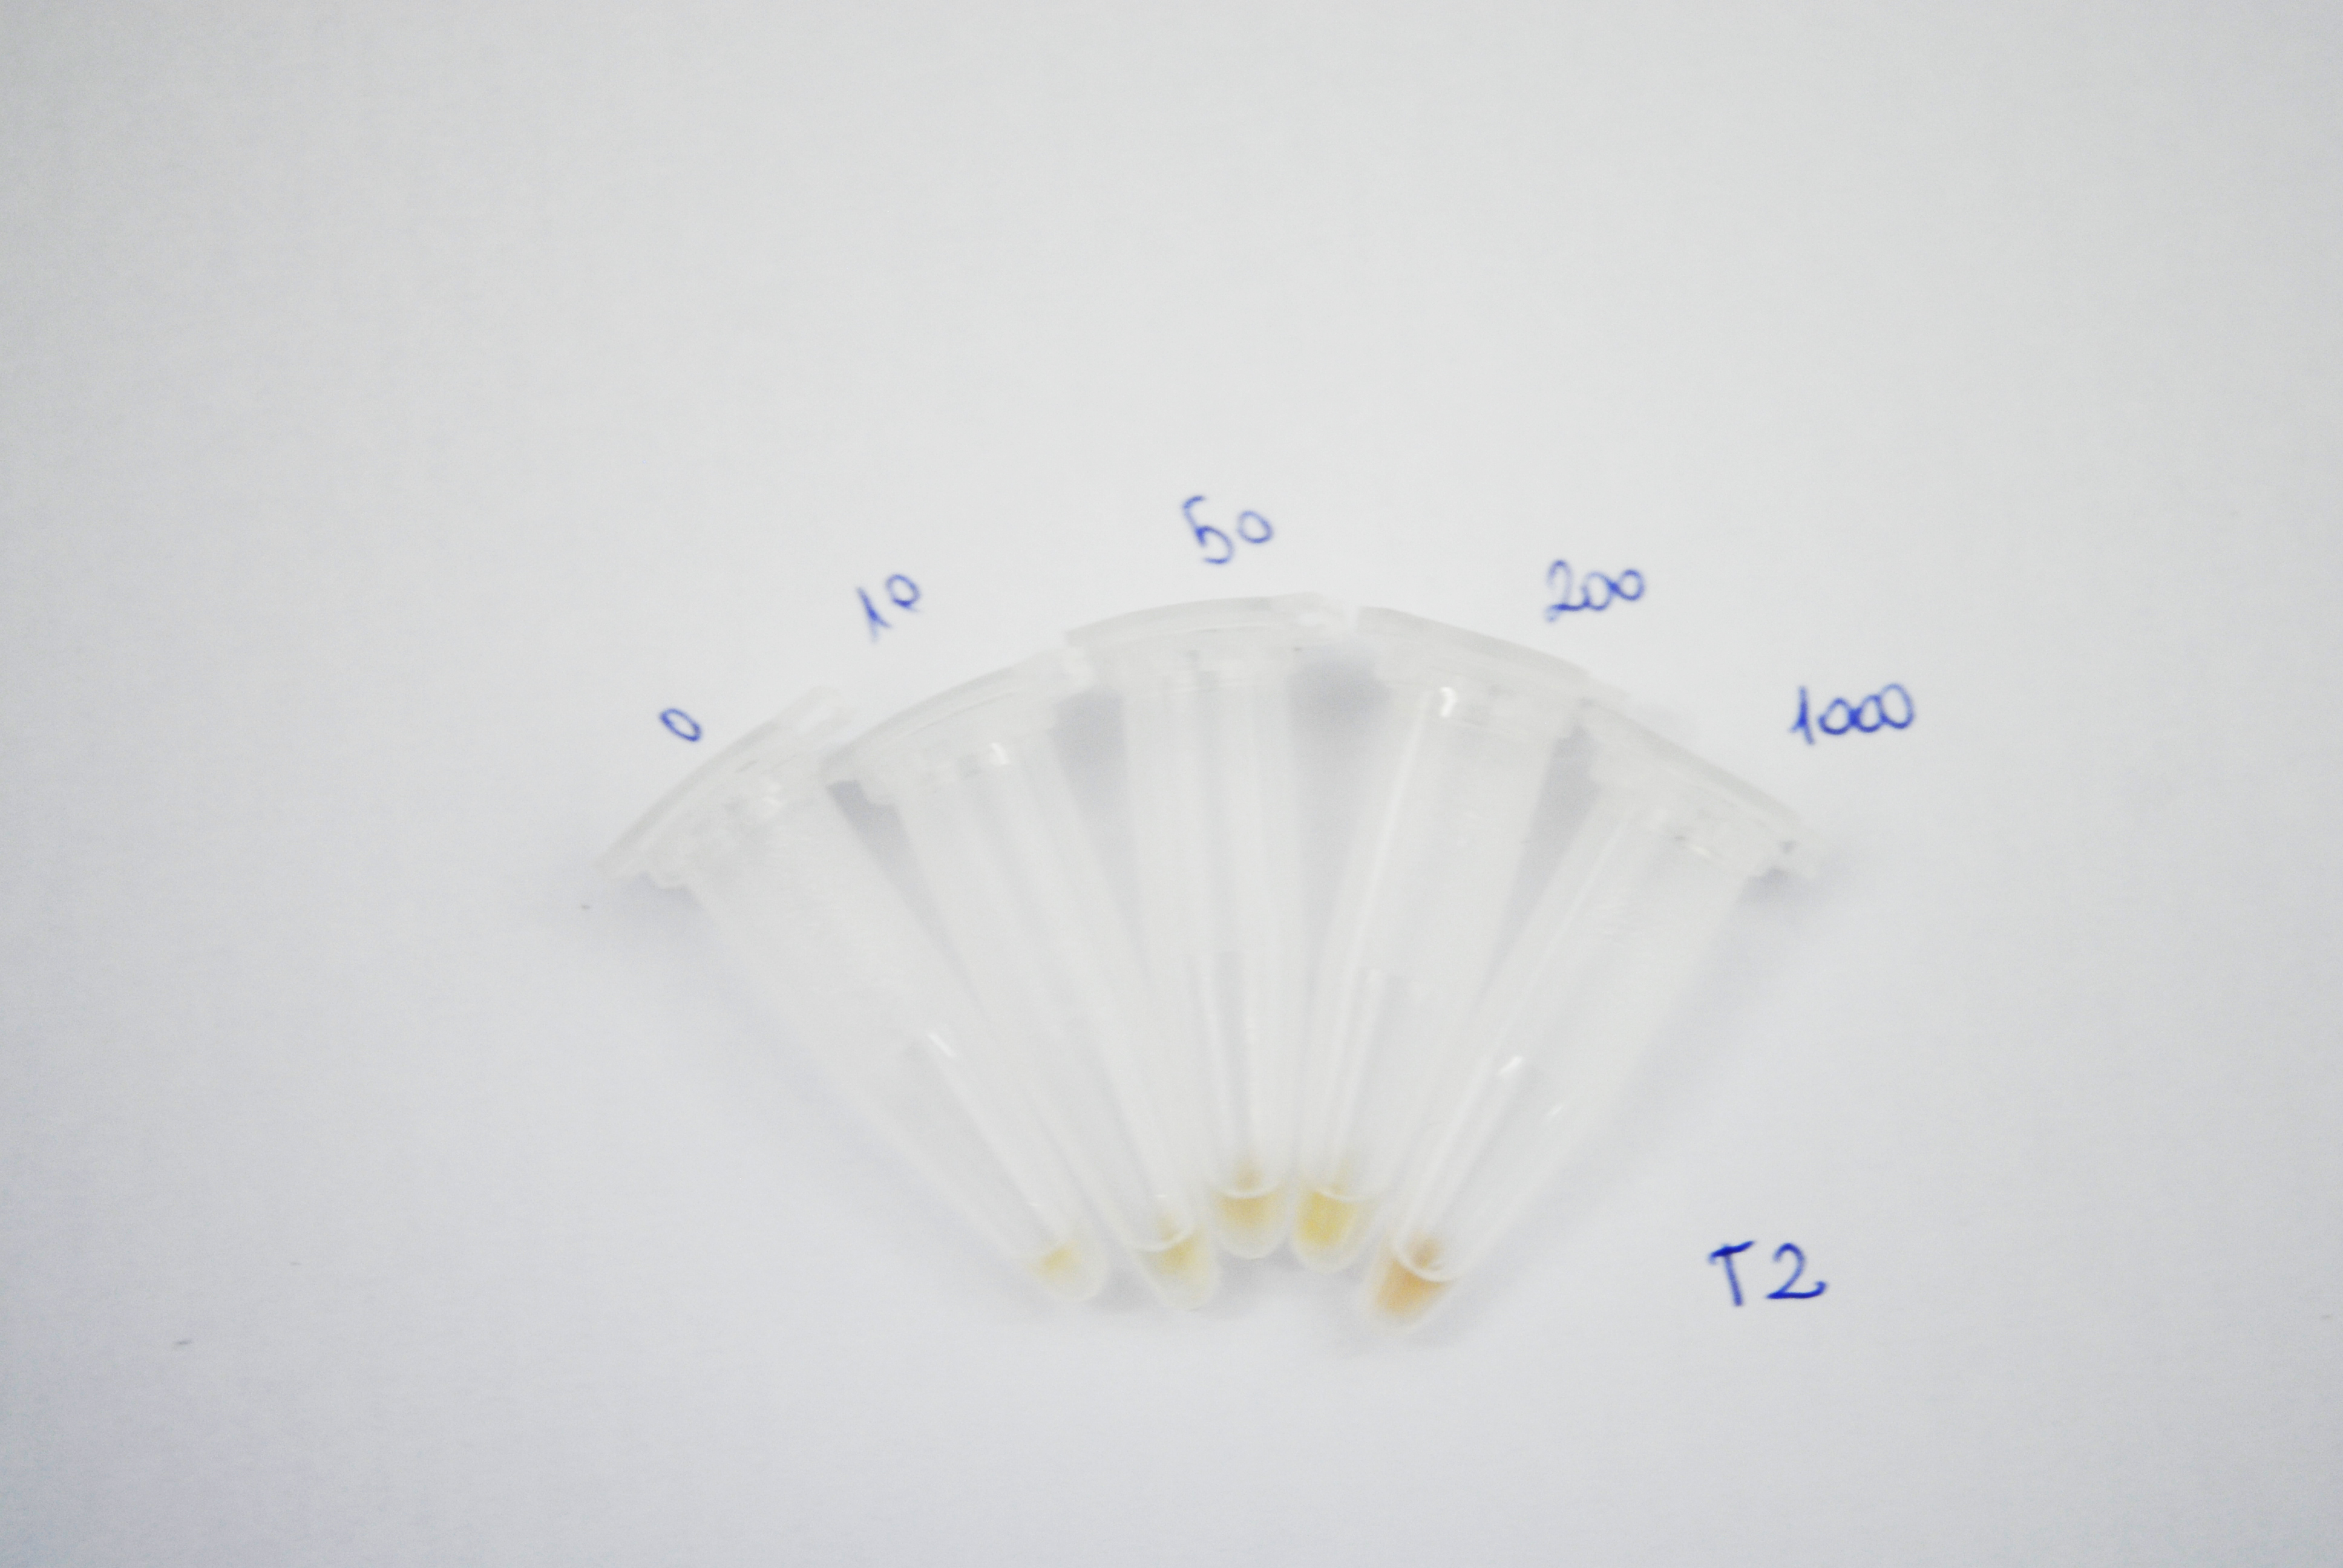
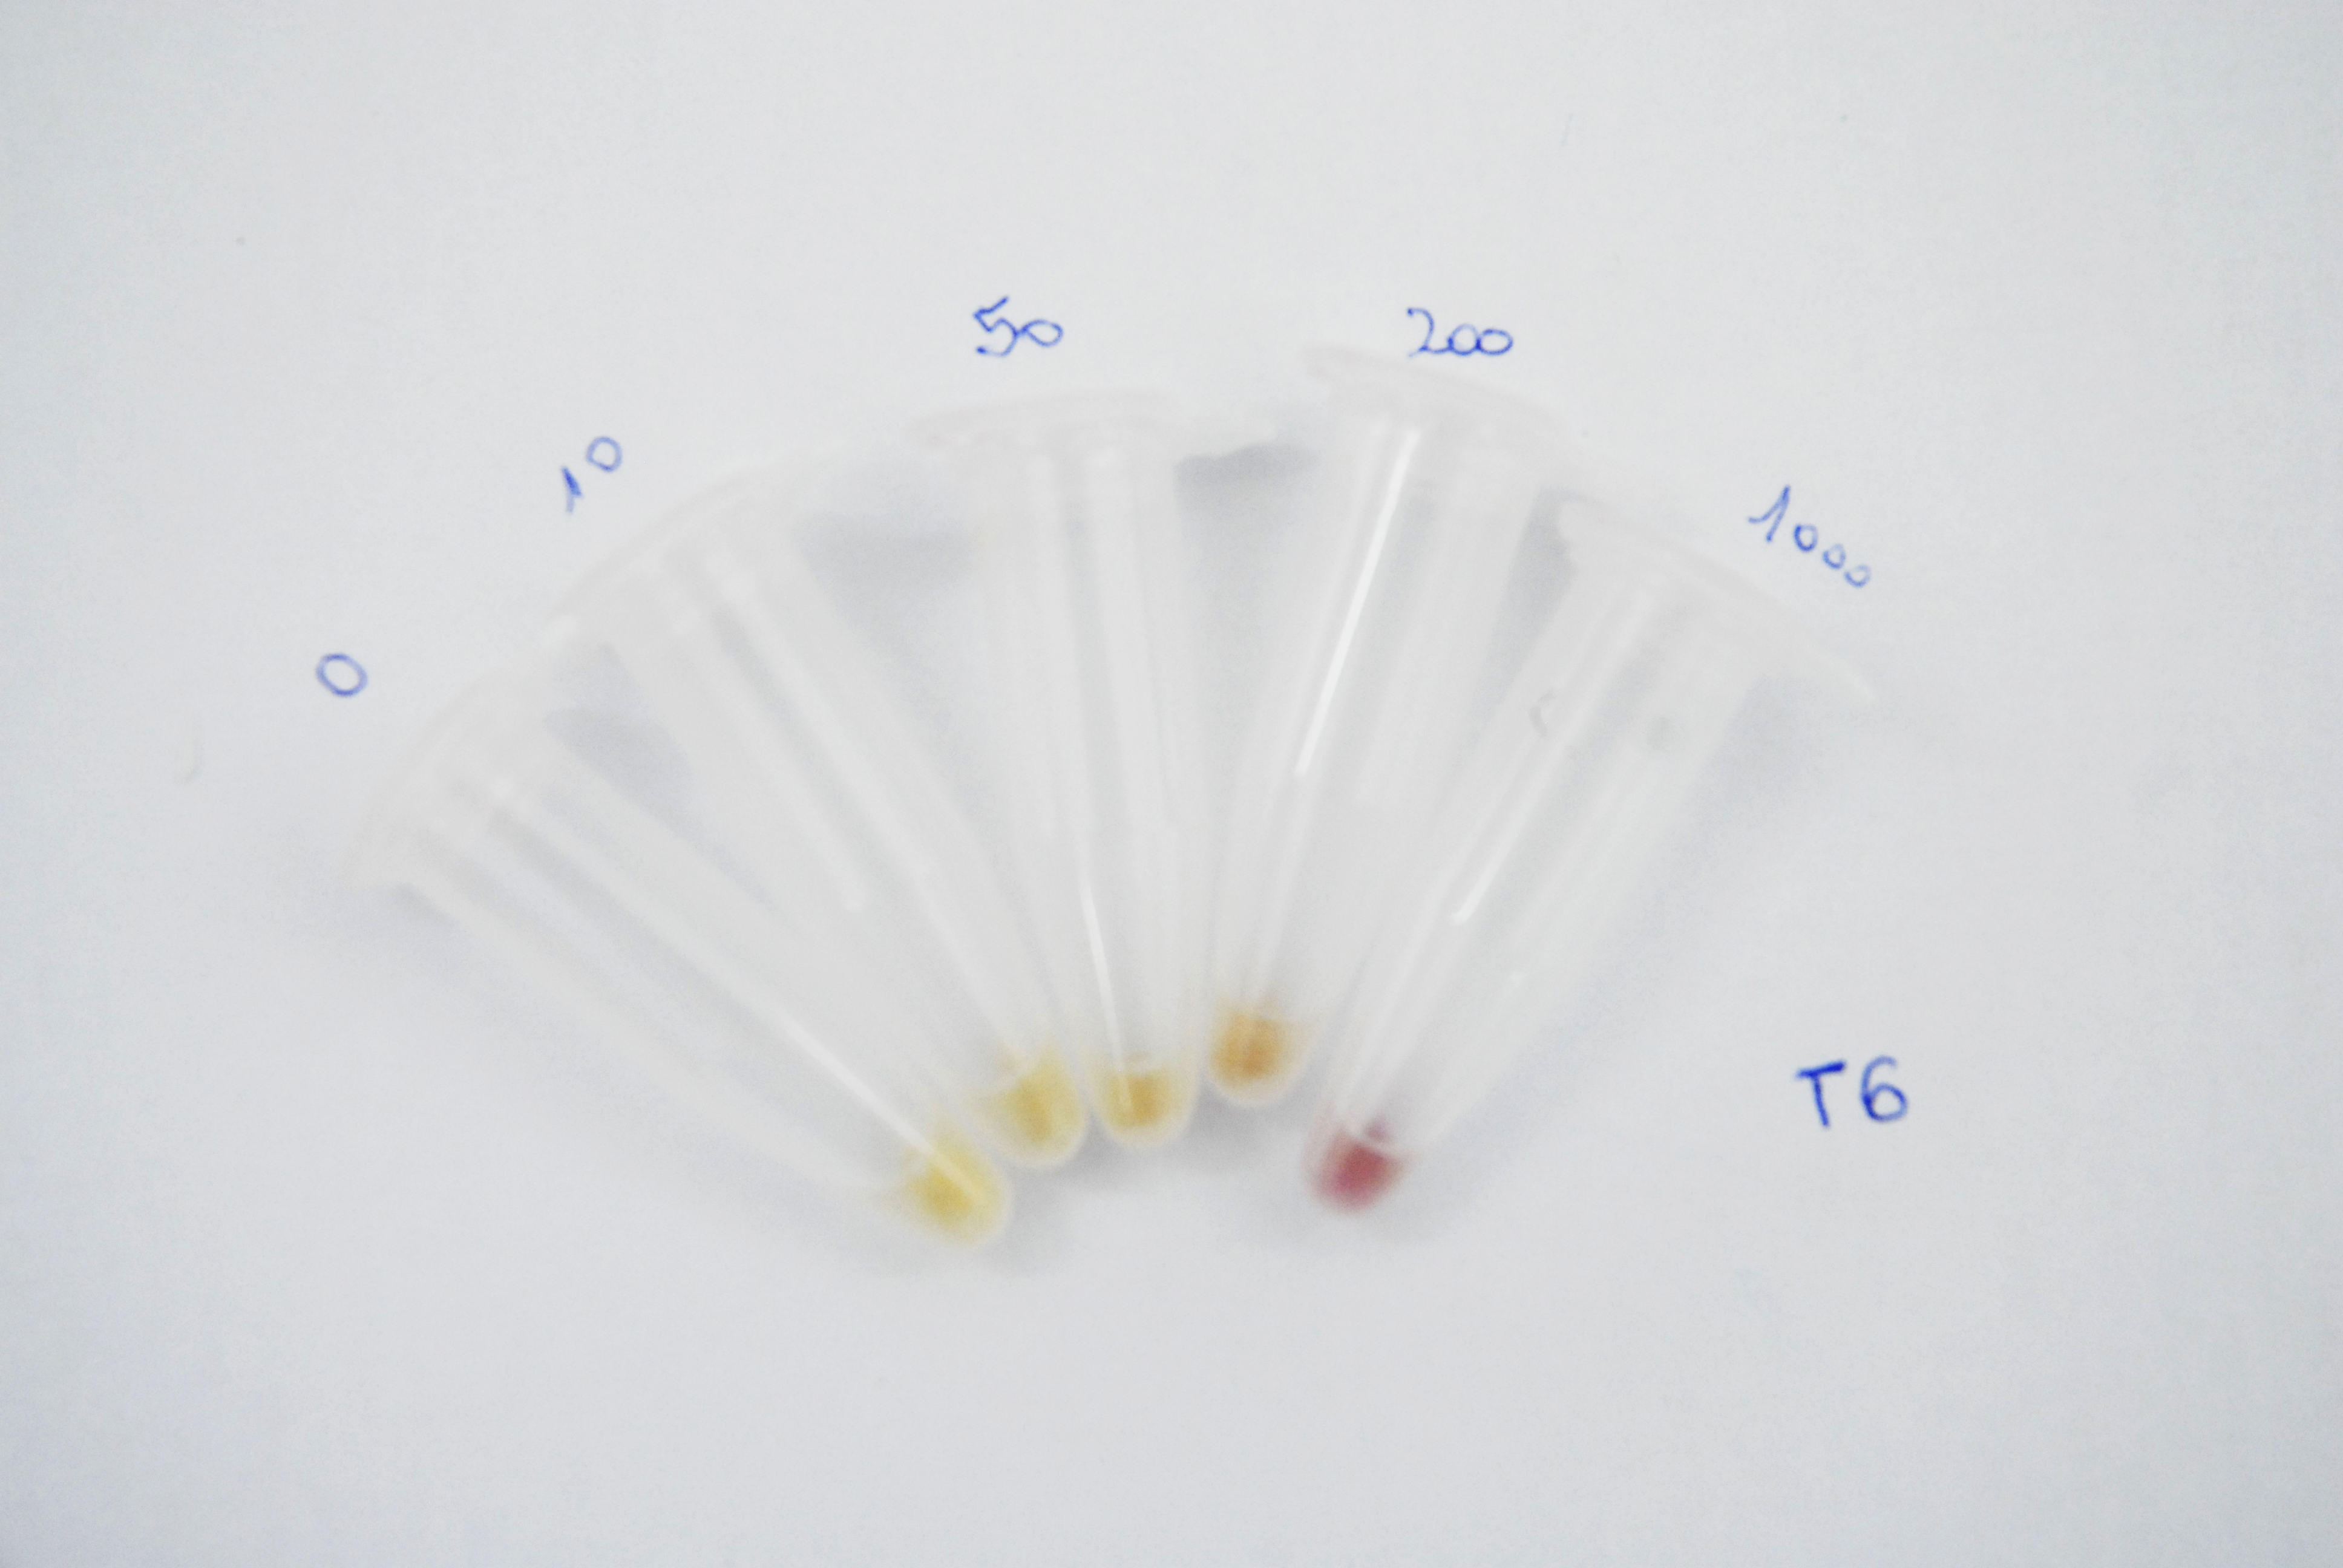
The objective of this assay is to figure out whether bacteria that get colored in the presence of arsenic, reach saturation over time when induced with different arsenite concentrations and if the colour intensity is distinguishable between each other at naked eye. To achieve this, E. Coli DH5alfa Bacteria harbouring a plasmid that encodes mRFP generator under arsenite promoter, were grown with different arsenite concentration ( 0, 10, 50, 200 and 1000ppb). 1ml aliquots were taken every 12 hours and were centrifuged at 10.000rpm for 5 minutes. Pictures of the pellets were taken in order to compare colour difference at naked eye. mRFP fluorescence was also measured with a fluorimeter at X nm for excitation and X nm for emission.
Results
As it can be seen in the pictures below, the colour production can be clearly distinguish between different arsenic concentrations after 24 hours of induction and between the higher arsenite concentrations only. It can also be noticed that over time the production grows and that after 62 hours time the difference between 200 and 1000ppb is not clear.
So, in order to accelerate the colour production and its quantity at lower arsenite concentrations but at the same time avoiding saturation in all the samples to keep the difference observable at naked eye we reached the conclusion that a signal amplification system has to be added but also with some switch to stop the production.
After 12 hours of induction:
After 24 hours of induction:
After 36 hours of induction:
After 48 hours of induction:
After 50 hours of induction:
After 62 hours of induction:
 "
"
