Team:DTU-Denmark/ToxicityExperiment
From 2013.igem.org
(→Description) |
|||
| Line 7: | Line 7: | ||
== Results == | == Results == | ||
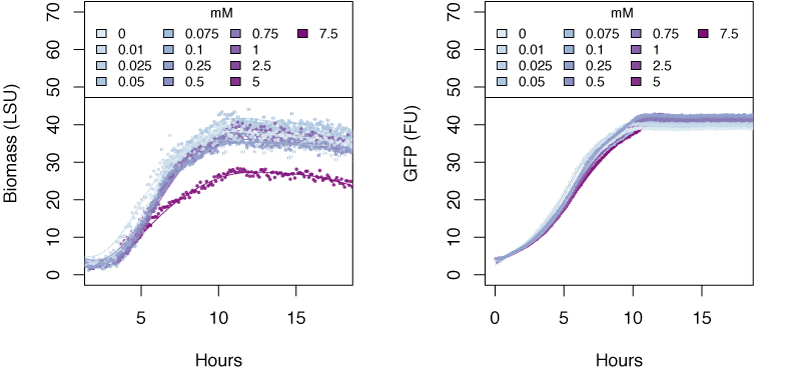
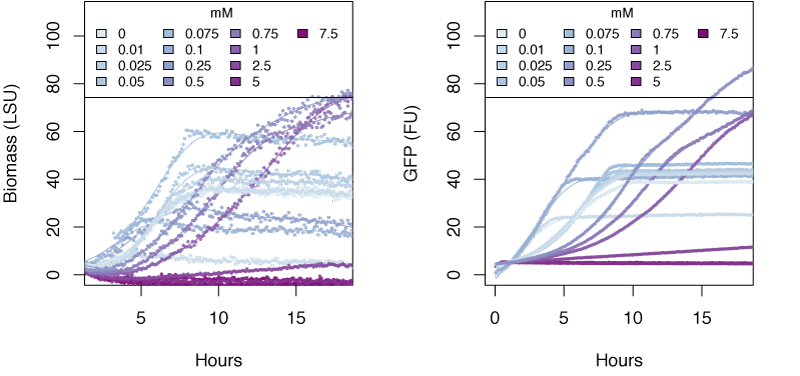
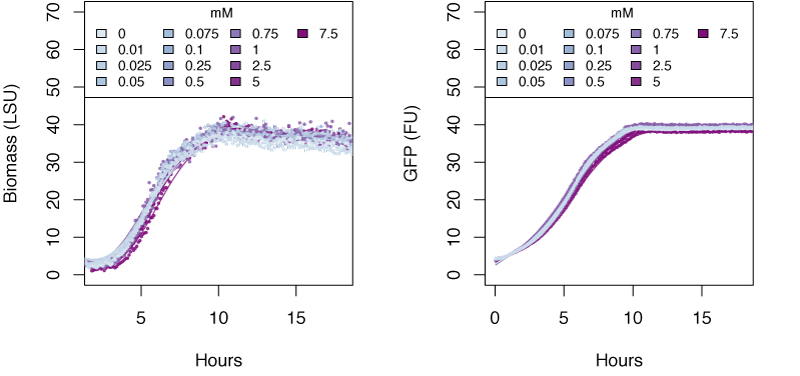
| - | + | The graphs in the following sections show the response in biomass and fluorescence of GFP over time for varying concentrations of each ion. The data has been baseline adjusted by using a script from Chris Workman (unpublished). The horizontal facets show concentrations in mM. | |
| - | + | ||
| - | + | ||
| - | + | ||
==== Ammonium ==== | ==== Ammonium ==== | ||
| - | |||
| - | |||
[[File:DTU-Denmark-Toxicity-Ammonium-parsed.png|600px]] | [[File:DTU-Denmark-Toxicity-Ammonium-parsed.png|600px]] | ||
| Line 28: | Line 23: | ||
== Conclusions == | == Conclusions == | ||
| - | + | Very high concentrations of ammonium >= 500 mM were able to inhibit growth of ''E. coli''. Nitrate at concentrations of 25mM and greater also inhibits growth of ''E. coli'', whereas concentrations of nitrate at 5mM and greater show delayed expression of GFP and slower growth. The tested concentrations of nitrite were not sufficient to inhibit growth. | |
| + | |||
| + | == Discussion == | ||
| + | The average concentration of ammonium in wastewater treatment plants is 70 mg/L (source: http://www.gnest.org/journal/Vol1_No1/Sotirakou.pdf), which is much less than the toxic threshold. If we assume the ammonia is stoichiometrically converted to nitrite via our mutants, the concentrations of nitrite that will be produced with this volume of ammonium will not be toxic to the cell. Therefore, we can expect that our transformants will survive in this environment. | ||
<div style="clear: both;"></div> | <div style="clear: both;"></div> | ||
{{:Team:DTU-Denmark/Templates/EndPage}} | {{:Team:DTU-Denmark/Templates/EndPage}} | ||
Revision as of 15:46, 28 September 2013
Toxicity Experiment
Contents |
Description
Determine whether the ions nitrite, nitrate and ammonium are toxic to E. coli, and at what concentration. This experiment will use the Biolector to grow an E. coli strain that constitutively expresses RFP in the presence of these ions (at a range of concentrations) to determine the OD and fluorescence of the cells as a proxy for growth.
Results
The graphs in the following sections show the response in biomass and fluorescence of GFP over time for varying concentrations of each ion. The data has been baseline adjusted by using a script from Chris Workman (unpublished). The horizontal facets show concentrations in mM.
Ammonium
Nitrate
Nitrite
Conclusions
Very high concentrations of ammonium >= 500 mM were able to inhibit growth of E. coli. Nitrate at concentrations of 25mM and greater also inhibits growth of E. coli, whereas concentrations of nitrate at 5mM and greater show delayed expression of GFP and slower growth. The tested concentrations of nitrite were not sufficient to inhibit growth.
Discussion
The average concentration of ammonium in wastewater treatment plants is 70 mg/L (source: http://www.gnest.org/journal/Vol1_No1/Sotirakou.pdf), which is much less than the toxic threshold. If we assume the ammonia is stoichiometrically converted to nitrite via our mutants, the concentrations of nitrite that will be produced with this volume of ammonium will not be toxic to the cell. Therefore, we can expect that our transformants will survive in this environment.
 "
"


