Team:DTU-Denmark/pBAD SPL
From 2013.igem.org
(Difference between revisions)
(→Summary) |
(→Data analysis) |
||
| Line 22: | Line 22: | ||
#* The growth rate, mu, was estimated to be 1.28 (from an average of all wells on all plates) since we expect each strain to grow at the same rate. | #* The growth rate, mu, was estimated to be 1.28 (from an average of all wells on all plates) since we expect each strain to grow at the same rate. | ||
#* A time window representing exponential growth was selected (between 1 and 4.5 hours). | #* A time window representing exponential growth was selected (between 1 and 4.5 hours). | ||
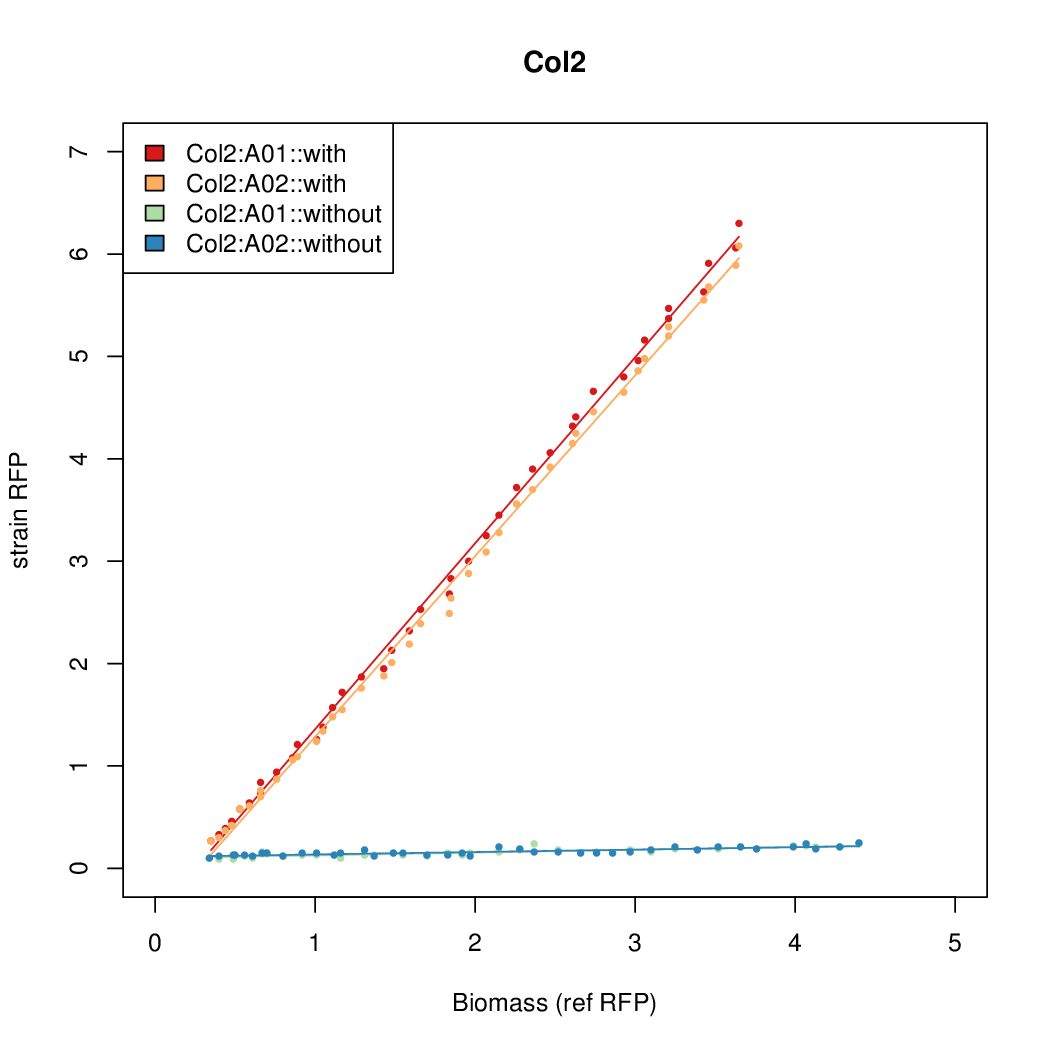
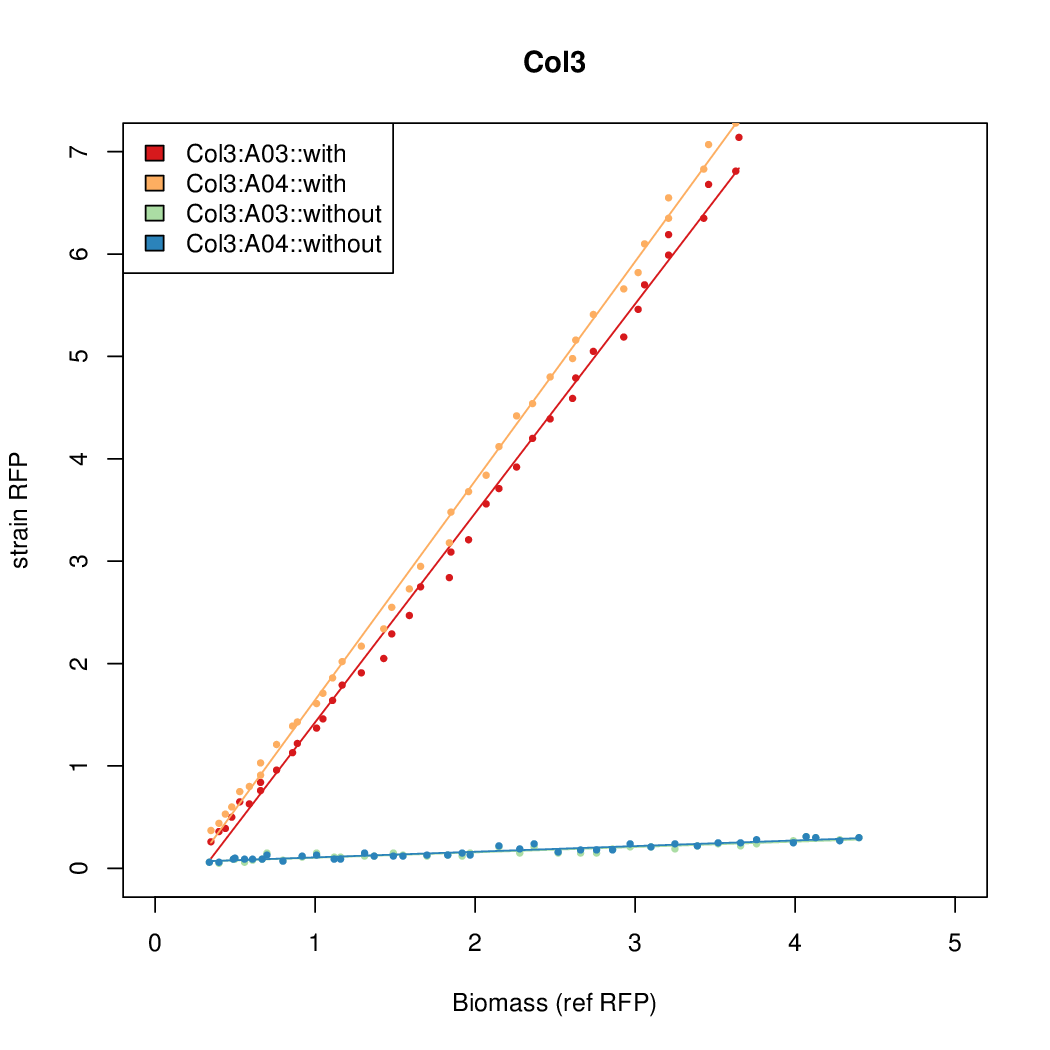
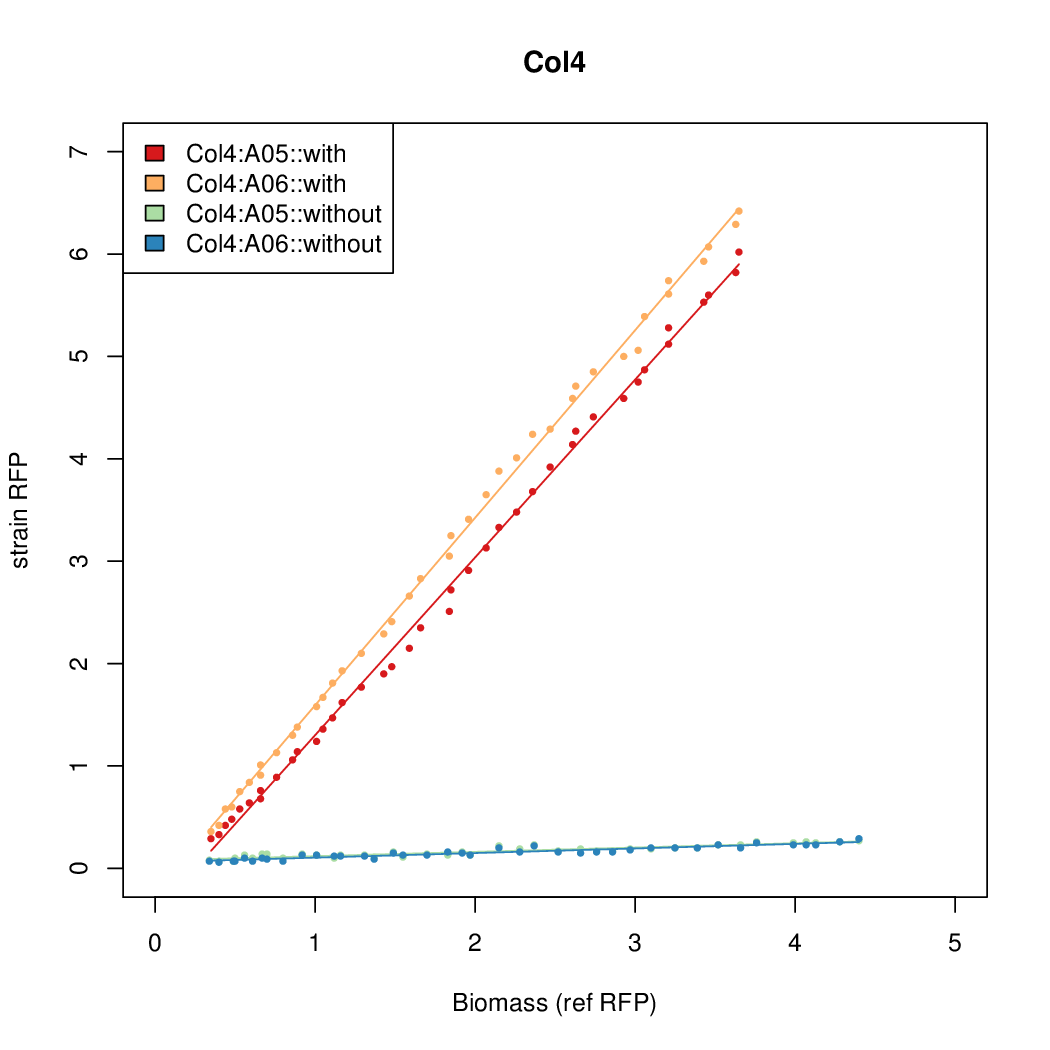
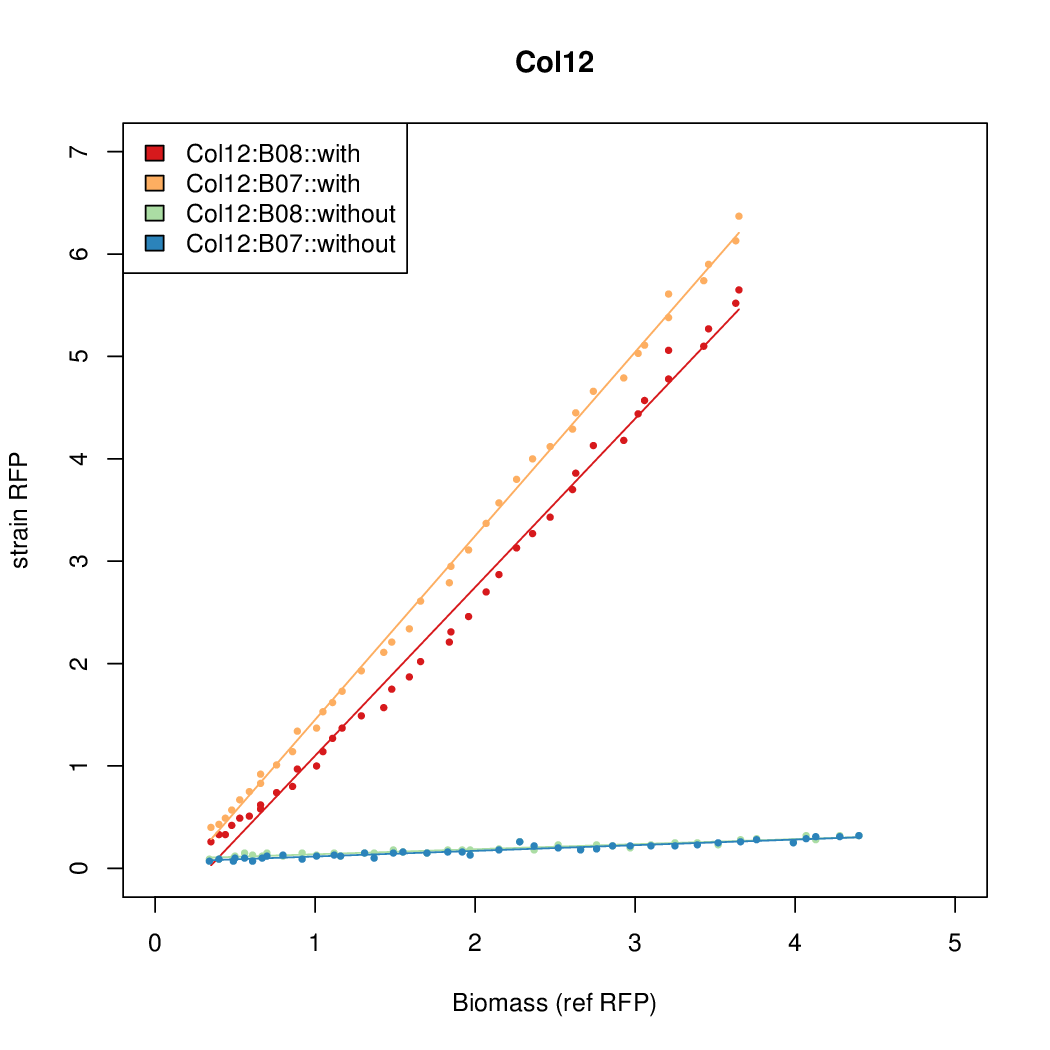
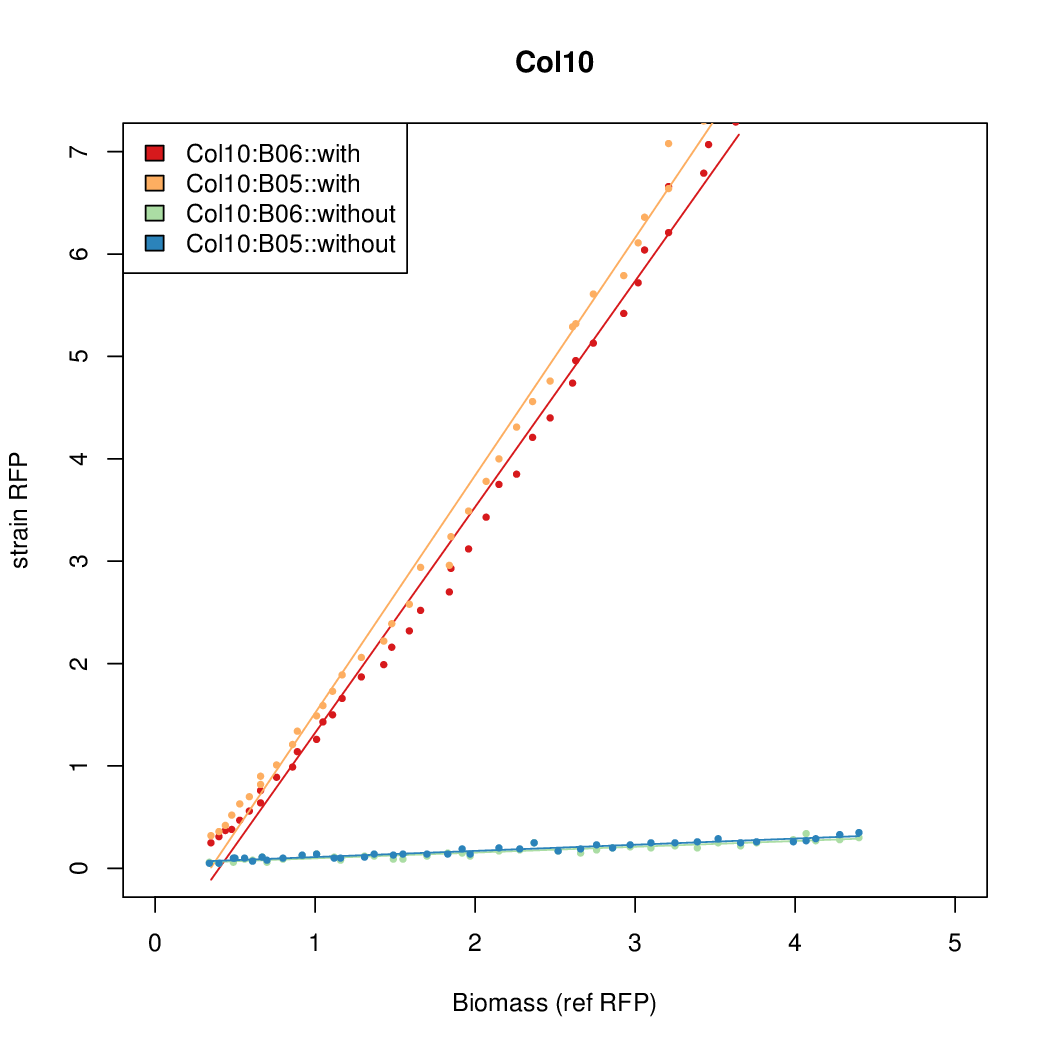
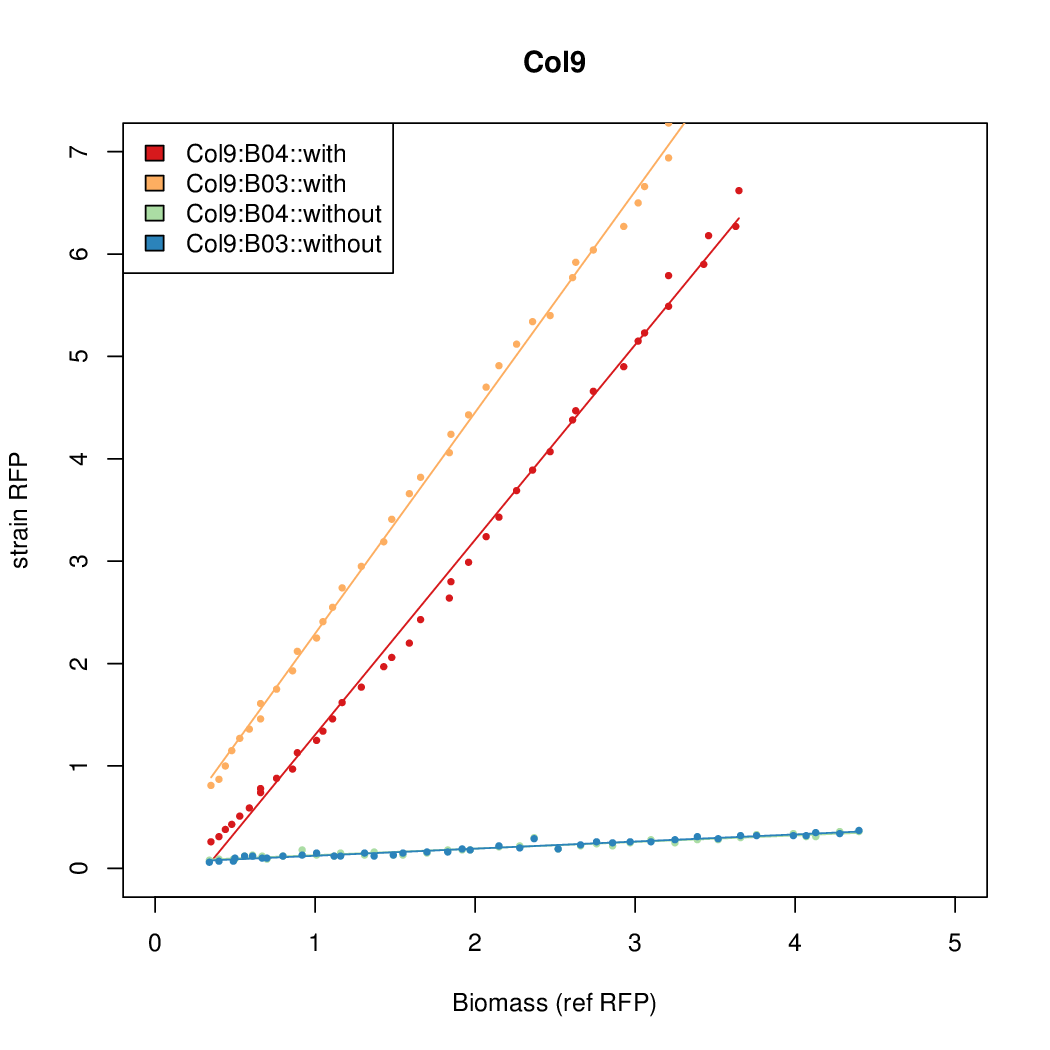
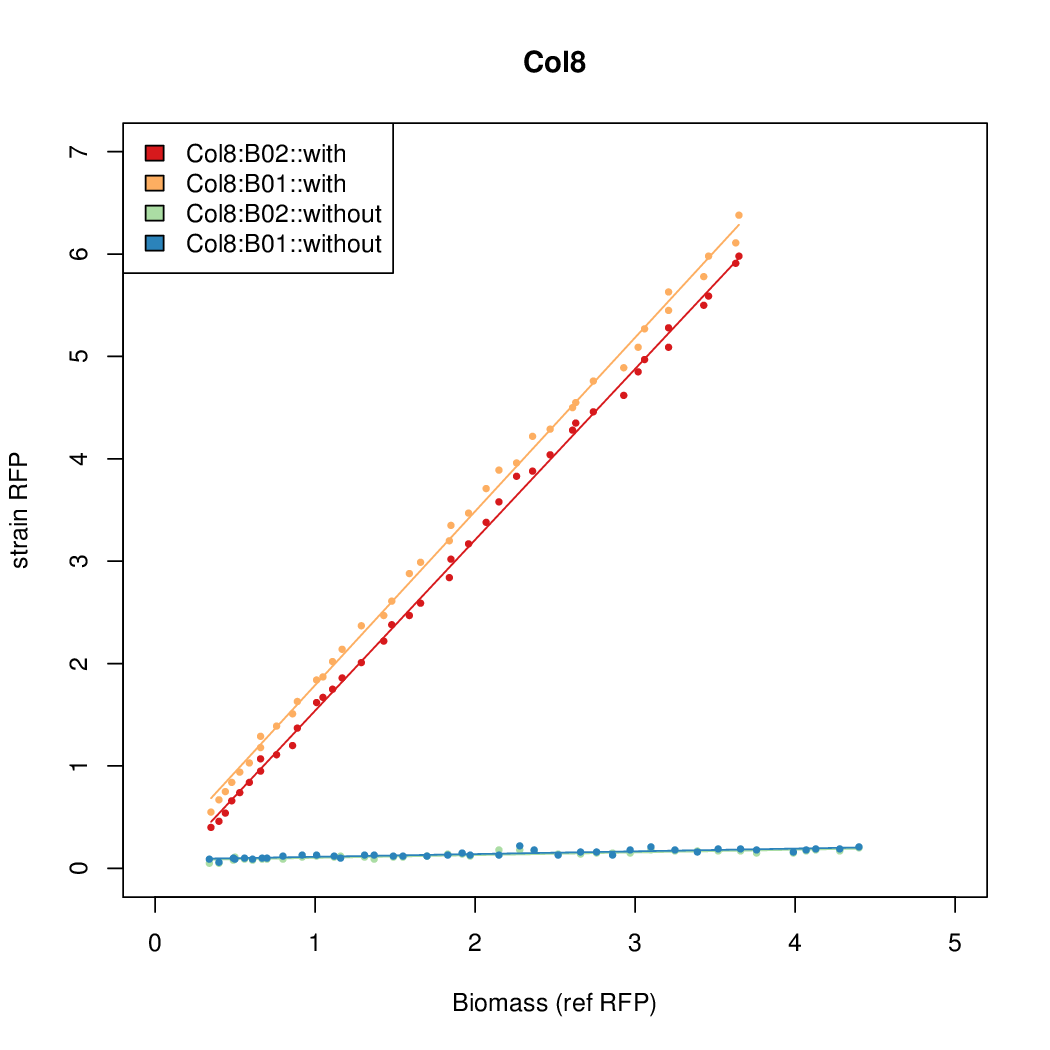
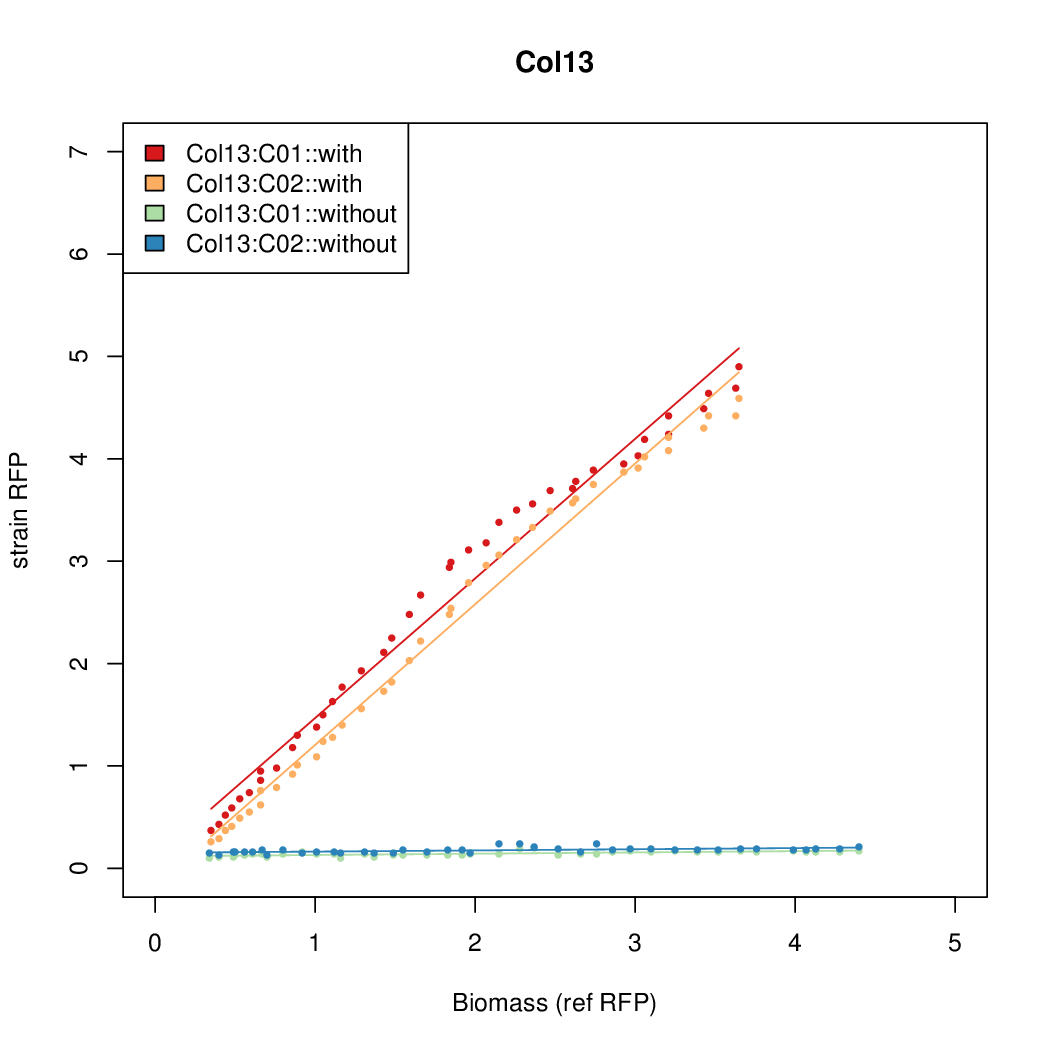
| - | # The RFP measurement for a constitutively expressed strain was used as a standard measure of growth. This is plotted on the x-axis in the | + | # The RFP measurement for a constitutively expressed strain was used as a standard measure of growth. This is plotted on the x-axis in the detailed plots per colony below. |
# Figures were plotted using R. | # Figures were plotted using R. | ||
Revision as of 08:13, 1 October 2013
pBAD SPL
Contents |
pBAD synthetic promoter library
As a tool for expressing lethal proteins in E. coli we made a synthetic promoter library (SPL, [http://dspace.mit.edu/handle/1721.1/60080 RFC 63]) with the pBAD arabinose inducible promoter. The concept was taken from the DTU iGEM team from 2010.
Methods
Experimental procedure
- Random promoter sequences were ordered matching the sequence CTGACGNNNNNNNNNNNNNNNNNNTAWWATNNNNA.
- USER cloning to add RFP downstream of promoter.
- Colonies were plated.
- Colonies that were not red prior to induction with arabinose but that did turn red after induction with arabinose were selected.
- Wells were inoculated from overnight cultures of each of the selected colonies
- One plate was run with arabinose, and another plate was run without arabinose.
Data analysis
- Data was collected from the Biolector, and analyzed using a series of R scripts written by Chris Workman (unpublished).
- The maturation and degradation times for mCherry were both assumed to be 40 min. TODOref
- The growth rate, mu, was estimated to be 1.28 (from an average of all wells on all plates) since we expect each strain to grow at the same rate.
- A time window representing exponential growth was selected (between 1 and 4.5 hours).
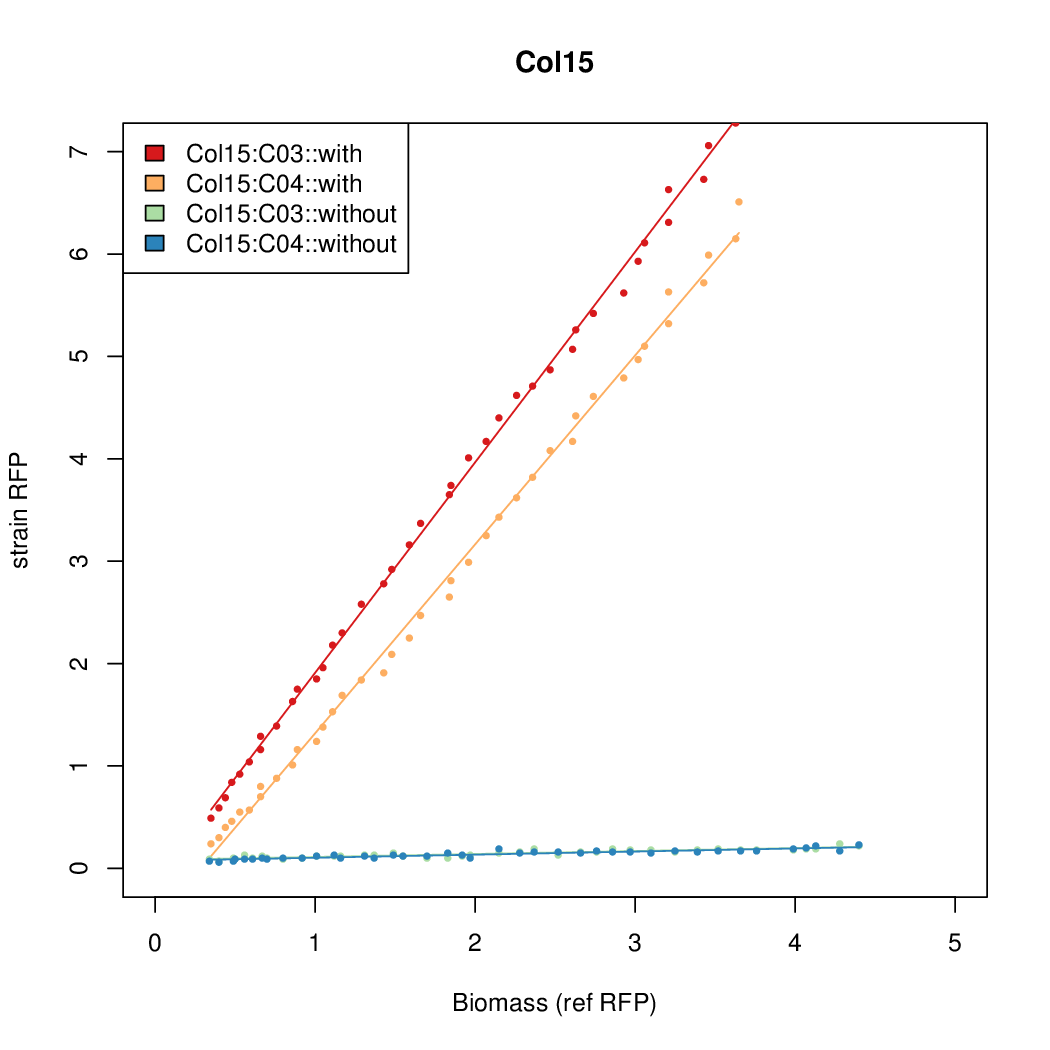
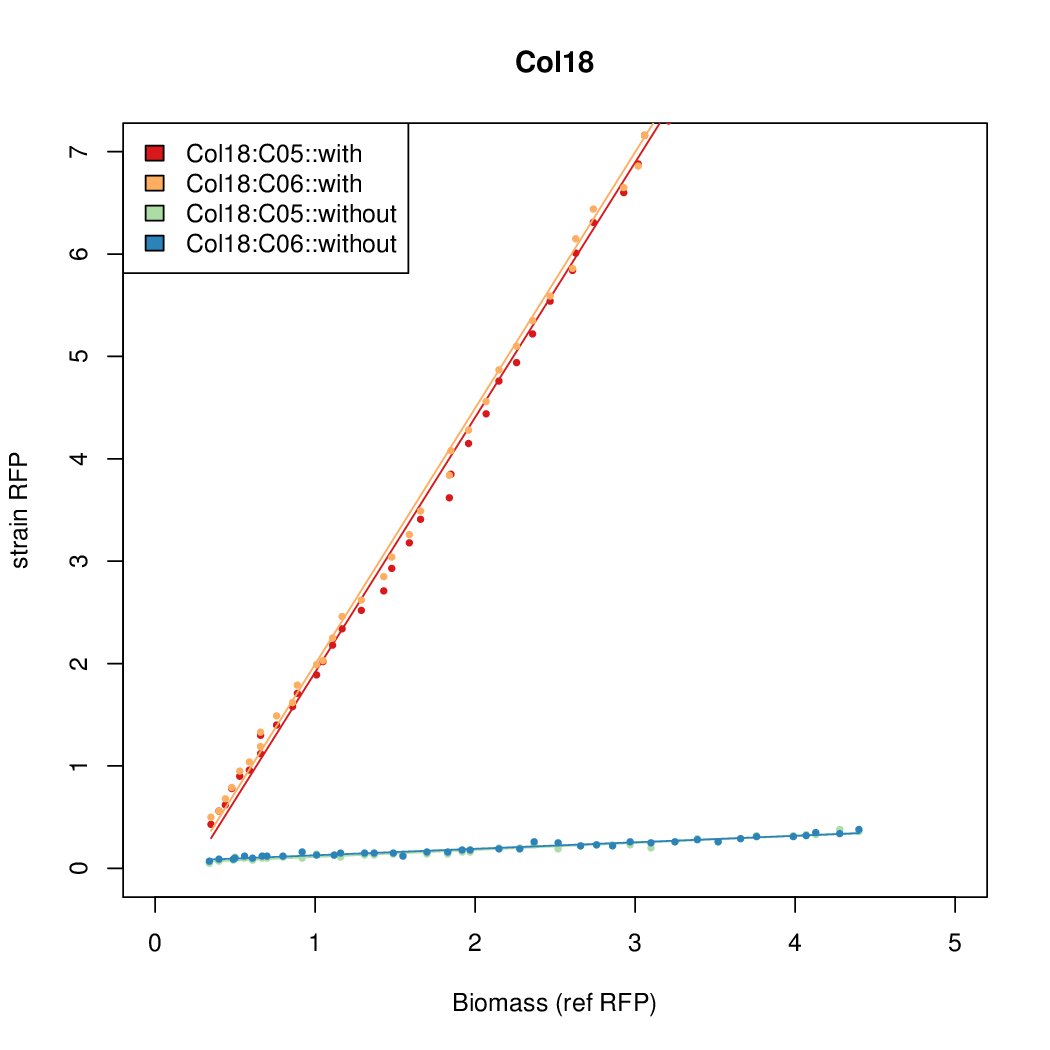
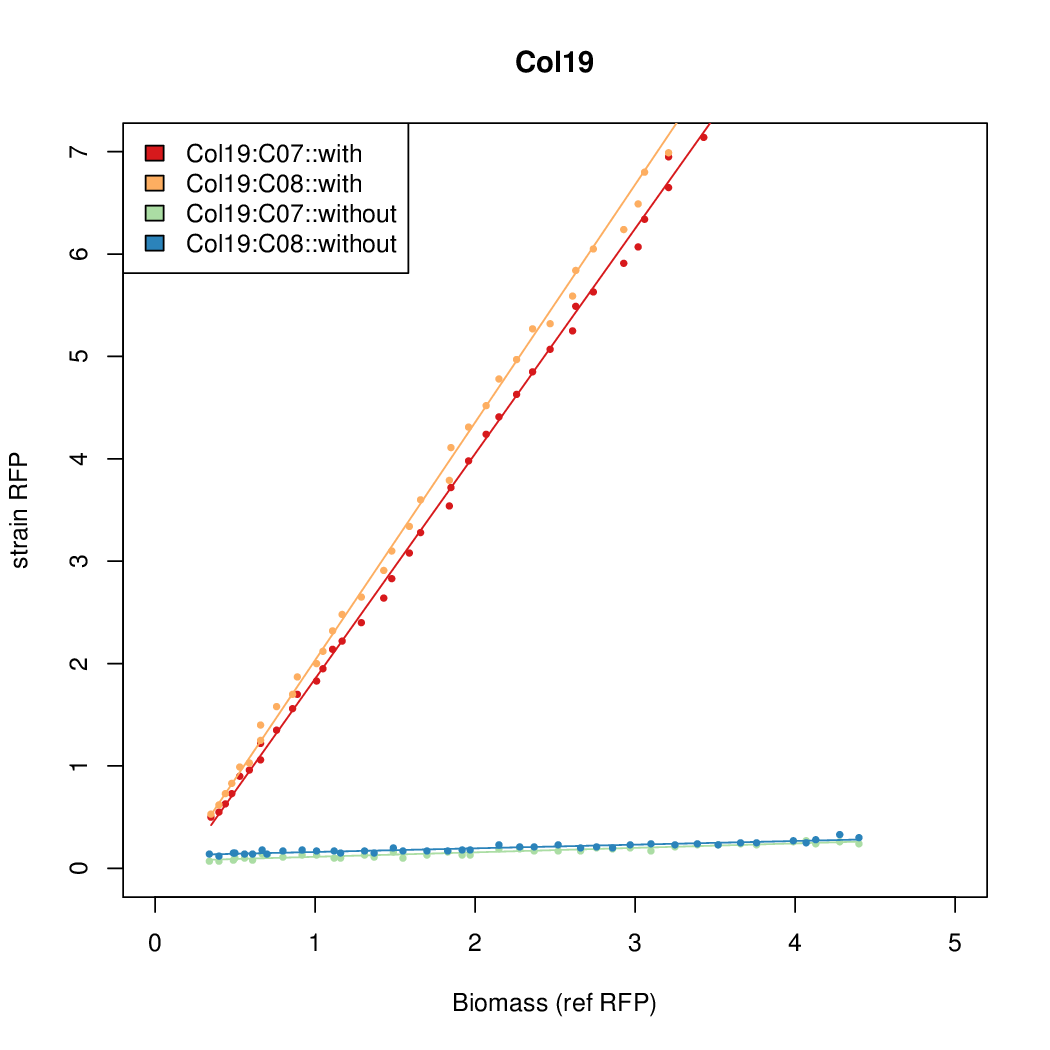
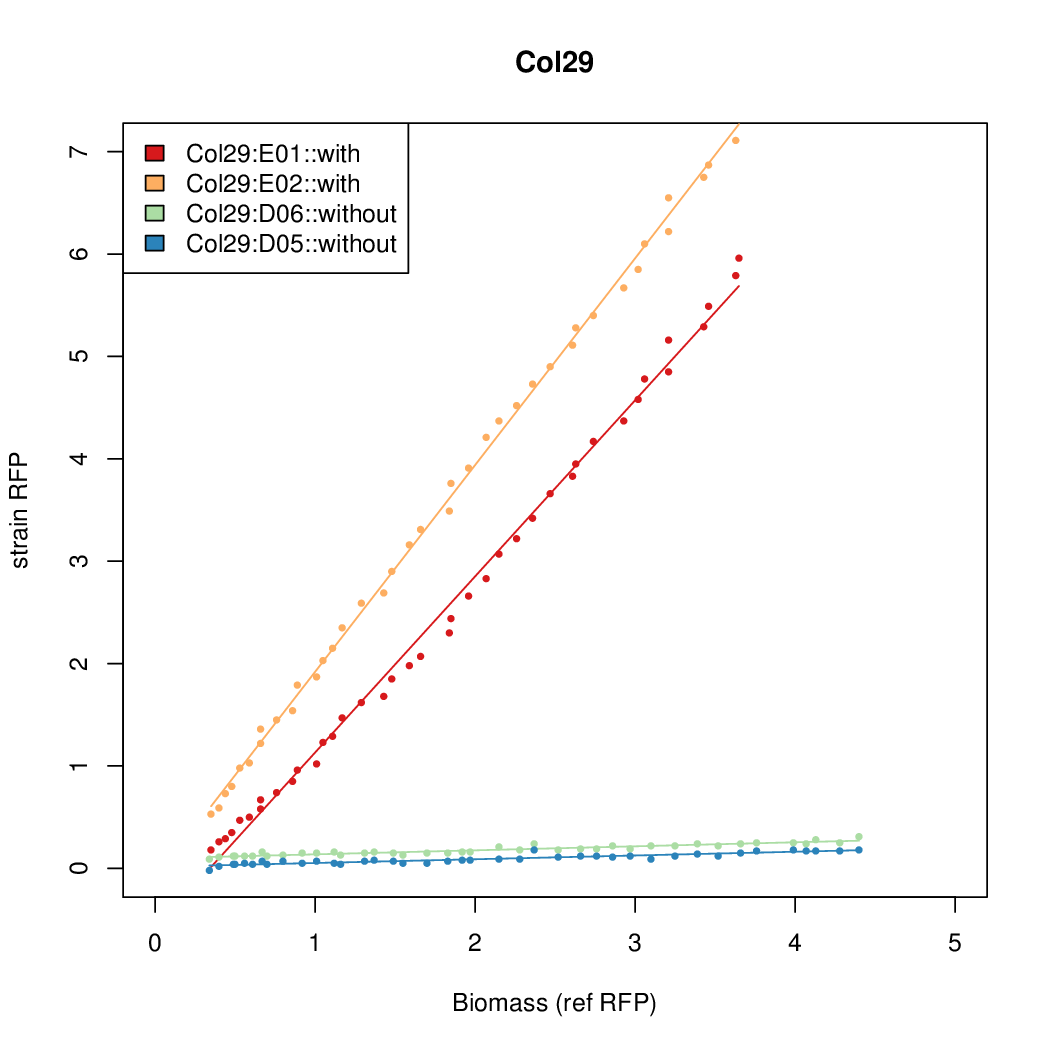
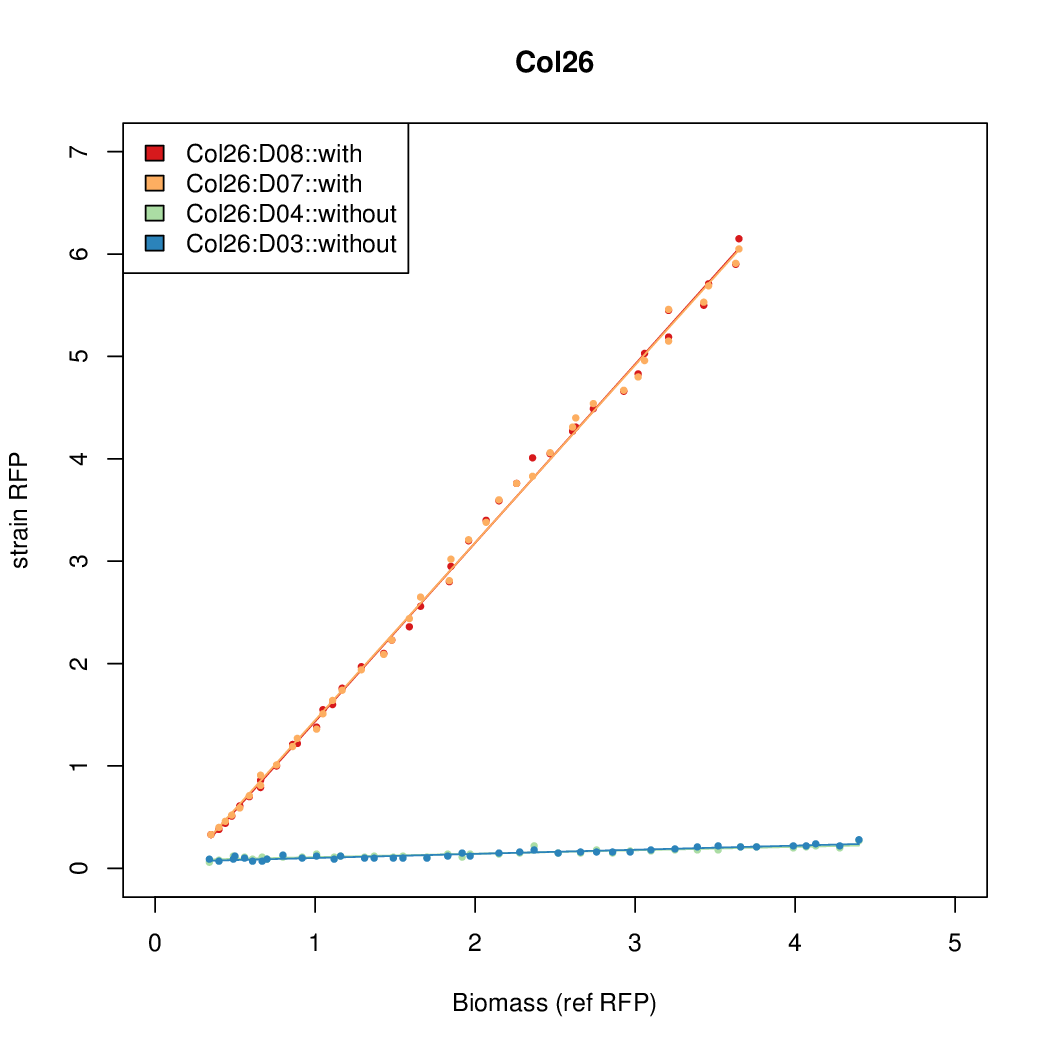
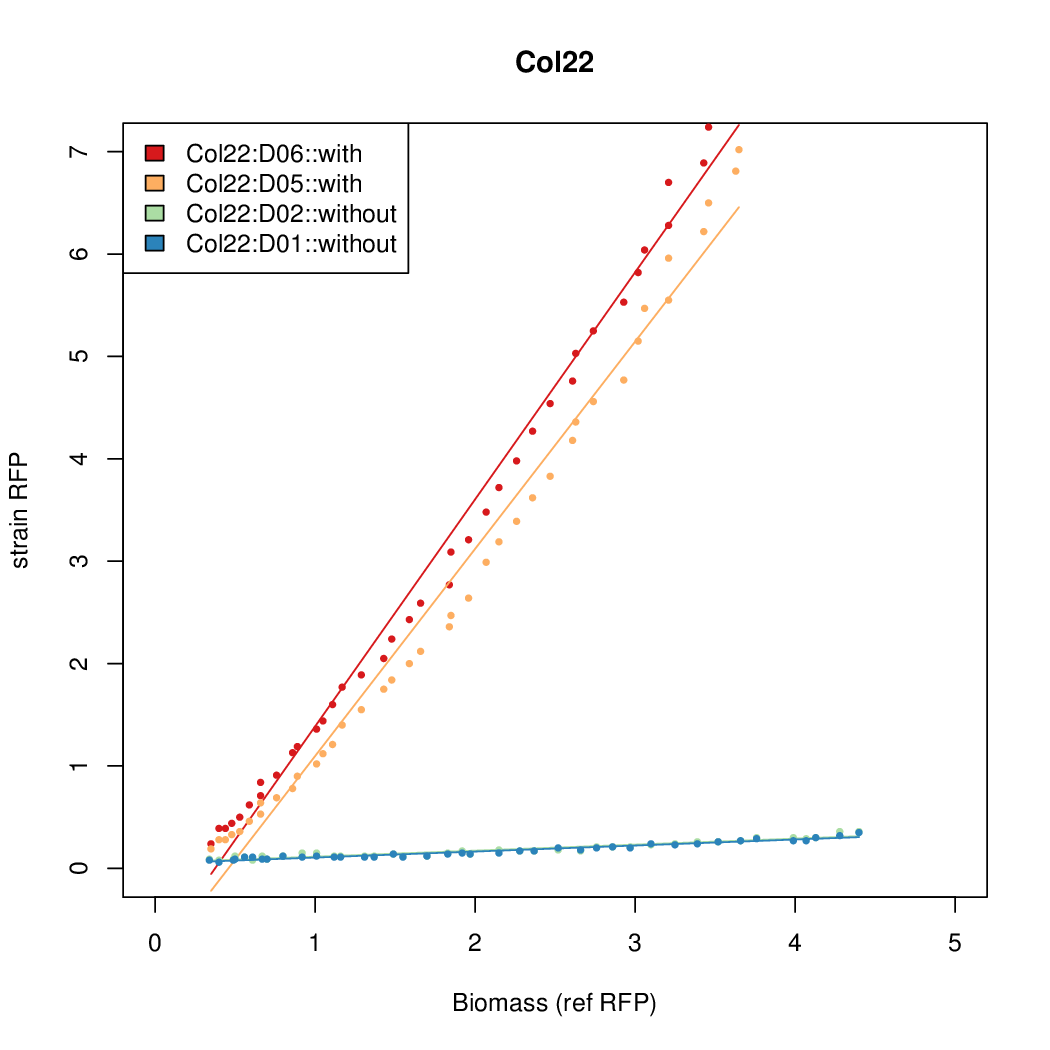
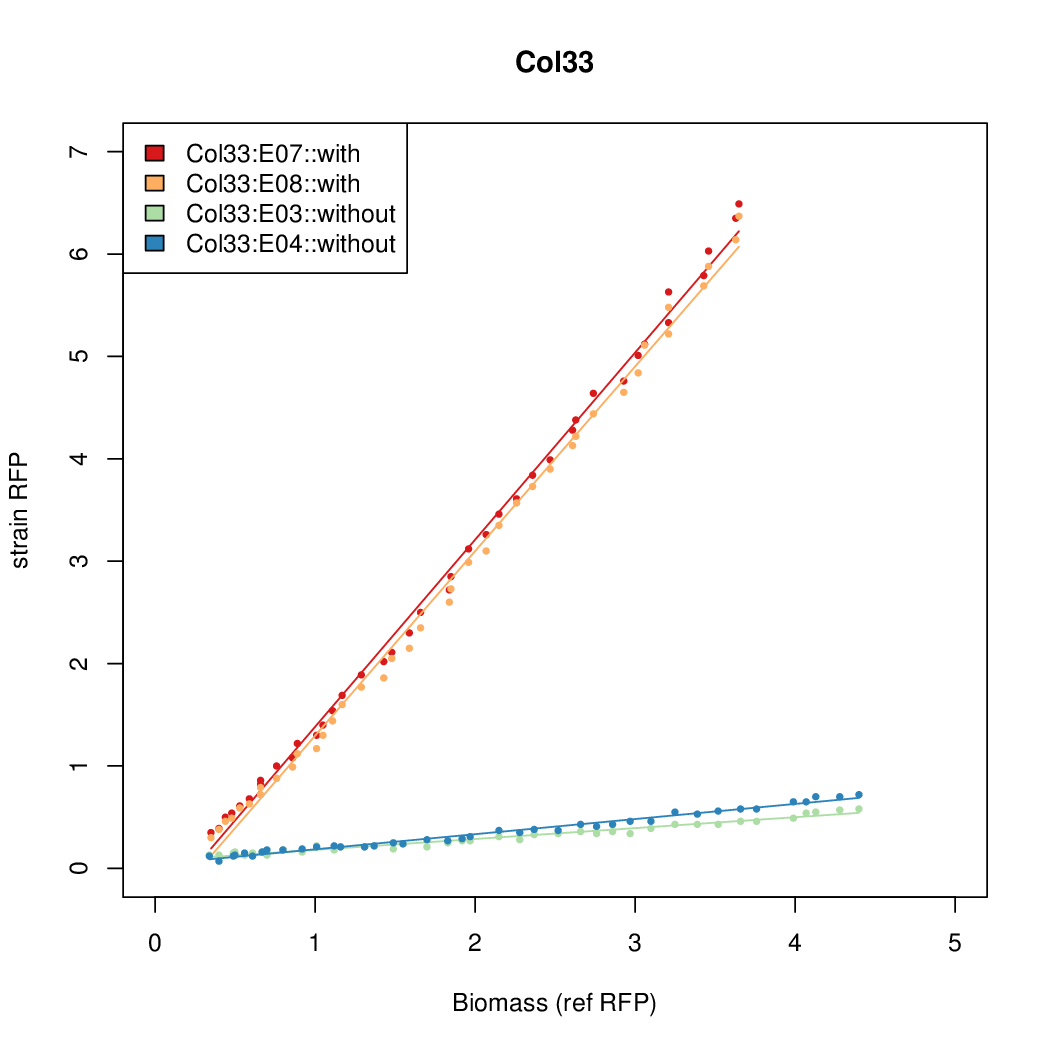
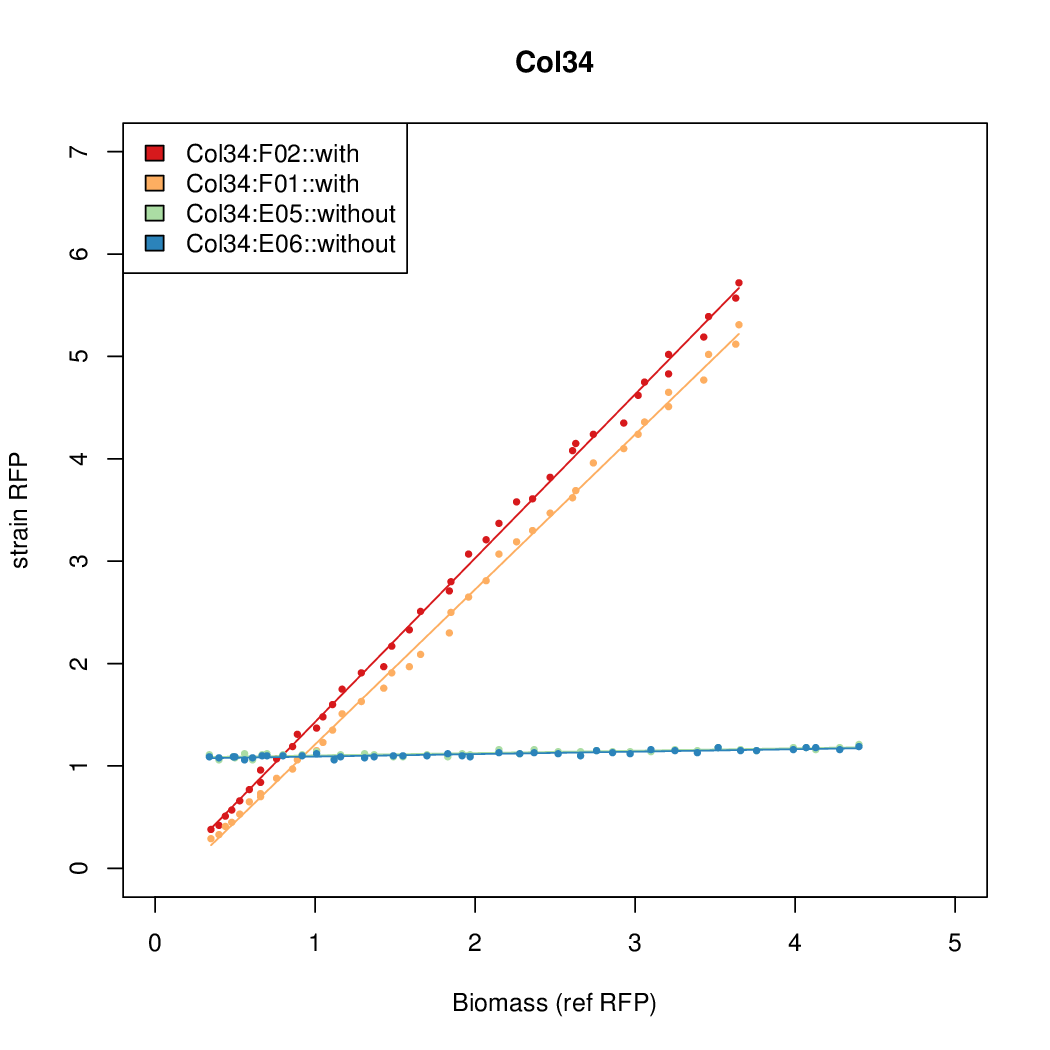
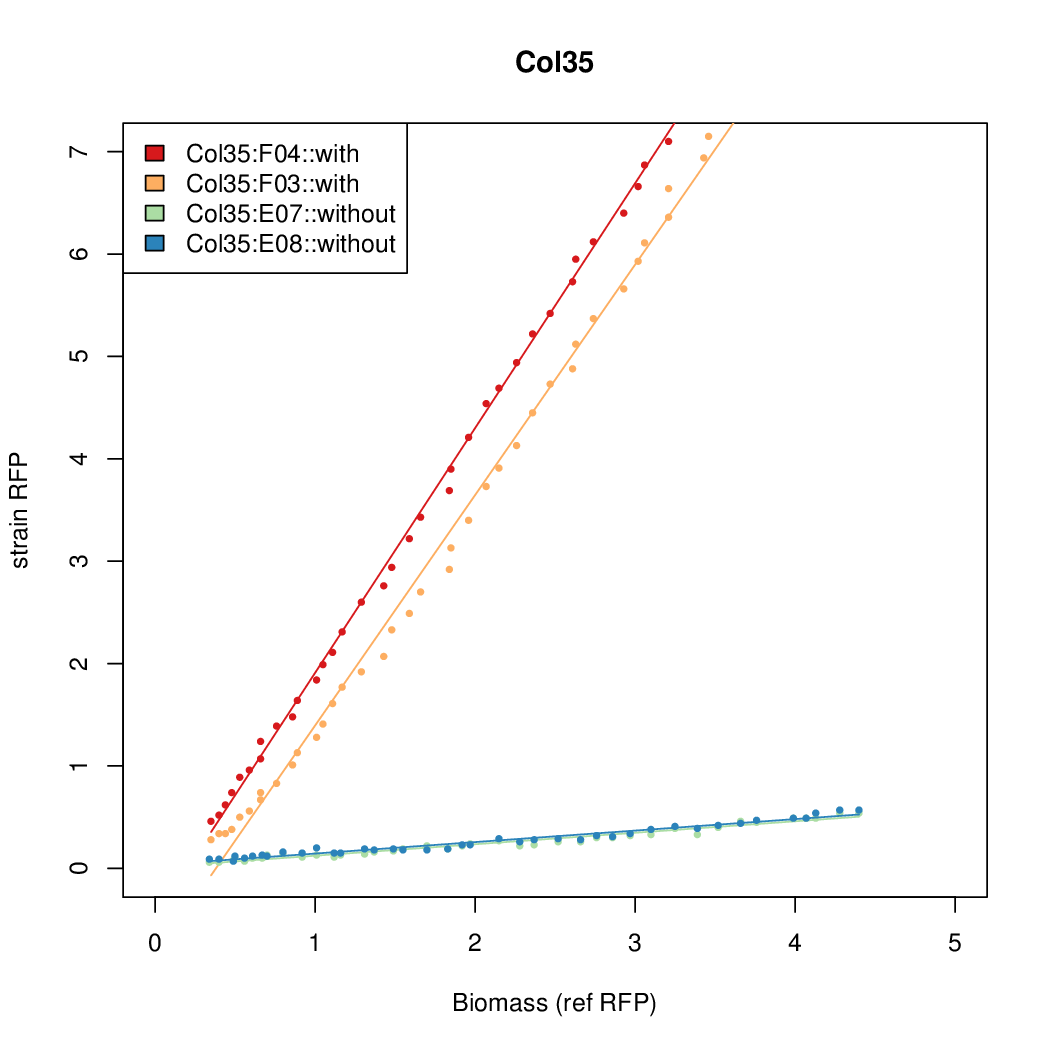
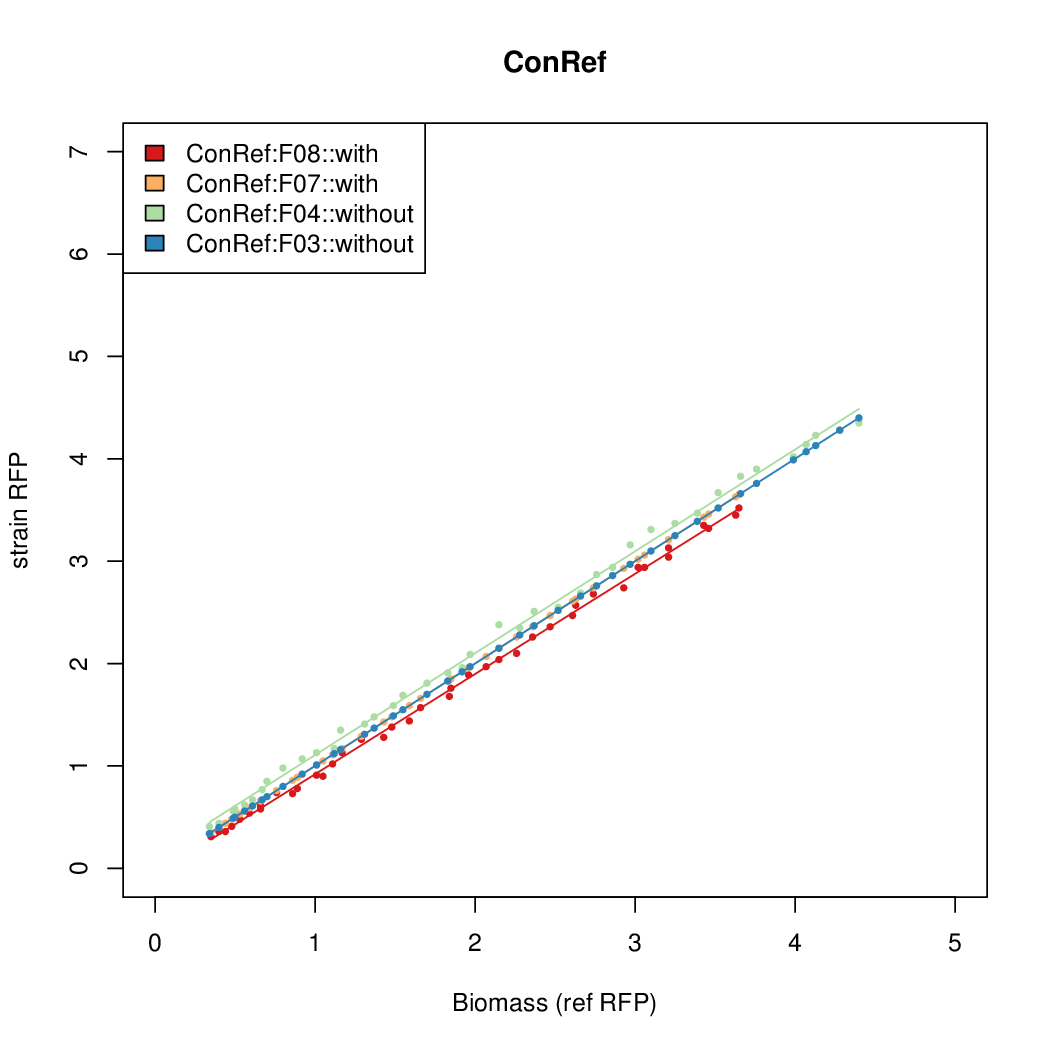
- The RFP measurement for a constitutively expressed strain was used as a standard measure of growth. This is plotted on the x-axis in the detailed plots per colony below.
- Figures were plotted using R.
Results
Summary
Details
Example of use
See also "Hello World project".
 "
"

