Team:Buenos Aires/ resqrfp
From 2013.igem.org
(→measure of groundwater samples with pars_mRFP) |
(→measure of groundwater samples with pars_mRFP) |
||
| Line 32: | Line 32: | ||
</html> | </html> | ||
| - | == | + | ==Measurement of groundwater samples with pars_mRFP== |
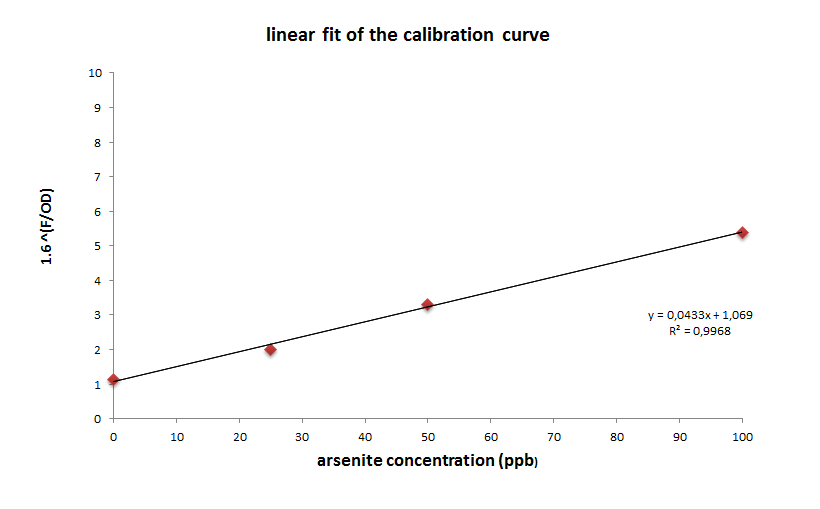
Using the experiment above as a calibration curve, we calculated the concentration of arsenite in groundwater samples. To achieve that, we first had to linearize the curve. As the curve seems to fit a logarithmic function, we aplied a logarithmic transformation to the original data, setting 1,6 as the base and the value of fluorescence at 608 nm/OD as the exponent. This way, we got a good linear fit, and used the function obtained to estimate arsenite concentration from values of fluorescence at 608 nm/OD. | Using the experiment above as a calibration curve, we calculated the concentration of arsenite in groundwater samples. To achieve that, we first had to linearize the curve. As the curve seems to fit a logarithmic function, we aplied a logarithmic transformation to the original data, setting 1,6 as the base and the value of fluorescence at 608 nm/OD as the exponent. This way, we got a good linear fit, and used the function obtained to estimate arsenite concentration from values of fluorescence at 608 nm/OD. | ||
Revision as of 02:19, 28 October 2013
mRFP under Arsenite Inducible Promoter ([http://parts.igem.org/Part:BBa_K1106003 Bba_K1106003]) characterization
Objective
Asess mRFP production, stability and naked eye discernibility range under inducible conditions.
General procedure
Different assays were performed using E. coli (DH5α strain) harbouring a plasmid that encodes mRFP under arsenite inducible promoter (ArsRFP culture).
mRFP production at different arsenite concentrations
Method
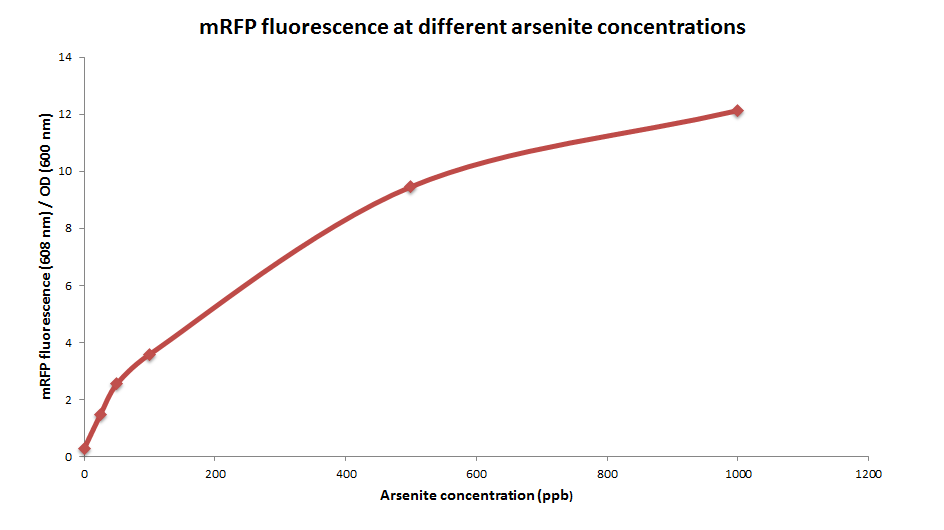
ArsRFP cultures were grown with different arsenite concentrations ( 0, 25, 50, 100, 500 and 1000ppb). 1ml aliquots were taken after 24 hours and fluorescence was measured.
Results
mRFP fluorescence increases with higher arsenite concentrations, in a sigmoidal way.
Measurement of groundwater samples with pars_mRFP
Using the experiment above as a calibration curve, we calculated the concentration of arsenite in groundwater samples. To achieve that, we first had to linearize the curve. As the curve seems to fit a logarithmic function, we aplied a logarithmic transformation to the original data, setting 1,6 as the base and the value of fluorescence at 608 nm/OD as the exponent. This way, we got a good linear fit, and used the function obtained to estimate arsenite concentration from values of fluorescence at 608 nm/OD.
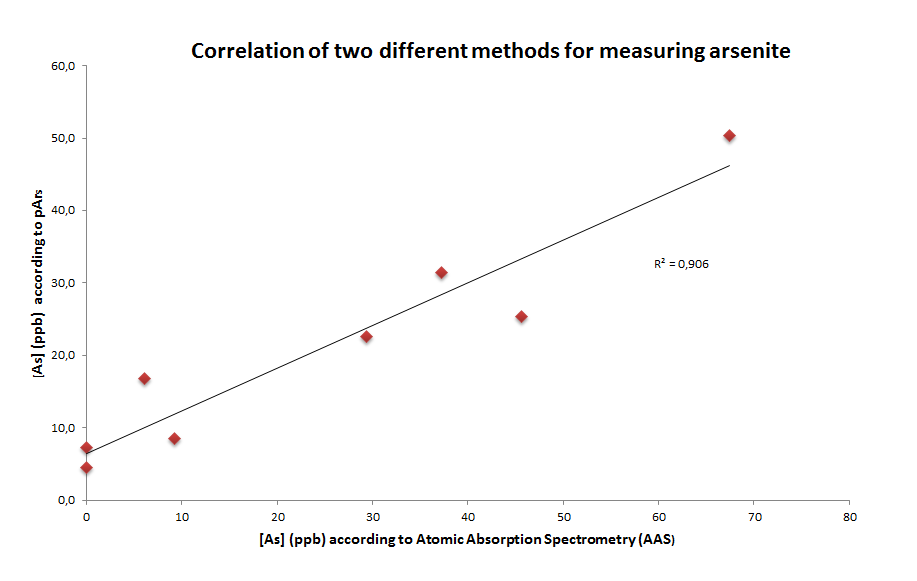
We then compared our method to an commonly used method for arsenic detection (Atomic Absorption Spectrometry, AAS). the results show that, despite pArs_mRFP construct is not as precise as AAS, it can be used as a method to indicate the arsenic concentration at different ranges (and that is what we actually need!).
For more information about the sample locations and their arsenic concentrations, please visit our Practice human practice section ]
mRFP production over time
Method
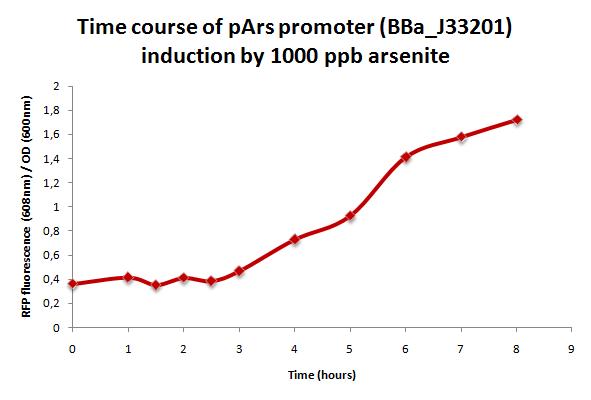
A 100 ml ArsRFP culture was grown at 30°C until it reached OD=0.4 (OD 600nm). At this point arsenite was added (1000ppb final concentration) and fluorescence was measured every 30 minutes during 8 hours at 584 nm excitation peak and 608 nm emission peak.
Results
As shown in the figure below, mRFP production increses over time with arsenite (1000 ppb). However, there is a 3 hours lag after inoculation.
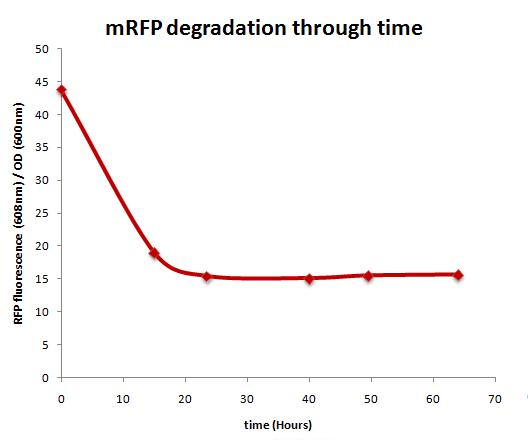
mRFP stability over time
Method
ArsRFP culture was grown overnight at 37ºC in 10 ml LB medium with 2000ppb arsenite concentration. The following day, the culture was centrifuged and the supernatant was discarded in order to remove the arsenite, thus stopping the induction. Afterwars, fresh LB medium was added and the pellet was resuspended. This was done twice and the culture was returned to 37ºC incubation. 1 ml of this culture was taken every 12 hours for the following 4 days. Finally, fluorescence was measured.
Results
mRFP degradation is shown over time, specially during the first 24 hours.
Naked eye discernibility range of mRFP production by arsenite inducible promoter
Method
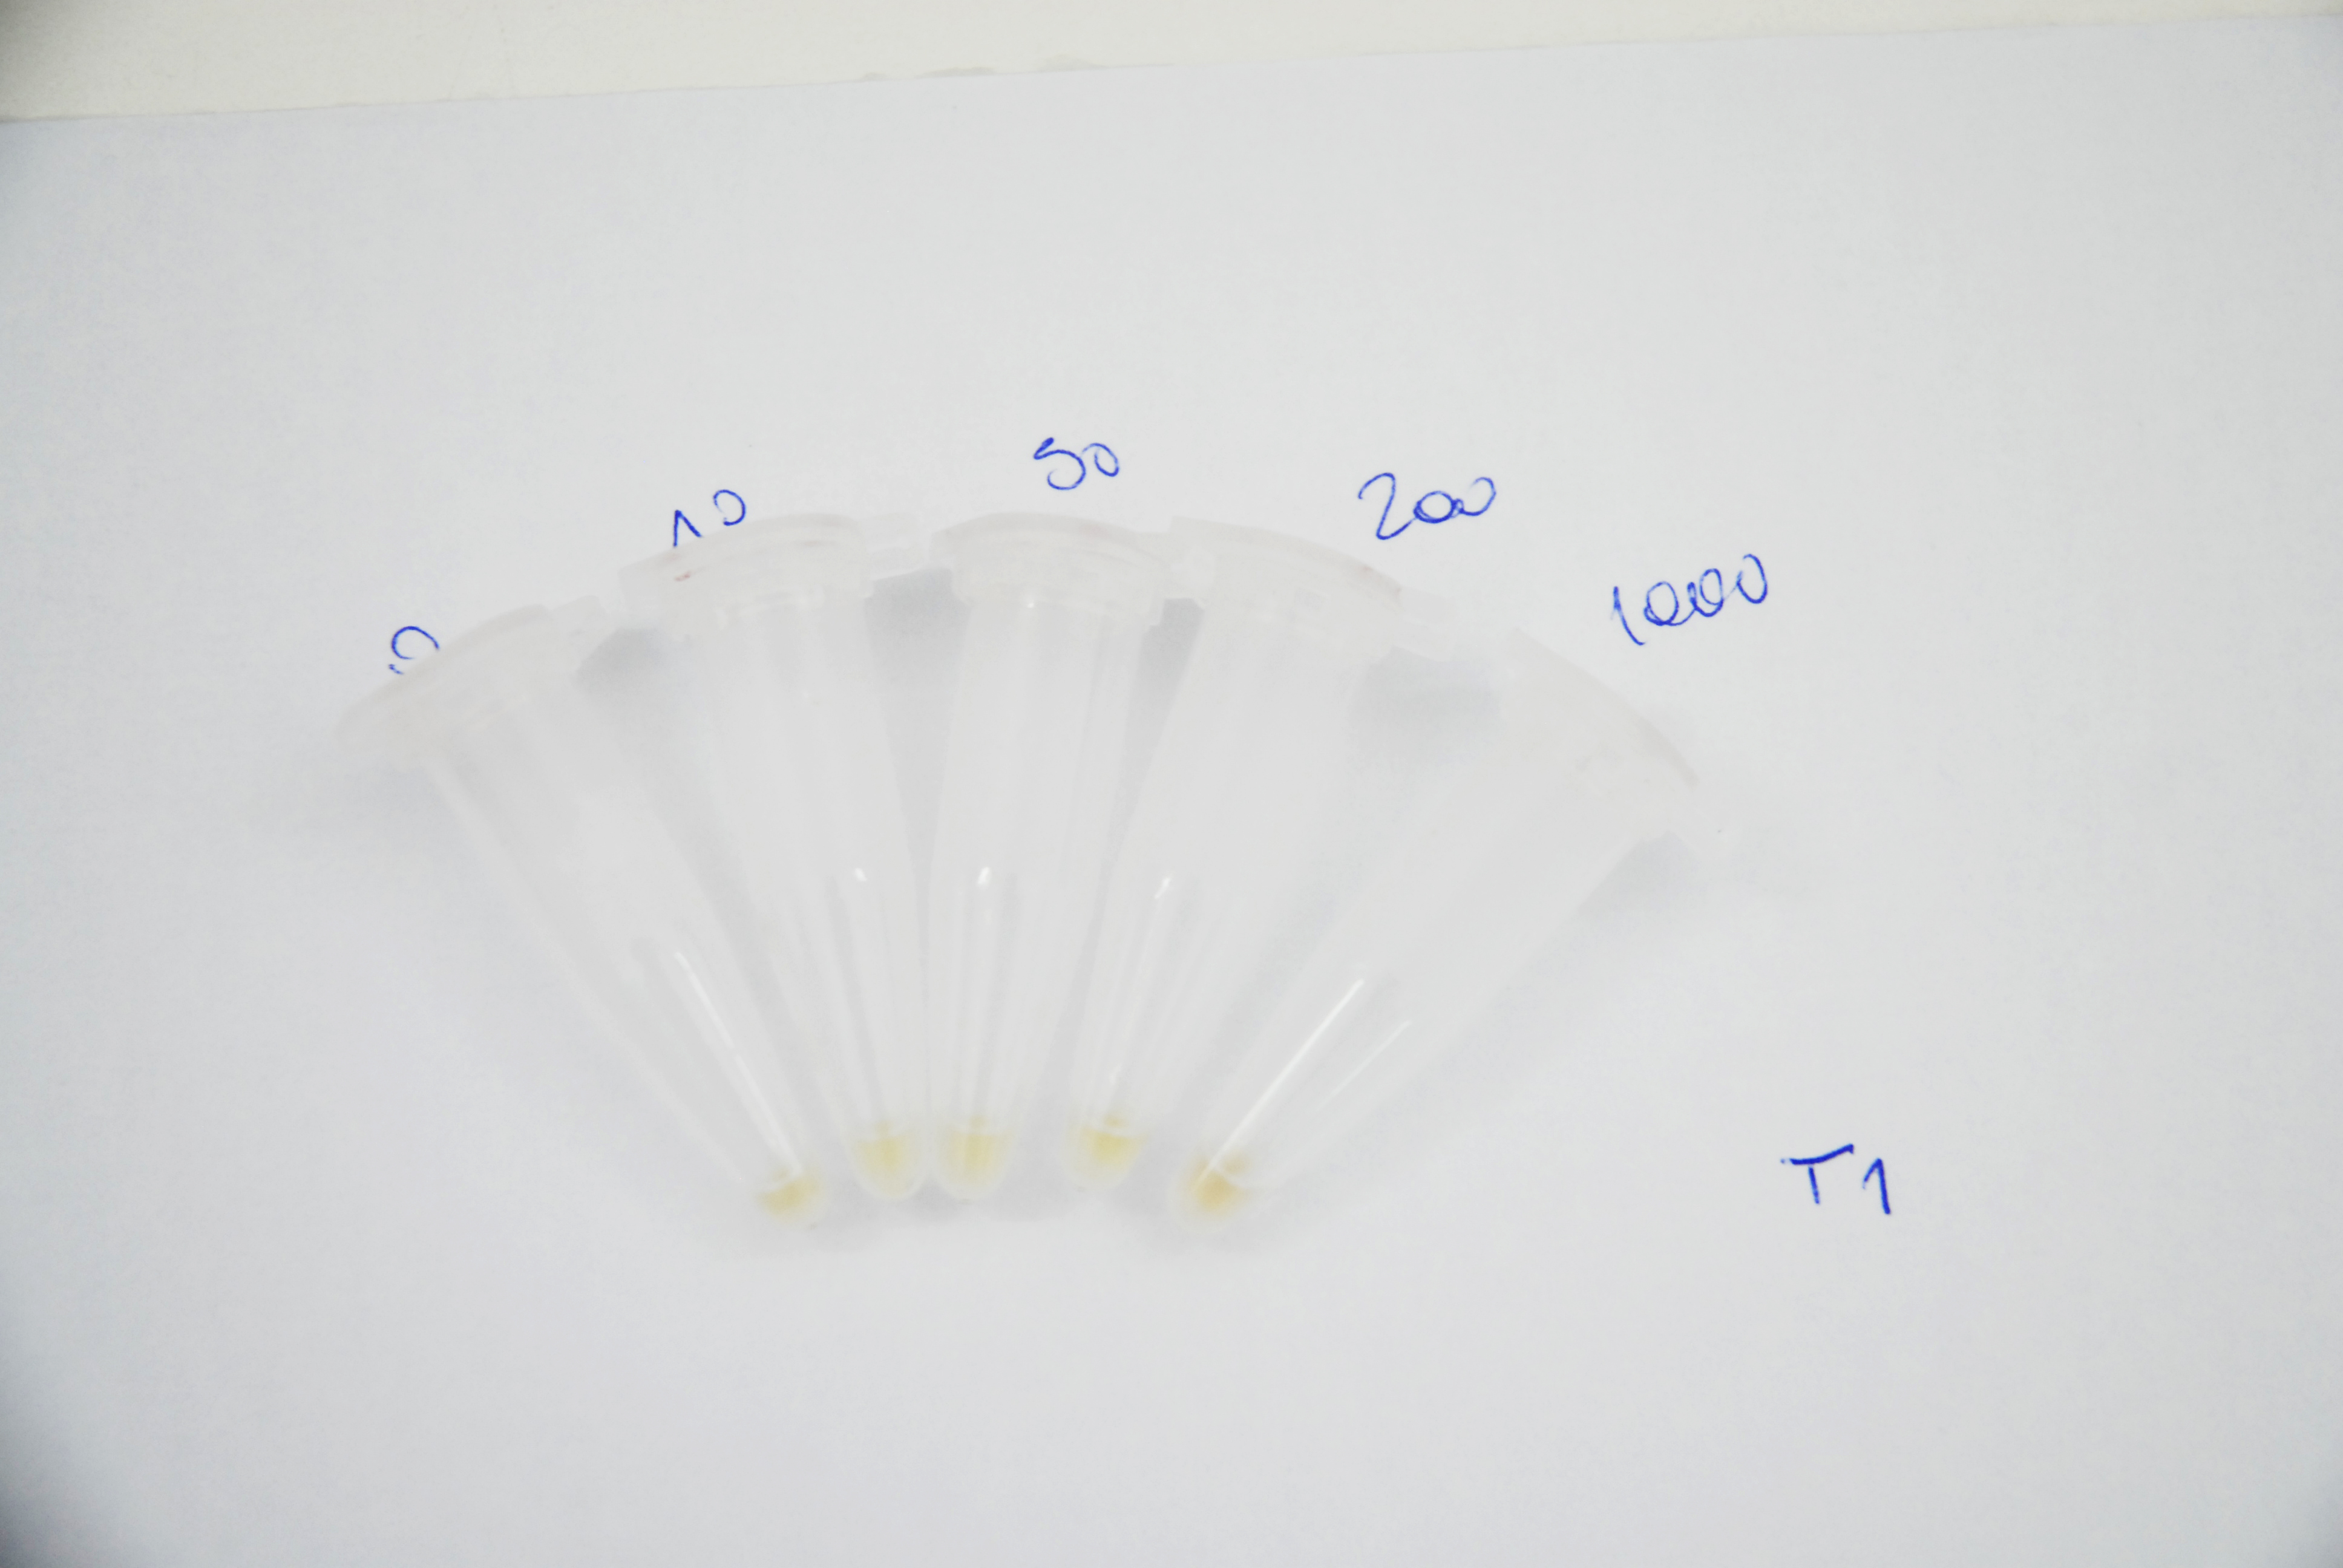
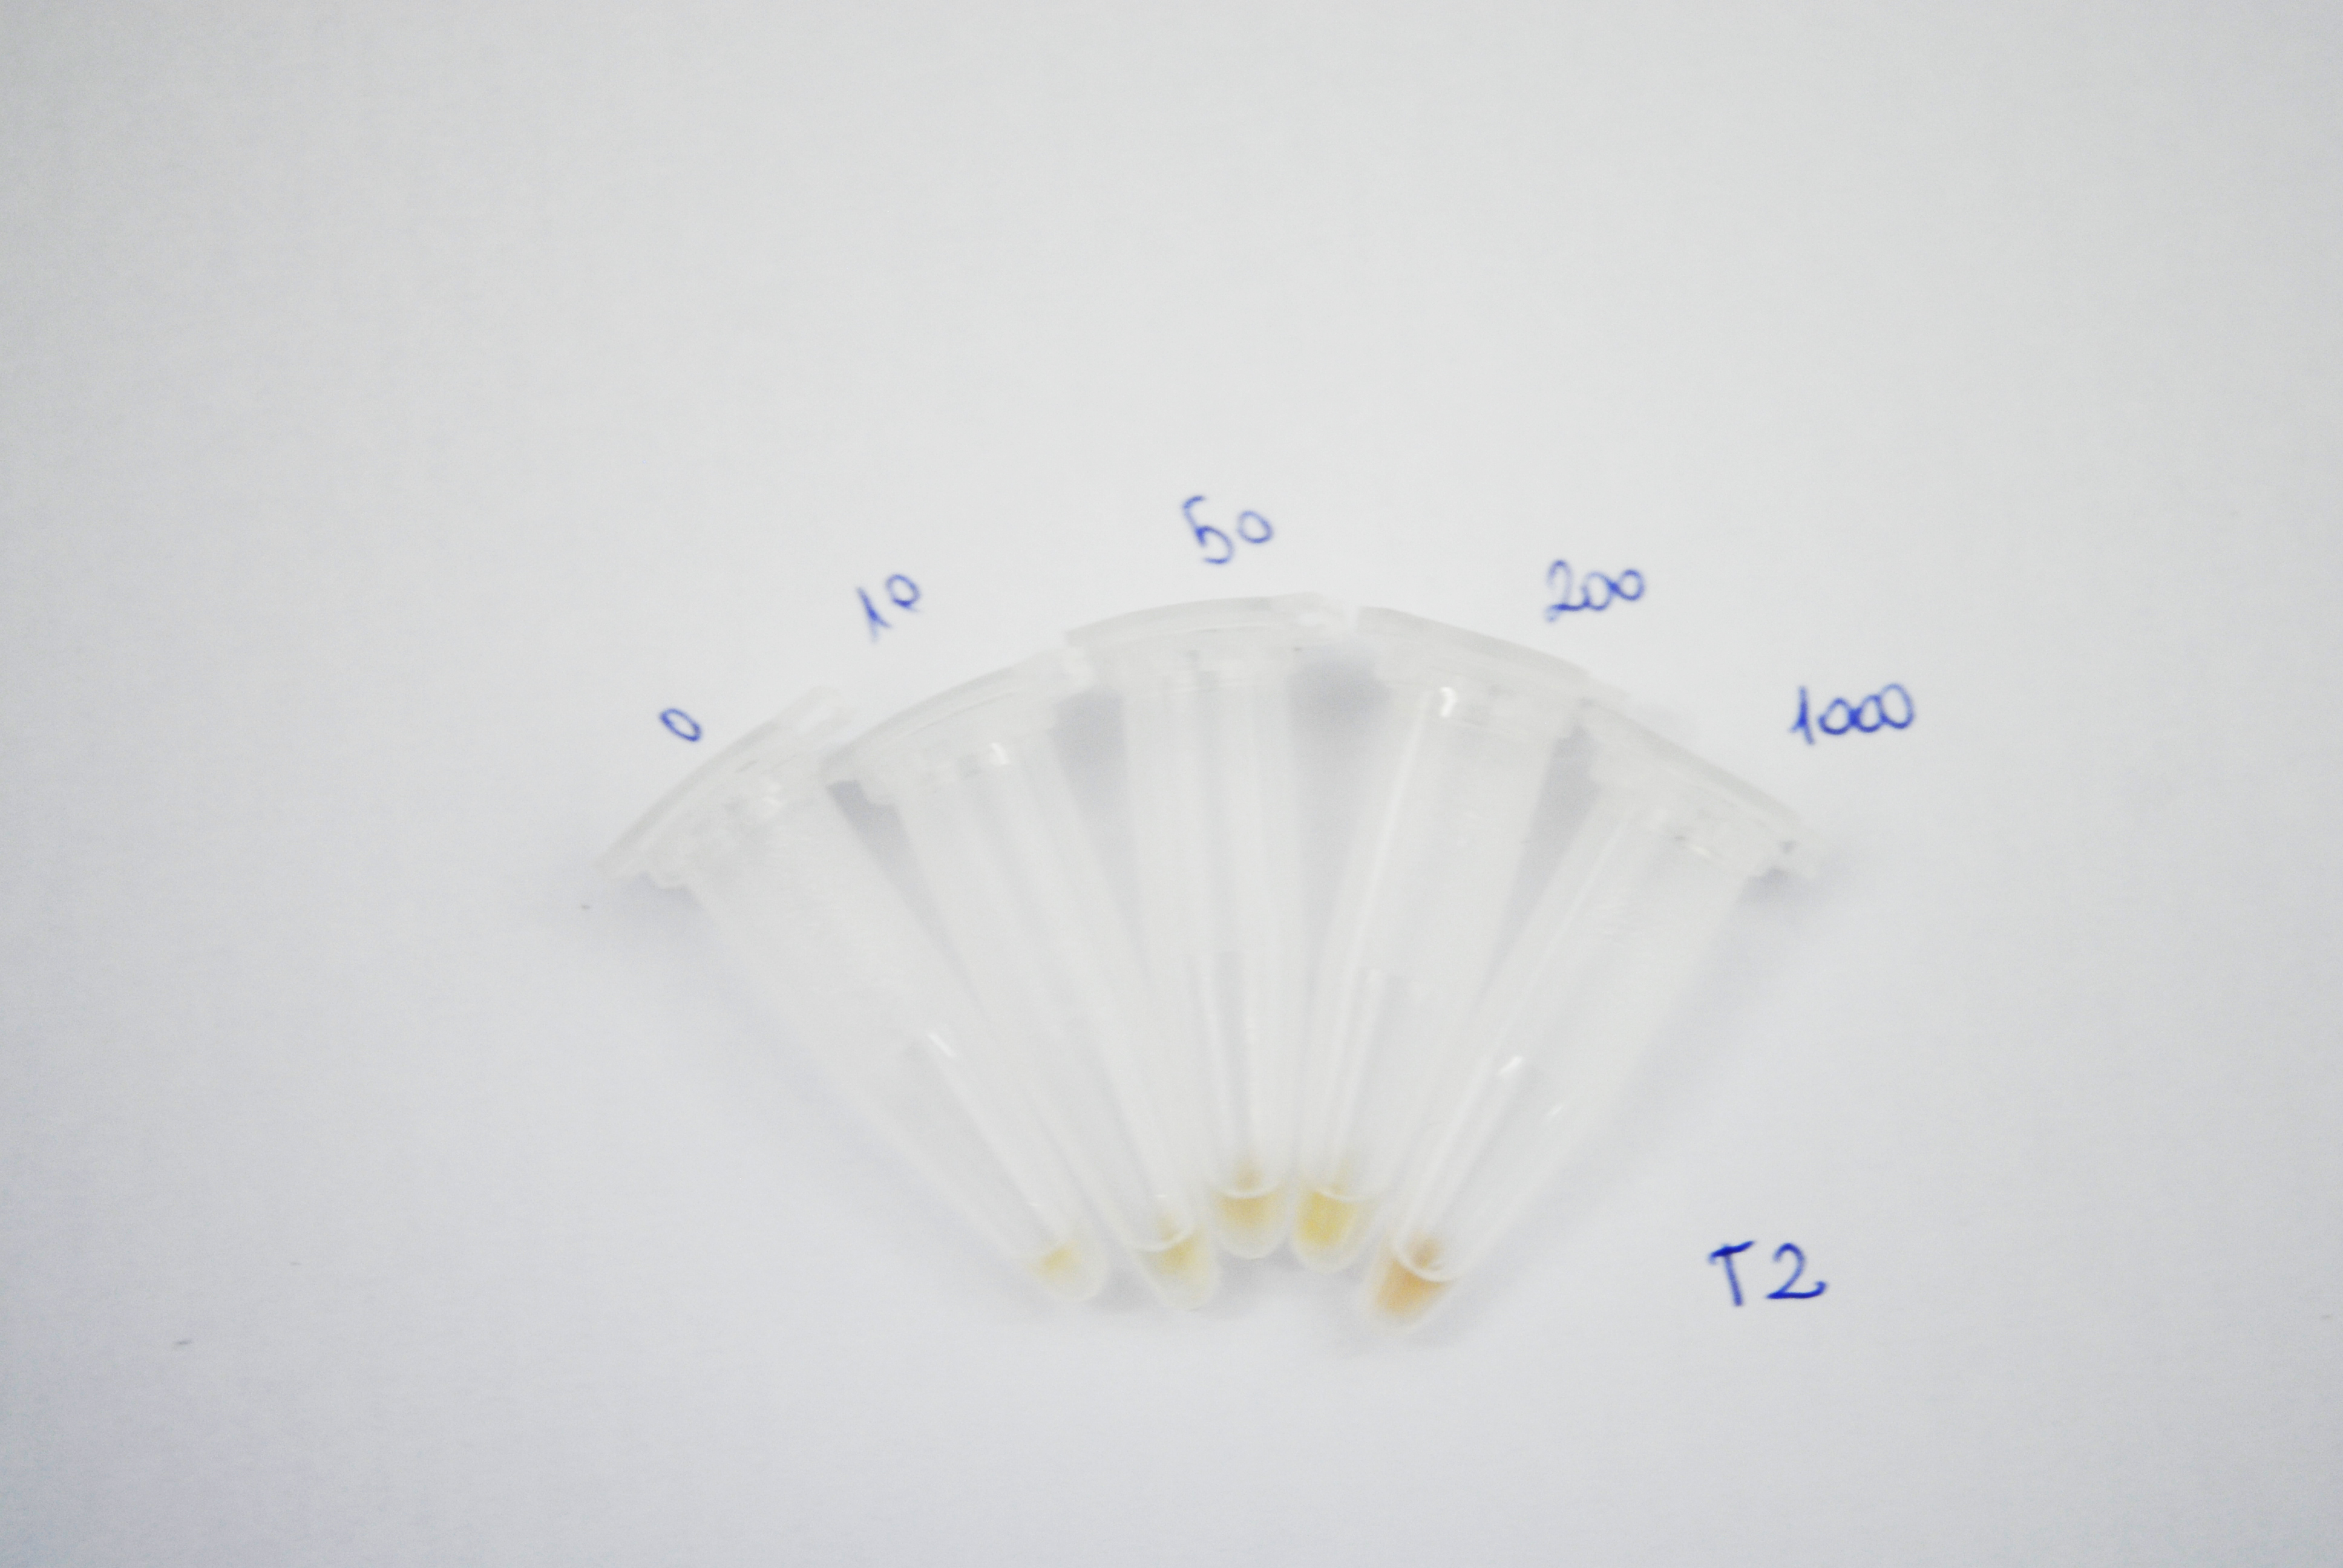
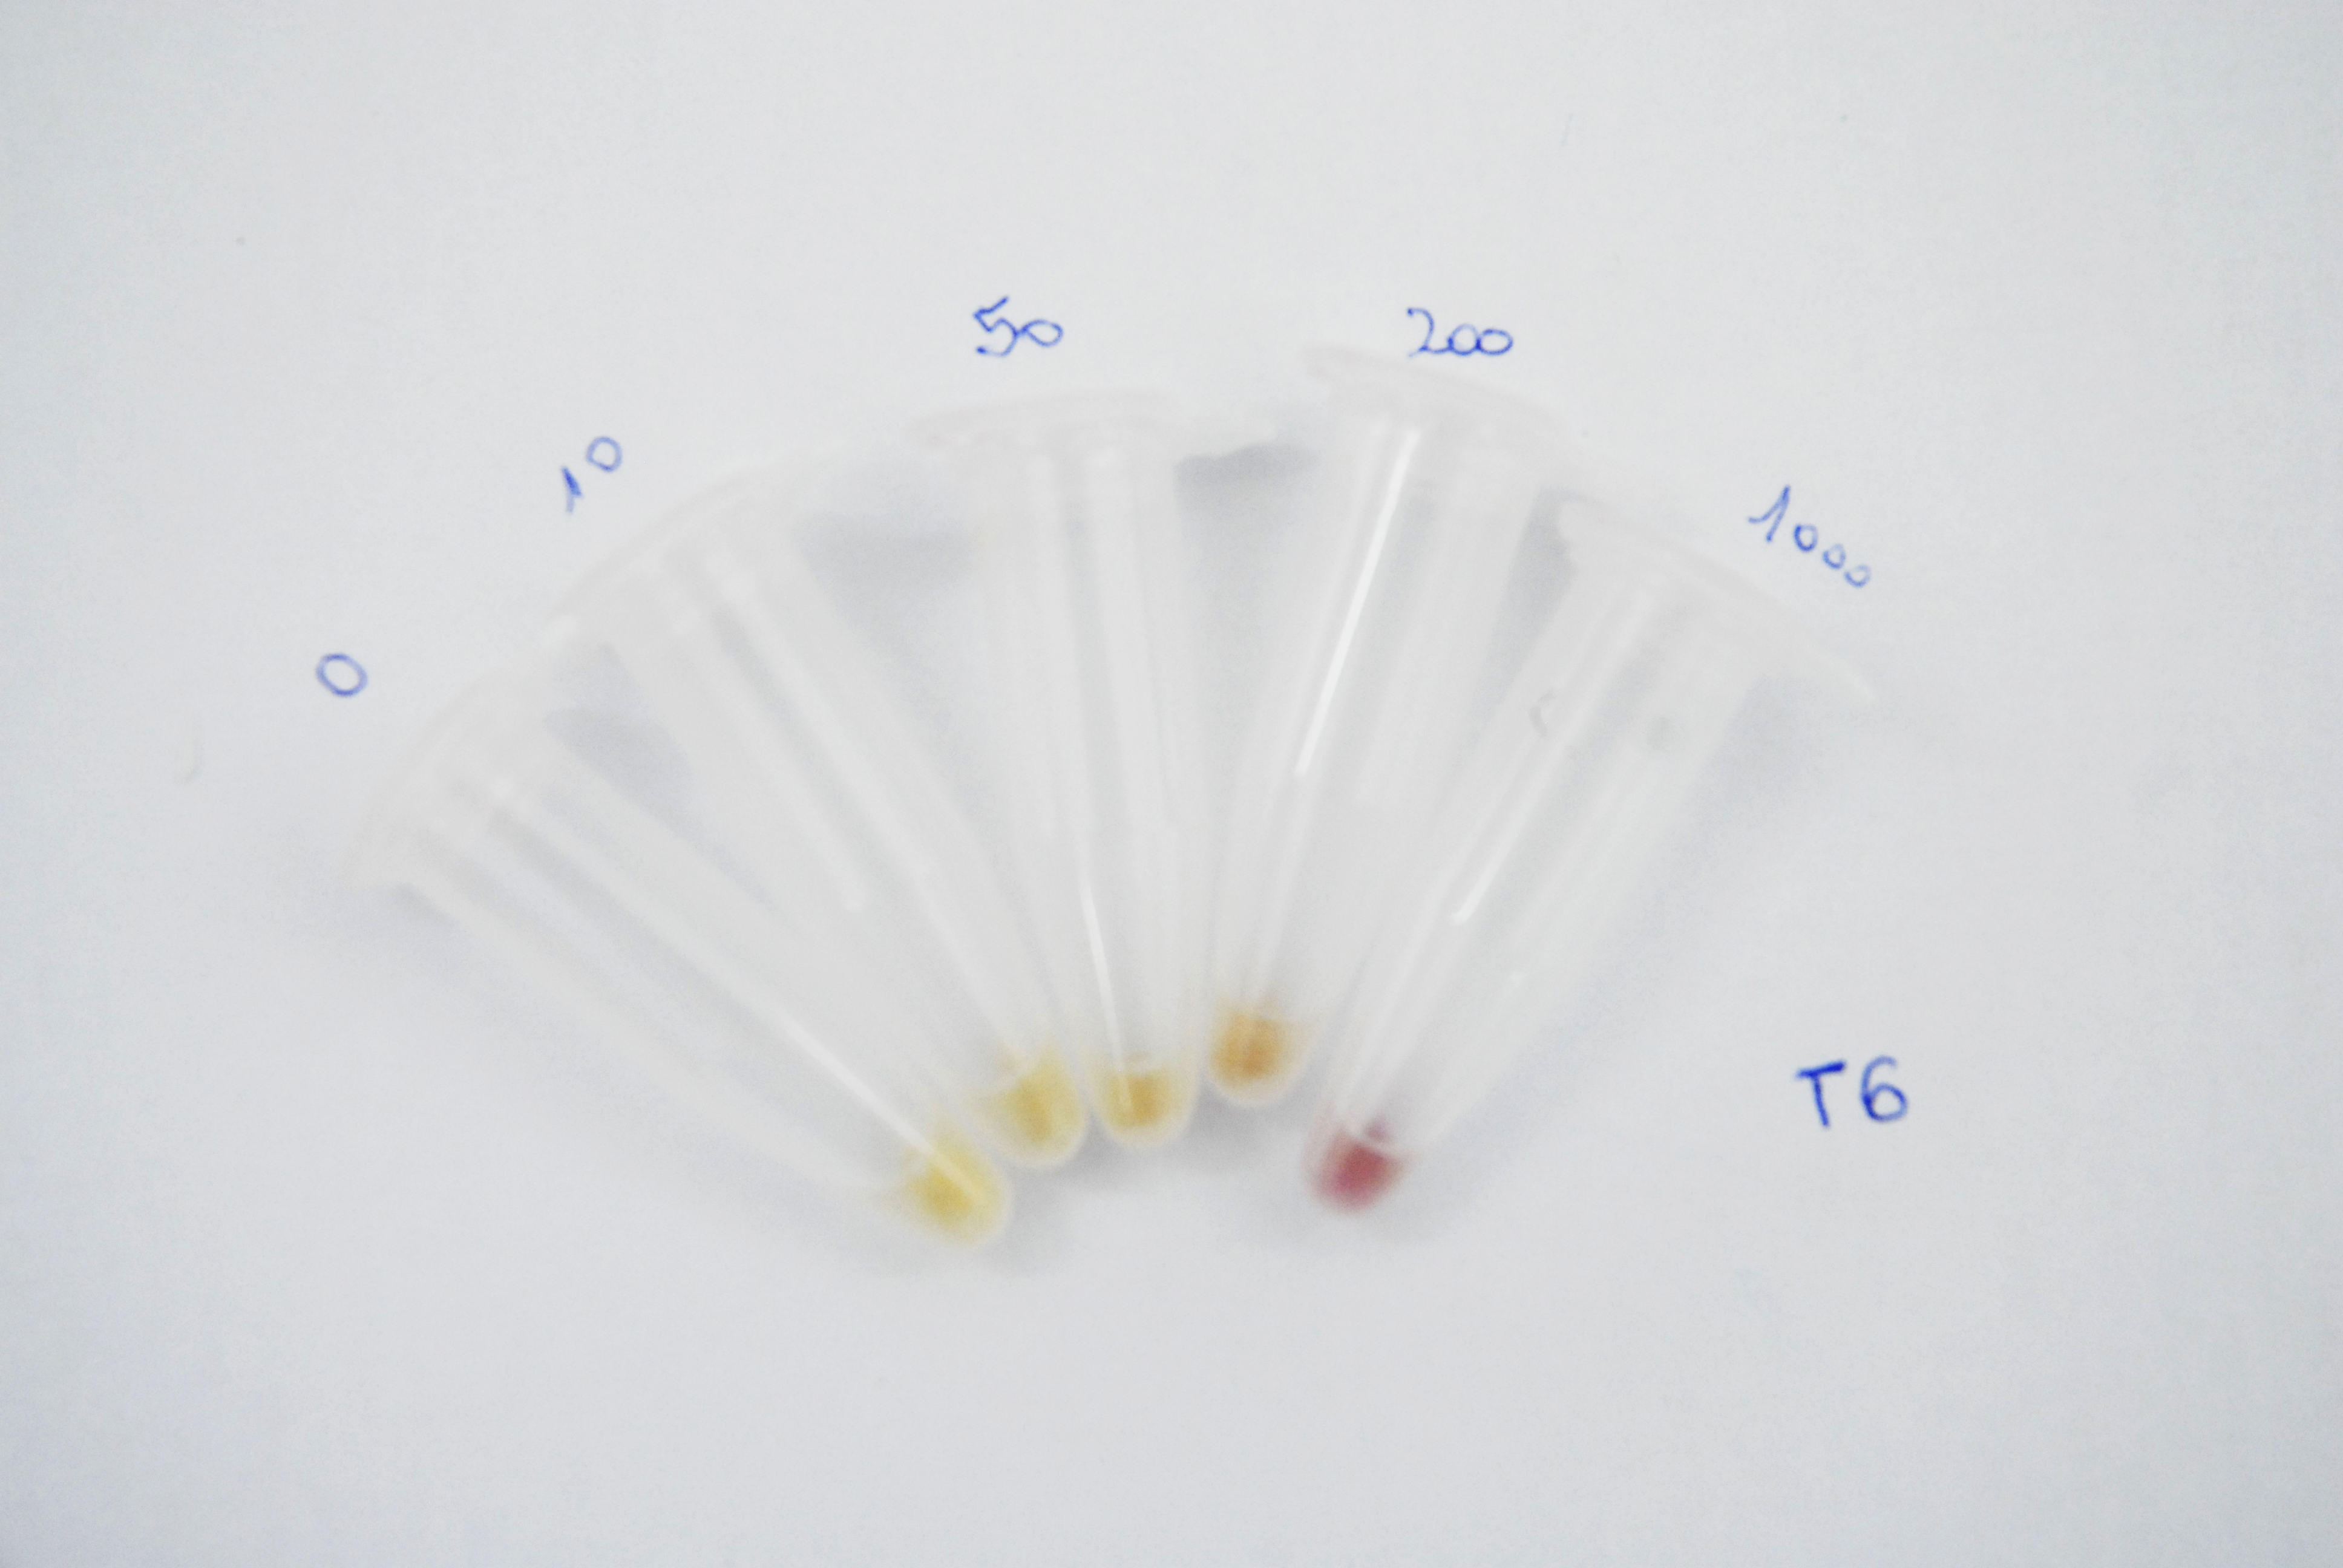
ArsRFP cultures were grown with different arsenite concentrations ( 0, 10, 50, 200 and 1000ppb). 1ml aliquots were taken every 12 hours and centrifuged at 10.000rpm for 5 minutes. Pellets pictures were taken in order to compare the range of colour at naked eye. mRFP fluorescence was also measured with a fluorimeter at 484nm for excitation and 608 nm for emission.
Results
As it can be seen in the pictures below, a difference in the colour production can be clearly distinguished between different arsenite concentrations after 24 hours of induction and between the higher arsenite concentrations only. It can also be observed that over time the production grows and that after 62 hours the difference between 200 and 1000ppb is not clear.
| After 12 hours of induction: |
| After 24 hours of induction: |
| After 36 hours of induction: |
| After 48 hours of induction: |
| After 50 hours of induction: |
| After 62 hours of induction: |
Collaboration with iGEM Tec-Monterrey team
We established a collaboration with the iGEM Tec-Monterrey team, and exchanged constructions to characterize. In this link you may find their characterization of our mRFP under pArs: [Tec-Monterrey characterization].
Overall conclusions
mRFP production responds efficiently under inducible conditions, both over time and different arsenite concentrations. The mRFP stability is acceptable for the aim of our Project. However, the visibility to the naked eye is not sufficient at low arsenite concentrations. We reached to the conclusion that, in order to increase the colour production at lower arsenite concentrations, a signal amplification system has to be added. It could also be added some switch to stop the production and avoid saturation of all the samples, and thus keep the range of colour observable to the naked eye.
 "
"
