22/08/13
From 2013.igem.org
(Difference between revisions)
AliceHaworth (Talk | contribs) (→Measuring the concentrations of isolated P. putida DNA from the previous day) |
AliceHaworth (Talk | contribs) (→Measuring the concentrations of isolated P. putida DNA from the previous day) |
||
| Line 9: | Line 9: | ||
|4||30.6||1.8||1.29 | |4||30.6||1.8||1.29 | ||
|- | |- | ||
| - | |6||42.3||1.81|1.05 | + | |6||42.3||1.81||1.05 |
|- | |- | ||
|8||35.6||1.85||1.26 | |8||35.6||1.85||1.26 | ||
Revision as of 13:43, 22 August 2013
Measuring the concentrations of isolated P. putida DNA from the previous day
- Measuring concentration using nanodrop
- Blanking against buffer
| Sample nr. | Concentration ng/ul | 260/280 | 260/230 |
| 2 | 44 | 1.8 | 1.15 |
| 4 | 30.6 | 1.8 | 1.29 |
| 6 | 42.3 | 1.81 | 1.05 |
| 8 | 35.6 | 1.85 | 1.26 |
| 10 | 38.2 | 1.84 | 1.28 |
| 12 | 40.6 | 1.83 | 1.45 |
| 14 | 39.9 | 1.88 | 1.47 |
| 16 | 18.5 | 1.17 | 0.67 |
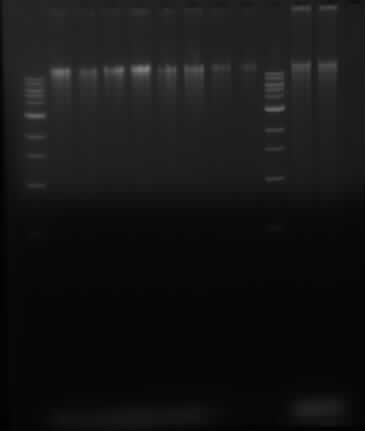
Running gel of P. putida DNA and Herring sperm DNA
Samples in lanes goes as follows: 1 Kb ladder, 2, 4, 6, 8, 10, 12, 14, 16, 1 kb ladder, 100x dilution of sheared herring sperm DNA, control 100x diluted herring sperm DNA
 "
"
