Team:UGA-Georgia/Results
From 2013.igem.org
Results
Methanococcus Lab
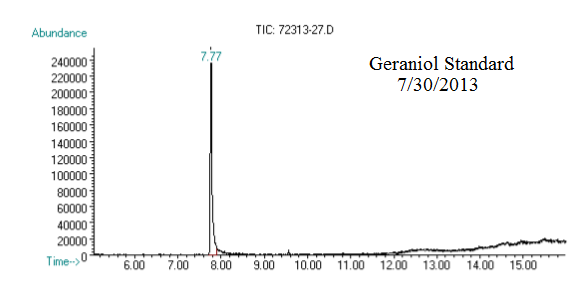
(1) This chromatograph is from a geraniol standard we created and ran on 07/30/2013. The substantial peak in this chromatograph is geraniol.
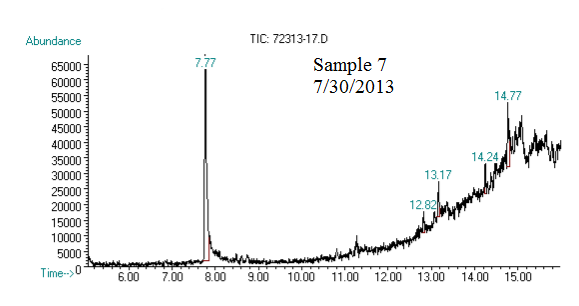
(2) This chromatograph is of one of our samples that we extracted geraniol from. The significant peak with similar retention time to the standard is geraniol. This was confirmed using Mass Spec.
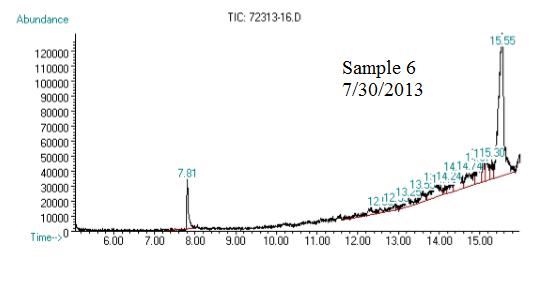
(3) This chromatograph is of another one of our samples. The significant peak with similar retention time to the standard is geraniol. This was confirmed using Mass Spec (see image below).
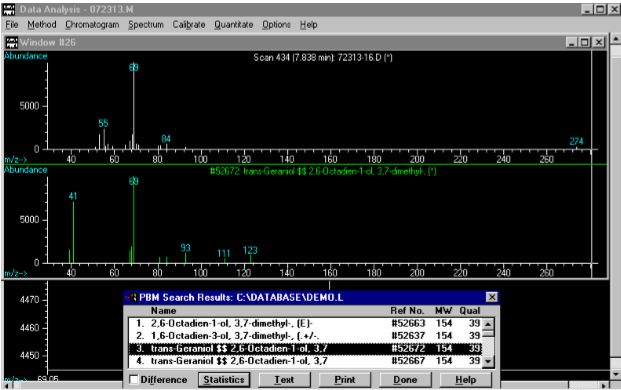
(4) This Mass Spec analysis of the previous sample recognizes the significant peak at 7.81 minutes as geraniol (aka trans-3,7-dimethyl-2,7-octadien-1-ol)
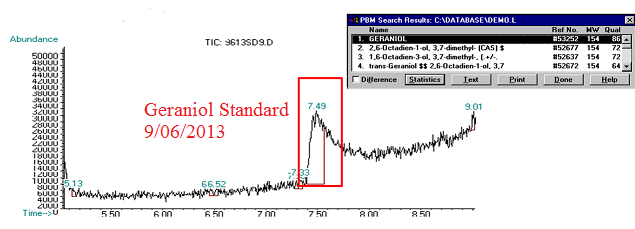
(5) This chromatograph is of a geraniol standard we created and ran on 09/06/2013. The significant peak here was confirmed via Mass Spec as geraniol (see window in top corner of image).
(6) This chromatograph is of a pAW42-GS sample that we extracted geraniol from. The significant peak here with similar retention time to the standard was confirmed as geraniol via Mass Spec (see window in bottom corner of graph)
Conclusion:
We created geraniol standards of different concentrations and plotted the concentration of the standard against the integral area of the peak formed in the respective chromatograph. From here we were able to draw a regression line through the data points and obtain a linear function. We used this linear function to accurately calculate the amount of geraniol produced in our samples. So, we can conclude the production of geraniol as 10% of the total lipid content in Methanococcus.
 "
"

