Team:DTU-Denmark/Kinetic Model
From 2013.igem.org
Contents |
Kinetic model of the Pathway
We are applying kinetic modeling to investigate how long it takes a cell to produce a certain amount of nitrous oxide.
The reactions of the pathway we are trying to integrate in E. coli are:
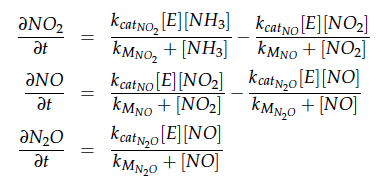
The iGEM team from Taipei in 2012 was using Nir and Nos in their project as well and did some kinetic modeling based on literature research. To describe product formation by the enzymes they used the Michaelis-Menten approach:
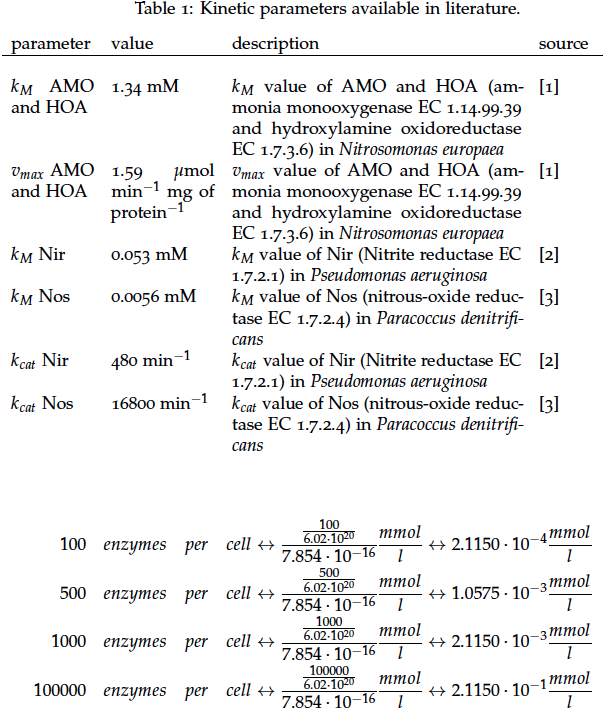
Some of the necessary parameters can be found in literature, they are listed in Table 1.
It is necessary to know or estimate the enzyme concentration if kcat values are used. The Taipei Team did this with another kinetic model, but we are missing information about many of this models parameters so the result would be very inexact. Therefore we chose to use four different enzyme concentrations in our model: 100, 500, 1000 and 100 000 enzymes per cell corresponding to low, medium, high and very high concentrations of enzyme. These numbers are based on [4].
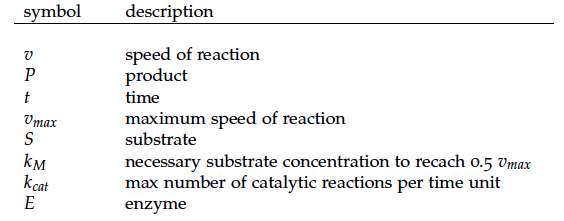
We also need to know how much ammonia the water we want to treat will contain. The ammonia concentration in different types of waste water is given in [5] as 1 mg/l in aquatic cultures, 10 mg/l for municipal waste water and more than 100 mg/l for industrial waste water. So the concentrations we want to look at in our model are: 1 mg/l, 10 mg/l, 100 mg/l and 500 mg/l ammonia.
The modeling was done in MATLAB using the Systems Biology Toolbox [6] and the models equations are given below. Results are shown in Figures 1-2.
The reactor
Continuous stirred tank reactor CSTR
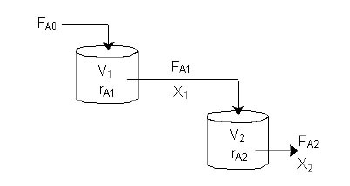
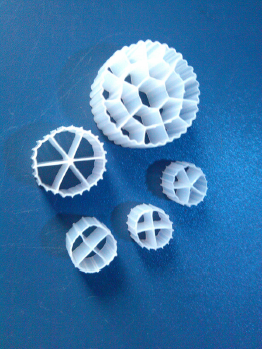
With our genetically engineered E. coli we want to treat ammonia polluted waste water. The fastest way to do this would be in a continuous process like a continuous stirred tank reactor (CSTR). Ideally this process would generate an amount of nitrous oxide that is so large that the energy needed for running the system can be delivered by catalytically decomposing the nitrous oxide. We are planing to test a simple CSTR system but hold the engineered E. coli back in the reactor, so that the outgoing water is free of bacteria. Also we will need to use two CSTRs in sequence because the second mutant requires anaerobic conditions. A picture of two CSTR reactors in series can be found in Figure 3. Another interesting solution would be to grow a bacterial biofilm on solid carriers as shown in Figure 4, a technology known as moving bed biofilm reactor.
A CSTR can be balanced using the following equation [7]:
Figure 1: Kinetic modeling of Mutant 1. Nitrite concentration over time based on kinetic parameters found in literature and for different enzyme and substrate (here NO2) concentrations.
Figure 2: Kinetic modeling of Mutant 2. Nitrous oxide concentration over time based on kinetic parameters found in literature and for different enzyme and substrate (here NO2) concentrations.
Figure 3: Two CSTRs in series taken from http://www.umich.edu/elements/a-syLearn/bits/cstr/.
Figure 4: In moving bed biofilm reactors the biofilm is grown on carriers as shown above. The picture is taken from http://www.hydrotech-group.com/en/products/industrial-wwtp/mbbr/.
For a CSTR perfect mixing is assumed, which means that the concentrations of all compounds are the same everywhere in the reactor and also at the exit point. If the system is run in steady state the so called design equation can be used to calculate the necessary volume of the reactor:
We can split the molar flow rate of species j into concentration of species j times flow. The reaction rate is dependent on the substrate concentration and can be described with Michaelis-Menten kinetics in our case: ![]() . So we can calculate the volume of the first reactor for series of different flow rates and substrate concentrations.
To include the right enzyme concentration we need to estimate how many cells per litre we will have in the reactor and how many enzymes each cell will contain. It was estimated that the cells take up 40% of the volume in the reactor and that they contain 750 copies of each protein of the pathway (see above) resulting in a enzyme concentration of 2.4917x10⁻⁴ mmol/l.
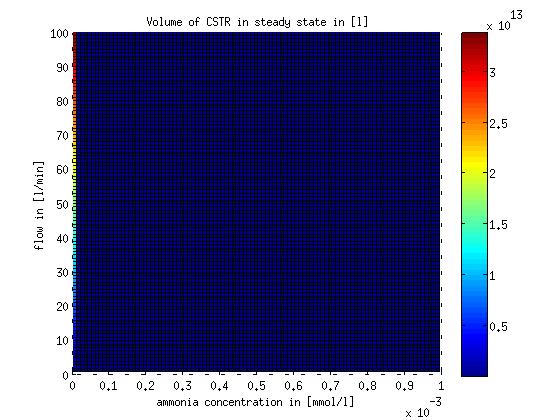
However this equation does not allow a complete removal of the substrate ammonia from the system. The MATLAB function describing the design equation and the script to evaluate it for different flows and substrate concentrations are stored on google drive in Modeling/reactor/CSTR/steadystate. The result of evaluating the design equation for different flows and substrate concentrations is shown in Figure 5.
. So we can calculate the volume of the first reactor for series of different flow rates and substrate concentrations.
To include the right enzyme concentration we need to estimate how many cells per litre we will have in the reactor and how many enzymes each cell will contain. It was estimated that the cells take up 40% of the volume in the reactor and that they contain 750 copies of each protein of the pathway (see above) resulting in a enzyme concentration of 2.4917x10⁻⁴ mmol/l.
However this equation does not allow a complete removal of the substrate ammonia from the system. The MATLAB function describing the design equation and the script to evaluate it for different flows and substrate concentrations are stored on google drive in Modeling/reactor/CSTR/steadystate. The result of evaluating the design equation for different flows and substrate concentrations is shown in Figure 5.
Figure 5: CSTR volume for different flow rates and substrate (ammonia) concentrations. The volume was calculated for a steady state application using the design equation.
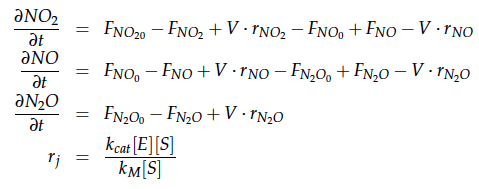
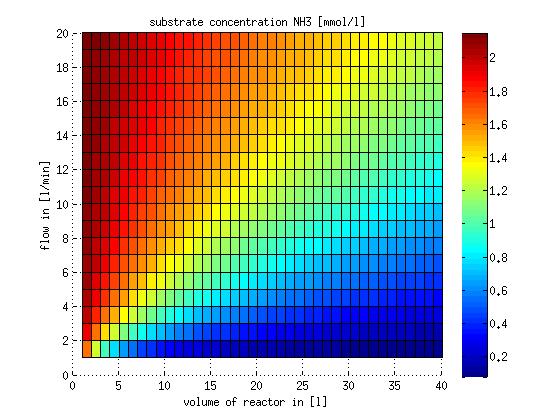
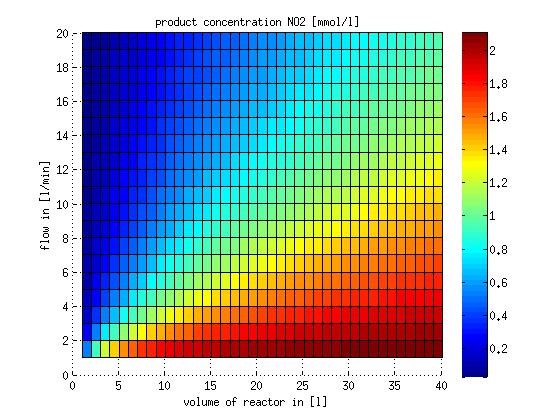
In a different approach the reactors were was not assumed to be in steady state but modelled by using the mass balance equation given above. The equations of the model are shown below and the plots of substrate and product concentration for different flows and volumes of the reactors can be found in Figures 6-7. The system was simulated for 1000 min (which corresponds to several cell generations) to assure it to be very close to steady state (or in steady state).
Figure 6: Substrate and product concentration in CSTR reactor 1 (ammonia to nitrite) for different flow rates and reactor volumes. The simulation time was 1000 min to assure that the system is very close to steady state.
References
[1] WK Keener and DJ Arp. Kinetic studies of ammonia monooxygenase inhibition in Nitrosomonas europaea by hydrocarbons and halogenated hydrocarbons in an optimized whole-cell assay. Applied and Environmental Microbiology, 59(8): 2501–2510, 1993.
-!
Figure 7: Substrate and product concentration in CSTR reactor 2 (from nitrite to nitrous oxide) for different flow rates and reactor volumes. The simulation time was 1000 min to assure that the system is very close to steady state.
[2] Serena Rinaldo. Biology of the Nitrogen Cycle. Francesca Cutruzzola, 2007 (37-55).
[3] SW Snyder and TC Hollocher. Purification and some characteristics of nitrous oxide reductase from paracoccus denitrificans. Journal of Biological Chemistry, 262: 6515–6525, 1987.
[4] Y Ishihama, T Schmidt, J Rappsilber, M Mann, FU Hartl, MJ Kerner, and D Frishman. Protein abundance profiling of the escherichia coli cytosol.BMC genomics, 9, 2008.
[5] T.C. Jorgensen and L.R. Weatherley. Ammonia removal from wastewater by ion exchange in the presence of organic contaminants. Water Research, 37:723–1728, 2003.
[6] Systems biology toolbox for matlab: A computational platform for research in systems biology. Bioinformatics, 22(4):514–515, 2006.
[7] H. Scott Fogler. Essentials of Chemical Reaction Engineering. Prentice Hall, 2010.
 "
"


