Team:Heidelberg/Templates/DelH week22
From 2013.igem.org
Contents |
23-09 - 29-09-13
Mutagenesis of DelH Clone I 6B
Screening-PCR Conditions CP.W22.A
Screening of the 11 colonies, which grew on the agar plate.
| Template | 11x 1 picked colony + positve control (Midiprep I6B) |
| Expected length [bp] | 319 (VFII+HM22); 395 (FS66+SR03) |
| Named | Mut1-11 (VFII+HM22), Mut1-11 (FS66+SR03) |
| Primer fw 10 µM | 2 µl VF2 / FS66 |
| Primer rev 10 µM | 2 µl HM22 / SR03 |
| One-Taq (2x) | 10 µl |
| ddH2O | 6 µl |
| Cycles | Temperature DelH [°C] | Time [s] |
|---|---|---|
| 1 | 95 | 900 |
| 35 | 95 | 30 |
| 55 | 30 | |
| 72 | 25 | |
| 1 | 12 | inf |
Result
Expected bands: 319 bp (HM22-VFII) and 395 bp (FS_66-SR_03)
10 ml of each colony were cultured.
- The screening with primer FS_66 to SR_03 did not work. The positive control was negative.
- The screening with primer VFII to HM22 was positive for 4 colonies (2,3,4,7,8,10)
- These colonies have to be midi-preped and digested to test whether it is the original DelH or the mutated one
Midiprep of Clones 2,3,4,7,8 and 10
- Centrifugation of 10 ml culures at 3750 rpm for 15 min
- Kept pellet an resuspended in 400 µl P1 buffer
- Added 800 µl P2 buffer and incubated for 180
- Neutralized with S3 buffer
- Centrifugated for 15 min at 13 000 rpm
- Kept supernatant and added 50:50 Isopropanol
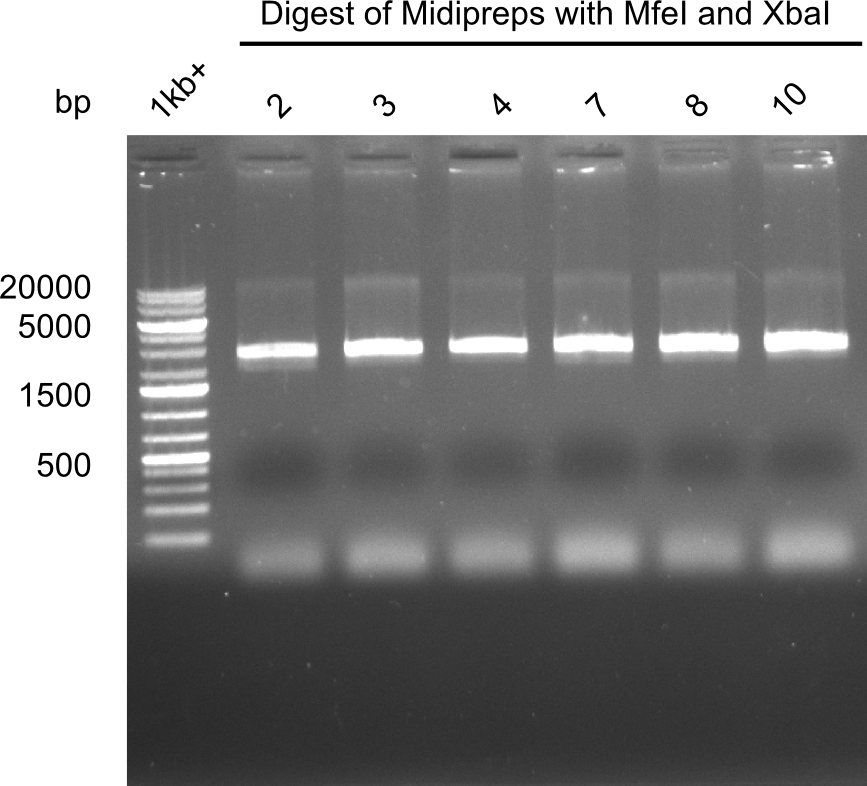
Test restriction digest of Midipreps with MfeI and XbaI
Expected band: 22.9 kb
| Reagent | Volume [µl] |
|---|---|
| Midiprep colonies | 0.2 |
| Cutsmart buffer | 2 |
| XbaI | 1.5 |
| MfeI-HF | 1.5 |
| ddH2O | 14.75 |
- Incubation for 2 h at 37°C
Apparently the mutagenesis did not work. The band was too low. Maybe recombination occured.
Sequencing
The Midiprep of clone 2 was send to sequencing to see what had happened during the mutagenesis.
Result
The mutagenesis did not work. Apparently recombination occured. As the result was the same for all the colonies we suspect that repeating the mutagenesis would lead to the same result. Therefore the mutagenesis part is stopped.
SDS-PAGE of Clone C5
Lysis of Cells
- 1 ml over night cultures in LB of electrocompetent BL21-pLys and BL21-pLys with pHM04 (C5)
- Meausured ODs (BL21-pLys = 1.33; BL21-pLys + pHM04= 1.03 )
- Centrifugation at 13000 rpm for 10 min
- Discarded supernatant
- Resuspended cells in 133 µl (BL21-pLys) and 103 µl (BL21-pLys + pHM04) 1x loading buffer (40% ddH2O, 12.5% TrisHCl pH=7.5, 20% Glycerol (50%), 20% SDS (10%), 5% β-Mercaptoethanol, 2.5% Bromophenol blue)
- Boiled samples for 10 min at 98°C
Electrophoresis
- Applied 25 µl of each sample on SDS-polyacrylamide gel
- Run at 100 V for 5 min and afterwards at 140 V for another 50 min
Staining and Destaining Procedure
- Gel was stained in Coomassie Brilliant Blue for 1 h on shaker
- Destaining with destaining buffer (50% ddH2O, 40% Methanol, 10% Acetic acid) until band were visible
Result
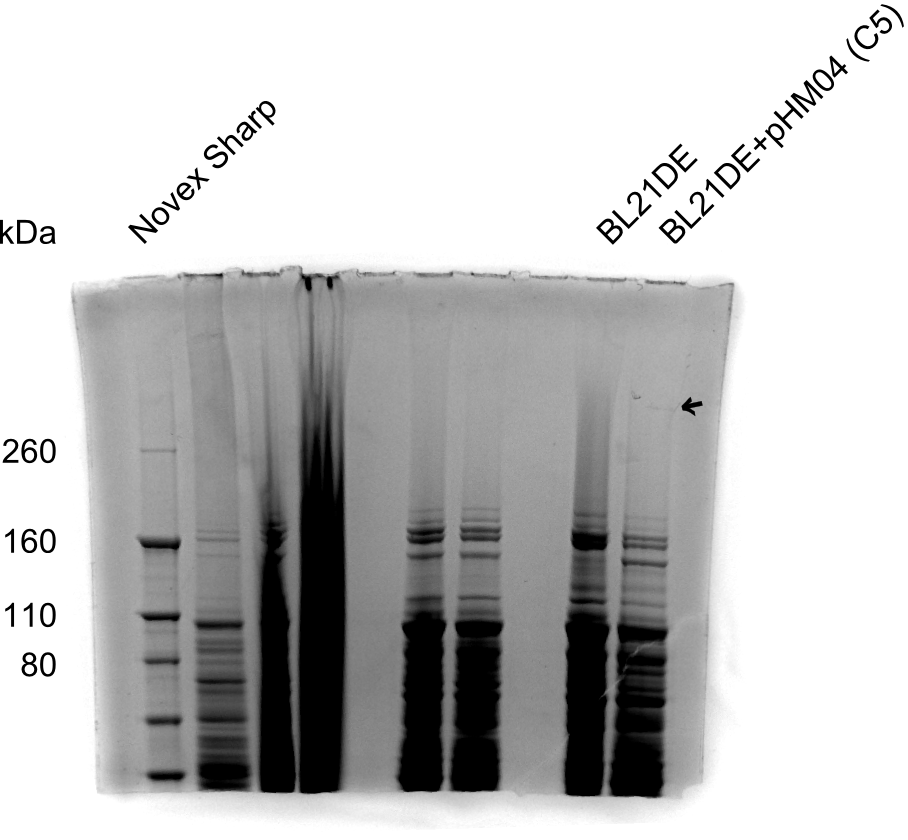
As shown in figure 22.3, there is a faint very high band, which is DelH (~600 kDa). Clone C5 expresses DelH despite of the amino acid substitution. Next, we will electroporate DelH C5 with DelRest and pIK8.6 in E. coli BL21 DE3 and analyze Delftibactin expression by Micro-TOF.
Generation of DelH Plasmid pHM04 18-09
Colony-PCR CP.W22.B
| Template | 48x 1 picked colony |
| Expected length [bp] | 663 |
| Named | 1A - 12E, DelH III |
| Primer fw 10 µM | 50x 2 µl VF2 |
| Primer rev 10 µM | 50x 2 µl DN07 |
| One-Taq Polymerase (2x) | 50x 10 µl |
| ddH2O | 48x 6 µl |
| Cycles | Temperature [°C] | Time [s] |
|---|---|---|
| 1 | 95 | 120 |
| 12 | 95 | 30 |
| 68 (touchdown -0.5°C) | 30 | |
| 72 | 45 s | |
| 18 | 95 | 30 |
| 65 | 30 | |
| 72 | 45 | |
| 1 | 12 | inf |
Result
Expected band: 663 bp
- The following colonies seem positive, because they show the expected band at 663 bp
| Picture | Positive colonies |
|---|---|
| 22.1 | A9 |
| 22.2 | D7, D9, D11 |
| 22.3 | E5, E6, E7, F7 |
Test Restriction Digest
The positive screened colonies were digested with PvuI.
| Template DNA | CutSmart Buffer | PvuI | ddH2O | Total Volume |
|---|---|---|---|---|
| 8.5 µl 1 µl | 0.5 µl | - | 10 µl |
Result
Expected bands: 11,621, 8628 & 2,685 bp
The following colonies show the correct pattern:
| Colonies | Positive in Digest | Concentration in Midiprep [ng/µl] |
|---|---|---|
| II A9 | yes | 2,153 |
| III D7 | yes | 3,371 |
| III D9 | yes | 697 |
| III D11 | yes | 3,523 |
| III E6 | yes | 2,745 |
| III E7 | yes | 3,649 |
They were not sequenced due to exclusively found mutations in BL21 DE3 (pLys).
Generation of DelH Plasmid pHM04 20-09
Colony-PCR CP.W22.C
| Template | 48x 1 picked colony |
| Expected length [bp] | 663 |
| Named | 1F - 12H, DelH III |
| Primer fw 10 µM | 50x 2 µl VF2 |
| Primer rev 10 µM | 50x 2 µl DN07 |
| One-Taq Polymerase (2x) | 50x 10 µl |
| ddH2O | 48x 6 µl |
| Cycles | Temperature [°C] | Time [s] |
|---|---|---|
| 1 | 95 | 120 |
| 12 | 95 | 30 |
| 68 (touchdown -0.5°C) | 30 | |
| 72 | 45 s | |
| 18 | 95 | 30 |
| 65 | 30 | |
| 72 | 45 | |
| 1 | 12 | inf |
Result
Expected band: 663 bp
- The following colonies seem positive, because they show the expected band at 663 bp
| Picture | Positive colonies |
|---|---|
| 22.3 | F7, F9, F11 |
| 22.4 | G3, G4, G12, H6, H11 |
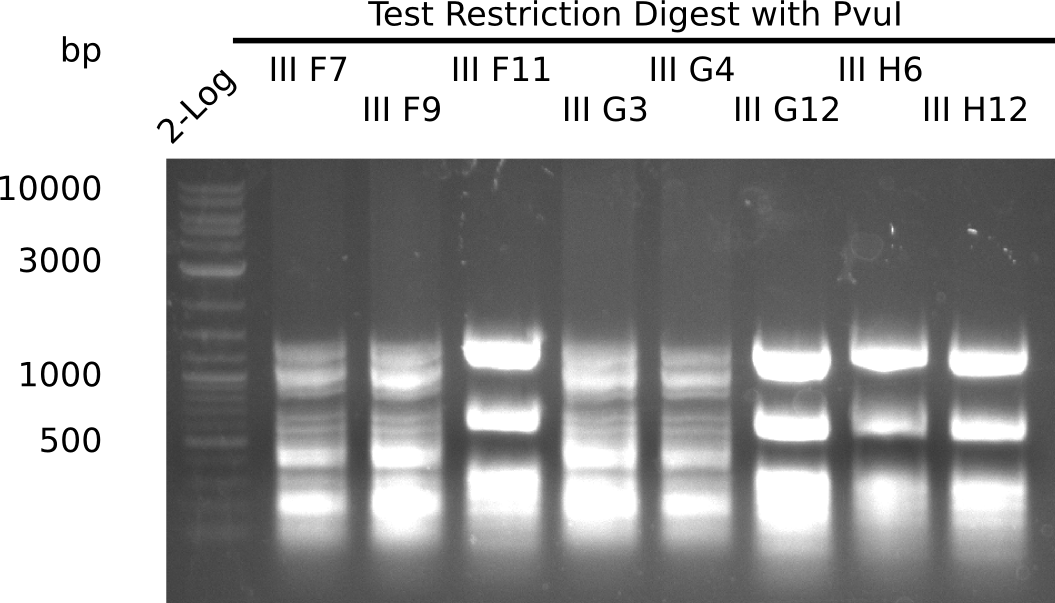
Test Restriction Digest
The positive screened colonies were digested with PvuI.
| Template DNA | CutSmart Buffer | PvuI | ddH2O | Total Volume |
|---|---|---|---|---|
| 8.5 µl 1 µl | 0.5 µl | - | 10 µl |
Result
Expected bands: 11,621, 8628 & 2,685 bp
The following colonies show the correct pattern:
| Colonies | Positive in Digest | Concentration in Midiprep [ng/µl] |
|---|---|---|
| III F7 | yes | 3,856 |
| III F9 | yes | 1,283 |
| III F11 | no | 4,507 |
| III G3 | yes | 5,823 |
| III G4 | yes | 3,622 |
| III G12 | no | 3,615 |
| III H6 | no | 3,985 |
| III H11 | no | 3,605 |
Sequencing
Colonies F7, F9, G3 and G4 were send for sequencing with VF2.
Result
| Colonies | Alignment File |
|---|---|
| III F7 | Sequencing of clone III F7 with VF2 |
| III F9 | Sequencing of clone III F9 with VF2 |
| III G3 | Sequencing of clone III G3 with VF2 |
| III G4 | Sequencing of clone III G4 with VF2 |
Contamination of Cells with Chloramphenicol Resistance
Preparation of Electrocompetent BL21 DE3
Electrocompetent BL21 DE3 were prepared according to the protocol. The following day, the LB Chlor plate was covered with colonies. Since BL21 are in contrast to BL21 pLys not ntaurally resistant to Chloramphenicol, they are obviously contaminated. In order to check whether this is also caused by an Indigoidine plasmid, extensive evaluation of stocks and transformed cells will be undertaken.
Test for Chloramphenicol Resistance
All stocks of competent cells were streaked on LB Chlor plates and incubated at 37°C ON.
Result
| Cells | Prepared | Growth on Plate |
|---|---|---|
| E.coli DH10ß elec | older | no |
| E.coli DH10ß elec | 21-09 | no |
| E.coli BL21 DE3 chem | original stock | yes |
| E.coli BL21 DE3 elec | older | yes |
| E.coli BL21 DE3 elec | 22-09 | yes |
| E.coli BL21 pLys elec | older | yes |
Thus, the BL21 DE3 we obtained most probably are BL21 DE3 pLys, too.
New BL21 DE3
We obtained new BL21 DE3 from the Russel Lab, which were obtained from NEB directly. Cells were inocculated in 10 ml LB and streaked on LB Chlor plates. The vial was frozen again at -80°C.
Test for Indigoidine Contamination A
All competent cells as well as important transformed cells and recent mini preps of possible DelH plasmids were tested for contamination with an Indigoidine plasmid (which carries chloramphenicol resistance).
| Reagent | Amount [µl] |
|---|---|
| Template | 0.5 or colony |
| RB69 10 µM | 1 |
| VF2 10 µM | 1 |
| OneTaq Master Mix | 5 |
| ddH2O | 2.5 |
| Cycles | Temperature [°C] | Time [s] |
|---|---|---|
| 1 | 95 | 300 |
| 35 | 95 | 30 |
| 53 | 30 | |
| 72 | 90 | |
| 1 | 72 | 600 |
| 1 | 12 | inf |
Result
Expected band: 540 bp
The following samples show Indigoidine band:
| Name | Cells | Plasmids | Indigoidine band |
|---|---|---|---|
| 1 | E.coli BL21 DE3 original | - | no |
| 2 | E.coli BL21 DE3 older | - | no |
| 3 | E.coli BL21 DE3 22-09 | - | no |
| 4 | E.coli DH10ß 21-09 LB | - | no |
| 5 | miniprep | DelH C5 | yes |
| 6 | miniprep | DelH C7 | yes |
| 7 | miniprep | DelH C12 | yes |
| 8 | miniprep | DelH G11 | yes |
| 9 | miniprep | DelH IIA6 | yes |
| 10 | miniprep | DelH IID2 | yes |
| 11 | E.coli BL21 DE3 older | DelCluster 25-1B + pIK8.6 | no |
| 12 | E.coli BL21 DE3 older | DelCluster 25-1C + pIK8.6 | no |
| 13 | E.coli BL21 DE3 older | DelCluster 25-2A + pIK8.6 | no |
| 14 | E.coli BL21 DE3 older | DelCluster 25-3A + pIK8.6 | no |
| 15 | E.coli BL21 DE3 older | DelCluster 25-3B + pIK8.6 | no |
| 16 | E.coli BL21 DE3 older | DelCluster 25-4 + pIK8.6 | no |
| 17 | E.coli BL21 DE3 older | DelCluster 25-5 + pIK8.6 | no |
| 18 | E.coli BL21 pLys | - | no |
| 19 | E.coli BL21 pLys | DelH C5 + pIK8.6 | no |
| 20 | E.coli BL21 pLys | DelH C7 + pIK8.6 | no |
| 21 | E.coli BL21 pLys | DelH C12 + pIK8.6 | no |
| 22 | E.coli BL21 pLys | DelH G11 + pIK8.6 | no |
| 23 | E.coli BL21 pLys | DelH IIA6 + pIK8.6 | no |
| 24 | E.coli BL21 pLys | DelH IID2 + pIK8.6 | no |
| 25 | miniprep | pIK2.6 | yes |
| 26 | E.coli DH10ß white colony | DelRest + DelH I6B + pIK2.6 | no |
| 27 | E.coli DH10ß 21-09 ACM | - | no |
| + | miniprep | pRB22.4 | yes |
All stocks are clean, only the DelH minipreps as well as the one from pIK2.6 are positive for Indigoidine. Therefore, we identified the source of contamination for the triple clone, which turned blue. We however cannot explain the positive result for the DelH minipreps, which obviously harbour a second plasmid.
Test for Indigoidine Contamination B
Again, all minipreps which were send for sequencing as well as a positive control a negative control and two recently prepared minipreps from other teams were tested for an Indigoidine contamination
| Reagent | Amount [µl] |
|---|---|
| Template | 0.5 or colony |
| RB69 10 µM | 1 |
| VF2 10 µM | 1 |
| OneTaq Master Mix | 5 |
| ddH2O | 2.5 |
| Cycles | Temperature [°C] | Time [s] |
|---|---|---|
| 1 | 95 | 300 |
| 35 | 95 | 30 |
| 53 | 30 | |
| 72 | 90 | |
| 1 | 72 | 600 |
| 1 | 12 | inf |
Result
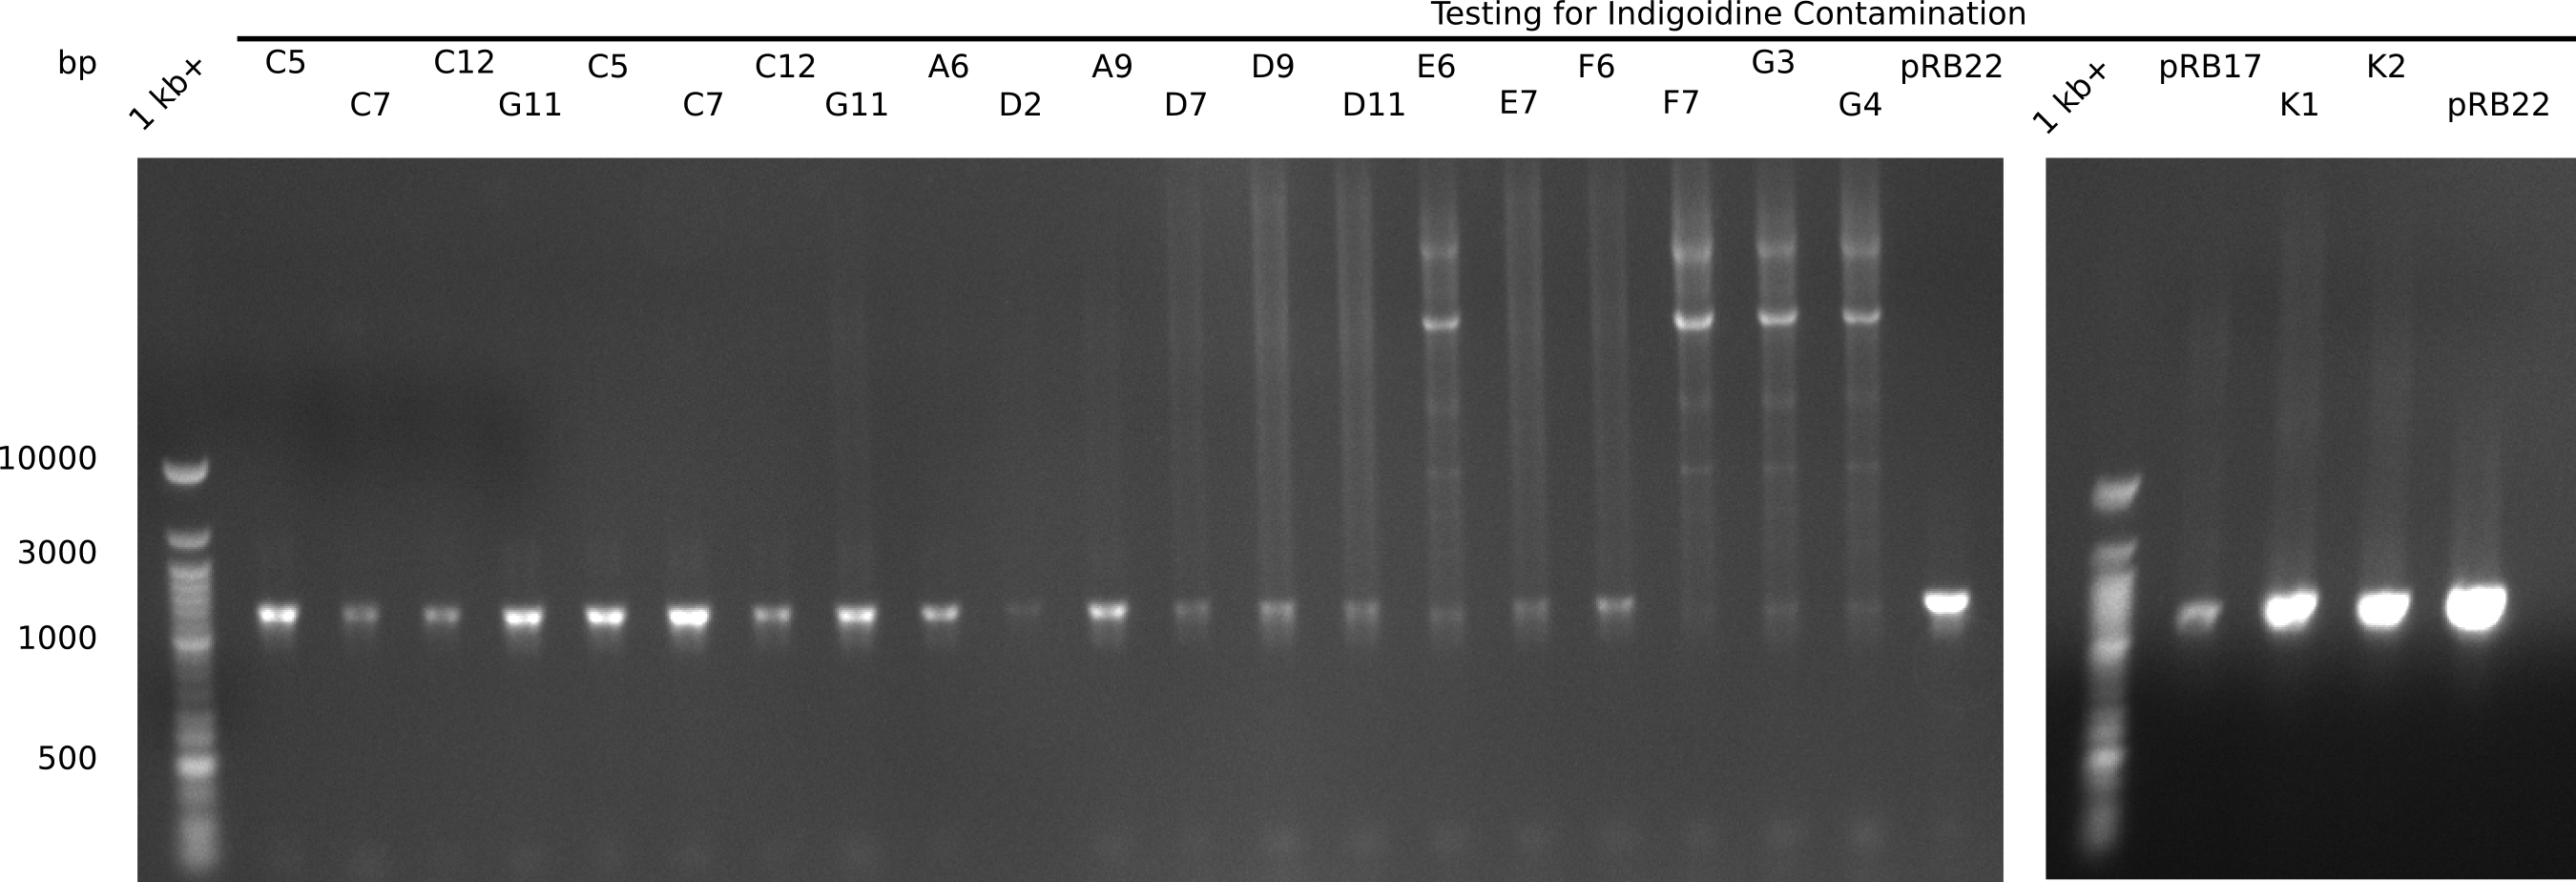
Expected band: 540 bp
| Lane | Cells originating from | Miniprep | Indigoidine band |
|---|---|---|---|
| upper row | |||
| 2 | E.coli BL21 DE3 22-09 | DelH Plasmid I C5 23-09 | yes |
| 3 | E.coli BL21 DE3 22-09 | DelH Plasmid I C7 23-09 | yes |
| 4 | E.coli BL21 DE3 22-09 | DelH Plasmid I C12 23-09 | yes |
| 5 | E.coli BL21 DE3 22-09 | DelH Plasmid I G11 23-09 | yes |
| 6 | E.coli BL21 DE3 22-09 | DelH Plasmid II A6 23-09 | yes |
| 7 | E.coli BL21 DE3 22-09 | DelH Plasmid II D2 23-09 | yes |
| 8 | E.coli BL21 DE3 22-09 | DelH Plasmid III A9 23-09 | yes |
| 9 | E.coli BL21 DE3 22-09 | DelH Plasmid III D7 23-09 | yes |
| 10 | E.coli BL21 DE3 22-09 | DelH Plasmid III D9 23-09 | yes |
| 11 | E.coli BL21 DE3 22-09 | DelH Plasmid III D11 23-09 | yes |
| 12 | E.coli BL21 DE3 22-09 | DelH Plasmid III E6 23-09 | yes |
| 13 | E.coli BL21 DE3 22-09 | DelH Plasmid III E7 23-09 | yes |
| 14 | E.coli DH10ß older | DelH Plasmid III F6 23-09 | yes |
| 15 | E.coli DH10ß older | DelH Plasmid III F7 23-09 | yes |
| 16 | E.coli DH10ß older | DelH Plasmid III G3 23-09 | yes |
| 17 | E.coli DH10ß older | DelH Plasmid III G4 23-09 | yes |
| 18 | E.coli DH10ß chem | Indigoinide Plasmid pRB22 (positive) | yes |
| lower row | |||
| 2 | E.coli DH10ß chem | Indigoinide Plasmid pRB17 (negative) | yes |
| 3 | E.coli DH10ß chem | Indigoinide Plasmid recent miniprep K1 (negative) | yes |
| 4 | E.coli DH10ß chem | Indigoinide Plasmid recent miniprep K1 (negative) | yes |
| 5 | E.coli DH10ß chem | Indigoinide Plasmid pRB22 (positive) | yes |
Surprisingly, all samples show Indigoidine band at ~540 bp. There is a contamination and we have to identify the source!
Test for Indigoidine Contamination C
Again, all minipreps which were send for sequencing as well as positive and negative controls and recently prepared minipreps from other teams were tested for an Indigoidine contamination. using two different primer pairs. Additionally, fake minipreps were performed to identify DNA contamination of buffers.
| Reagent | Amount [µl] |
|---|---|
| Template | 0.5 or colony |
| RB69 10 µM | 1 |
| VF2 10 µM | 1 |
| OneTaq Master Mix | 5 |
| ddH2O | 2.5 |
| Cycles | Temperature [°C] | Time [s] |
|---|---|---|
| 1 | 95 | 300 |
| 35 | 95 | 30 |
| 53 | 30 | |
| 72 | 90 | |
| 1 | 72 | 600 |
| 1 | 12 | inf |
| Reagent | Amount [µl] |
|---|---|
| Template | 0.5 or colony |
| KH05 10 µM | 1 |
| VR 10 µM | 1 |
| OneTaq Master Mix | 5 |
| ddH2O | 2.5 |
| Cycles | Temperature [°C] | Time [s] |
|---|---|---|
| 1 | 95 | 300 |
| 35 | 95 | 30 |
| 53 | 30 | |
| 72 | 90 | |
| 1 | 72 | 600 |
| 1 | 12 | inf |
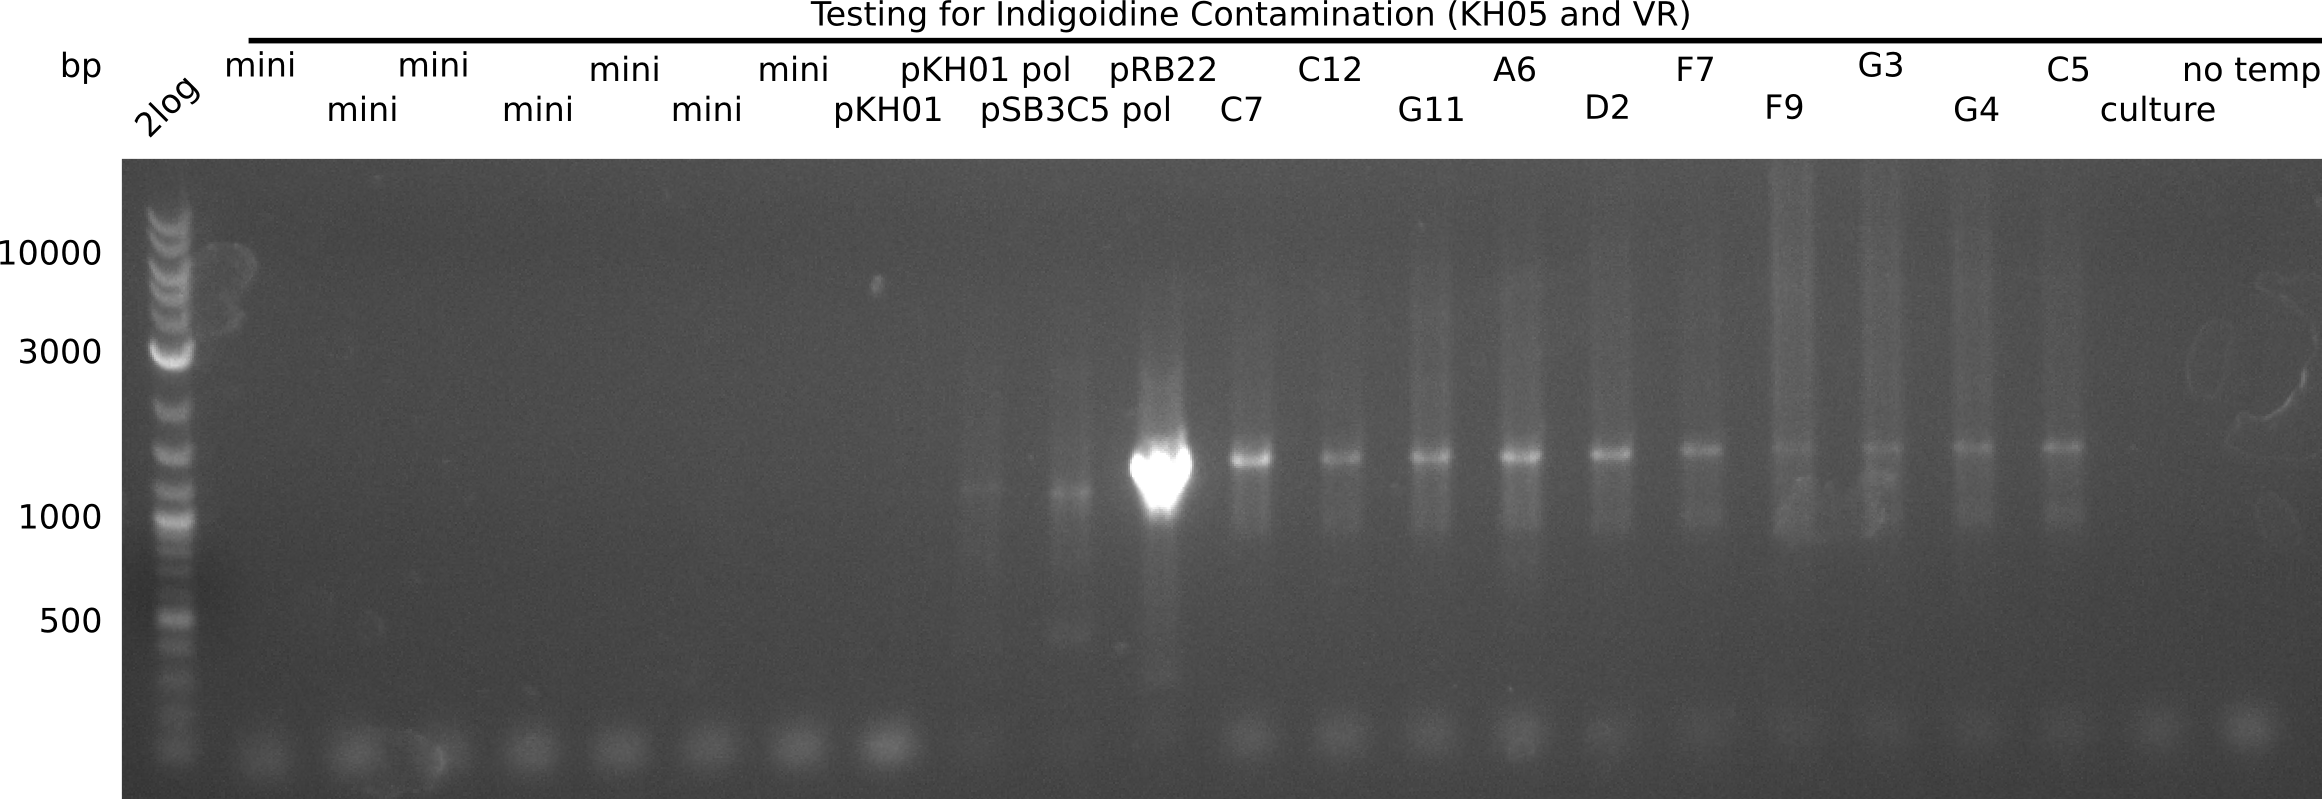
Result
Expected band: ~1 Kb for KH05 and 540 bp for RB69
| Lane | Date | Template | Indigoidine band |
|---|---|---|---|
| KH05 and VR | |||
| 2 | 24-09 (negative) | Fake miniprep: all old | no |
| 3 | 24-09 (negative) | Fake miniprep: P1 aliquot 20-09 | no |
| 4 | 24-09 (negative) | Fake miniprep: fresh P1 | no |
| 5 | 24-09 (negative) | Fake miniprep: fresh P2 | no |
| 6 | 24-09 (negative) | Fake miniprep: P2 aliquot | no |
| 7 | 24-09 (negative) | Fake miniprep: fresh S3 | no |
| 8 | 24-09 (negative) | Fake miniprep: fresh isoprop | no |
| 9 | 21-07 (negative) | pKH1 | no |
| 10 | 21-07 (negative) | pKH1 + new polymerase | yes |
| 11 | 21-07 (negative) | pSB3C5 + new polymerase | yes |
| 12 | - | pRB22 (positive) | yes |
| 13 | 23-09 (negative) | DelH Plasmid I C7 23-09 | yes |
| 14 | 23-09 (negative) | DelH Plasmid I C12 23-09 | yes |
| 15 | 23-09 (negative) | DelH Plasmid I G11 23-09 | yes |
| 16 | 23-09 (negative) | DelH Plasmid II A6 23-09 | yes |
| 17 | 23-09 (negative) | DelH Plasmid II D2 23-09 | yes |
| 18 | 23-09 (negative) | DelH Plasmid III F7 23-09 | yes |
| 19 | 23-09 (negative) | DelH Plasmid III F9 23-09 | yes |
| 20 | 23-09 (negative) | DelH Plasmid III G3 23-09 | yes |
| 21 | 23-09 (negative) | DelH Plasmid III G4 23-09 | yes |
| 22 | 23-09 (negative) | DelH Plasmid I C5 23-09 | yes |
| 23 | E.coli DH10ß culture (negative) | DelH Plasmid II A6 | no |
| 24 | - | - | no |
| Lane | Date | Template | Indigoidine band |
|---|---|---|---|
| RB69 and VF2 | |||
| 2 | 24-09 (negative) | Fake miniprep: all old | yes |
| 3 | 24-09 (negative) | Fake miniprep: P1 aliquot 20-09 | yes |
| 4 | 24-09 (negative) | Fake miniprep: fresh P1 | yes |
| 5 | 24-09 (negative) | Fake miniprep: fresh P2 | yes |
| 6 | 24-09 (negative) | Fake miniprep: P2 aliquot | yes |
| 7 | 24-09 (negative) | Fake miniprep: fresh S3 | yes |
| 8 | 24-09 (negative) | Fake miniprep: fresh isoprop | yes |
| 9 | 04-08 (negative) | 6 maxi HM | no |
| 10 | 15-09 (negative) | pPW06 BCI | no |
| 11 | 19-09 (negative) | ccdB 7 | no |
| 12 | 19-09 (negative) | c.3 7 | no |
| 13 | 19-09 (negative) | c.3 14.B | no |
| 14 | 21-07 (negative) | pKH1 | no |
| 15 | - (positive) | pRB22 | yes |
| 16 | - | - | no |
Amplification with KH05 shows contamination of new polymerase vial (shorter band) as well of DelH minipreps. Interestingly, the tested culture is NOT contaminated.
 "
"

