Team:Stanford-Brown/Projects/BioWires
Introduction
Nanowires are integral to the miniaturization of computing and communication devices, and they are used in everything from quantum computing to mind-machine interfaces. Limited by standard synthesis techniques, they are expensive and impractical. OUR SOLUTION IS DNA.
Imagine if nanoscale electronics could be synthesized, not by enormously expensive and over-sized lithography machines, but by factories visible only by microscope. Imagine that the machinery required were ubiquitous and that the parts within a common gut microbe could be harvested for the nano-fabrication of electrically-active materials. Further imagine that these materials could self-assemble into highly ordered states to form coils, bundles, sheets. What could you build with a system like this?
We present BioWires, a thoroughly tested DNA-based nanowire system engineered to manufacture quasi-one-dimensional metals in PCR tubes.
Mechanism
Our system of choice is DNA, a self-replicating, self-assembling, and often self-catalyzing biomolecule that arranges itself to form long filaments. These chains are held together by hydrogen bonds, and are arranged in a sequence-specific manner. Standard DNA is not conductive enough to build useful constructs, and as such we have modified the basic structure of the molecule for the purpose of enhancing conductivity.
Drawing upon the work of the Ono group (2008, 2011), we have modified DNA by engineering C-C mismatches into short oligonucleotide duplexes. The hole left by a non-bonding pyrimidine pair is selectively filled by a single silver ion. Due to the sequence specificity of DNA, these duplexes can be patterned with varying silver distributions. We have demonstrated that this system is thermodynamically robust, and have identified and bricked sequences which intercalate silver particularly well.
Example of a 2-1-2 ion distribution pattern (BBa_K1218026):
5’ AAA CAT TTA CCA CCT CCT CCA CCT TAT AGT TT 3’
   ||| ||| ||| ••| ••| ••| ••| ••| ||| ||| ||
3’ TTG TTA AAT CCT CCA CCA CCT CCA ATA TCA AA 5’
We propose a variety of applications (wave generation from nanocoils, sheet design for circuit patterning) using DNA origami, and are currently testing whether our strands demonstrate increased conductivity. We have successfully established BioWires as a synthetic biology platform for nanowire assembly, and ultimately hope to show that it is more effective than other systems for nanoscale electronic arrays.
Protocols
Protocols for the various tests can be found here
Silver was added as AgNO3. We used a variety of buffers, and recommend for future teams to avoid chelating agents such as EDTA, which outcompete the DNA for silver ions. We determined that 100mM NaNO3 + 10mM MOPS at pH 7 was the ideal buffer. We also successfully utilized an ammonium acetate buffer for NMR and phosphate buffer for mass spectroscopy. We also note that the silver intercalation can survive isopropanol precipitation as well as buffer exchange.
Lab Notebook
Our experimental notes can be found in the BioWires Lab Notebook: File:Lab Notebook BW.pdf
Our experimental results, updated throughout the project, can be found in the BioWires Objectives document: File:Objectives Document.pdf
Data
The BioWires system underwent rigorous testing thermodynamically, chemically, electrically and visually. The data below illustrate the success of the system.
Thermal denaturation: thermodynamic evidence of silver binding
For this experiment, we sought to unequivocally prove that there was silver uptake by our DNA. To do this, we annealed highly-mismatched oligos of 28 and 32 base pairs in two conditions: Ag+ (silver present) and Ag- (silver absent).
It is known that when double-stranded DNA is heated, it “melts,” or experiences a breakdown of its secondary structure. Beer’s law states that for a fixed volume and molecule, absorbance is proportional to concentration. As DNA melts, the concentration of nucleotides doubles, and the absorbance will increase similarly.
To show intercalation, we hypothesized that for highly-mismatched strands, annealing will only occur in the presence of silver. Conversely, those strands should only show an absorbance increase with temperature if they were annealed with silver. That which does not anneal will not melt.
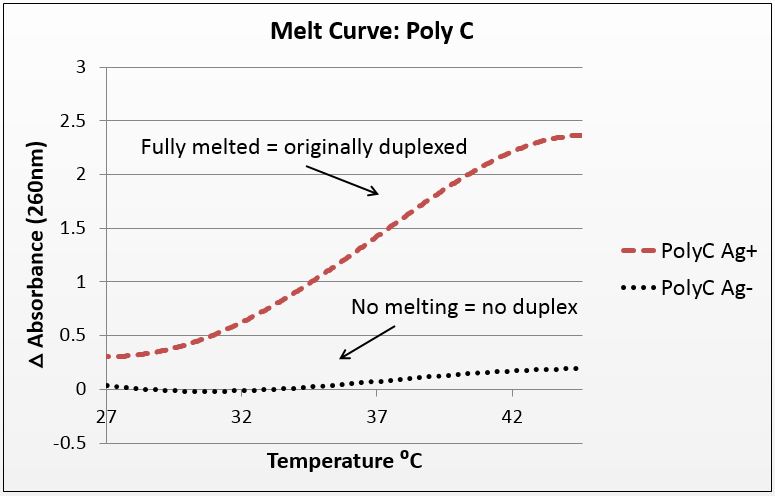
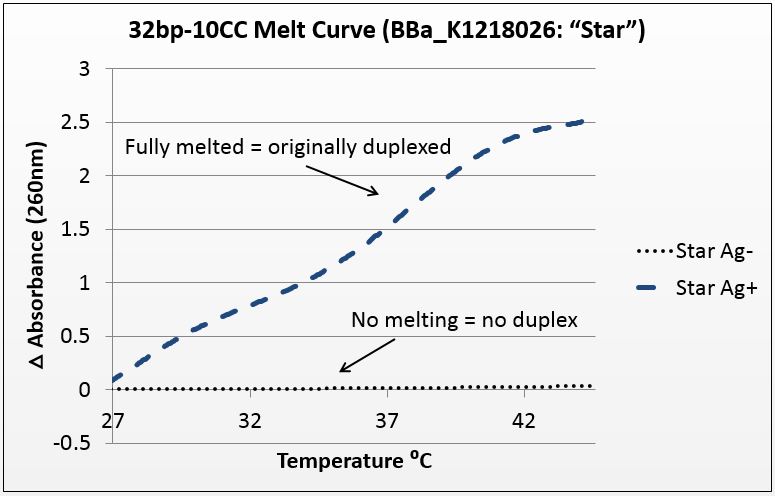
We tested a variety of sequences, but two were selected for their strong annealing efficiency: a 28-base poly-cytosine strand, and a 32bp strand with 10CC mismatches (now BBa_K1218026). Neither of these strands can anneal under normal conditions; they require the addition of silver to have any binding affinity. They were selected to have no self-dimers so as to have a pure reading.
The graphs below are the average of four trials, plotted for unit-less change in absorbance at 260nm (absorbance of dsDNA) over increasing temperature. The spectrophotometer we had access to restricted temperature to a maximum of 45°C, which we factored into the sequence design. 535 data points for each trial were taken across a 20°C temperature difference, rendering the ensuing data quite statistically significant.
It is noted that the absorbance change for the strands exceeds 100%. This is likely due to the "promiscuous" nature of the strands under silver conditions. A 28-base polyC will bind anywhere along the strand to itself or another strand, and thus the observed 2.5-fold change in absorbance suggest that these strands perhaps are binding to pieces of more than one complementary strand.
Figure 1(a): Absorbance of poly-cytosine strand over increasing temperature showing presence of duplex only when annealed with silver, average of four trials with P value of 10^-282 in paired T-Test; Figure 1(b): Absorbance of BBa_K1218026 32bp10CC strand over increasing temperature showing presence of duplex only when annealed with silver , average of four trials with P value of 10^-272 in paired T-Test.
FRET analysis: further evidence of silver binding
We repeated this experimental setup with a FRET-labeled hairpin. FRET-labeling entails the placement of a fluorescent marker on one end of an oligonucleotide and a fluorescence-quenching molecule on the other. When the strand is not annealed, it will fluoresce. When annealed, it will be quenched.
We used a 42-base nucleotide that hairpins to form a 21bp duplex with 8 mismatches. This strand was also expected to melt only when silver was present. Melting is evidence that silver was intercalated, which is demonstrated by an increase in fluorescence (melted strands do not get quenched by the union of fluor and quencher).
We melted DNA that had been annealed with varying levels of silver. 900nM Ag represents a 1:1 molarity between mismatches and silver, which is the expected saturation point of the system. As with the previous test, we showed that the presence of silver allowed duplex formation in mismatch-complementary strands. Our error in this system was higher than we’d hope, but a close investigation demonstrated that these data are statistically significant. In conjunction with other tests, this test adds to the richness of the data confirming the system.
Figure 2: Fluorescence of FRET-labeled hairpin over increasing temperature, average of three trials; 900nM corresponds to a 1:1 ratio between silver and mismatches; p-value in paired T-Test of 900nM against 0nM is 10^-110; the standard deviation is larger than we would like, however a paired T-Test of the lower bound of the 900nM curve (ave-stdev) and the upper bound of the 0nM curve (ave+stdev) yielded a p-value of 10^-54, rendering this test statistically significant.
PAGE: electrical analysis of duplex formation
We hypothesized that a DNA duplex with silver ions would have a different net charge than non-ionized DNA. The resolution of our gels was insufficient to resolve this charge shift, and we are using electrospray ionization mass spectrometry to help visualize instead.
Poly-acrylamide gel electrophoresis (PAGE) was, however, highly successful as producing visual representations of duplex formation, and we used this method to demonstrate that as a 1:1 molar ratio between CC mismatches and silver ions is reached, duplexing occurs. We used a variety of silver concentrations to anneal a 32bp10CC strand (BBa_K1218026).
We tested undersaturation (<1:1) and oversaturation (>1:1) of the system, and showed the duplexing point. Duplexing became visually apparent at the 1.5:1 silver to mismatch ratio, which is slightly higher than expected. Nonetheless confirms both the role of silver in annealing mismatch-complementary strands and that the set point of the system is near a 1:1 ratio.
Figure 3: Molar ratio test-- 10% polyacrylamide gel in MOPS buffer, 32bp10CC strand with increasing molarity of silver (inset above lanes); duplexing begins to be visible at 1.5:1 silver to mismatch ratio-- while this is not ideal, it demonstrates visually the duplexing as it occurs; duplexes are the bands above the rest, indicative of the size difference that comes with duplexing.
Phen Green: chemical analysis of silver uptake
To further prove the uptake of silver by our system, we decided to test the presence of silver directly. We hypothesized that an increase in the number of mismatches should increase the amount of silver taken up by the DNA, which should be visible with the use of metal-sensitive dyes.
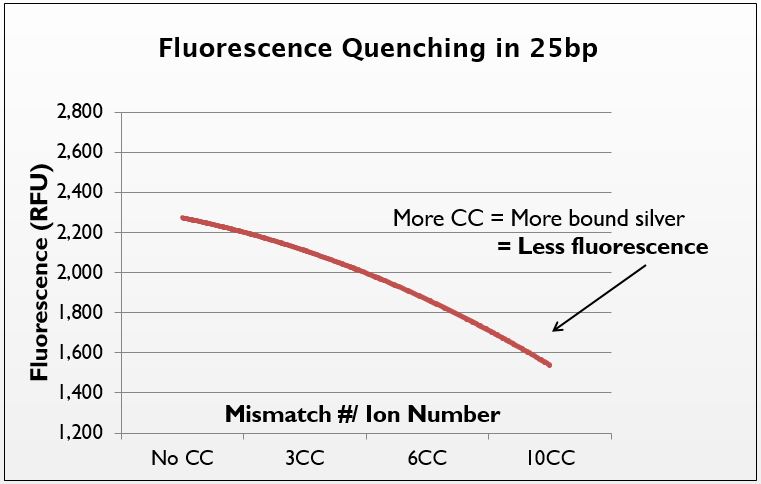
Phen Green is a fluorophore that is quenched when it chelates metal atoms. To test for the presence of silver in our strands, we annealed several sequences with varying numbers of CC mismatches (0CC, 3CC, 6CC, 10CC with silver. We then precipitated these strands out of solution using isopropanol to remove the aqueous silver. When resuspended, Phen Green was added and fluorescence was measured.
We demonstrate that as the mismatch/ion number increases, the fluorescence of Phen Green decreases. Thus, the more mismatches there are, the more silver is taken up by the DNA. This confirms that it is in fact the mismatches that govern silver uptake. There was a high degree of error in the system, though the trend is still apparent. In the future, we would like to try this test with a dye more closely suited to silver-binding, as Phen Green is not the ideal silver-chelator.
Figure 4: Fluorescence quenching in strands of 25bp in length at a wavelength of 532nm; as the number of mismatches increases, the amount of silver post-ethanol precipitation increases, causing the Phen Green fluorescence to quench (fluorescence measured in relative fluorescence units, RFU, relative to water blank); error was large, but still show a visual trend.
TEM: Visual analysis of particle pairing
We used transmission electron microscopy (TEM) to visualize our DNA directly. We hoped to directly identify the presence of silver in our samples. This was easier said than done, yet we used software to analyze the images that suggests that such a feat is possible.
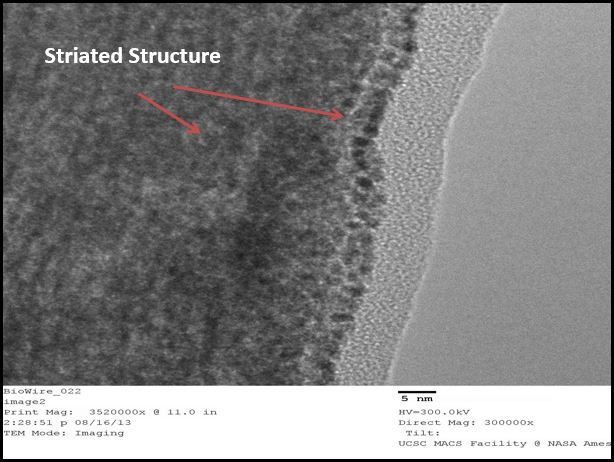
We used a sputtering technique to coat our samples with platinum ions. This allowed for a better visualization of the DNA, though it provided no analytical data (platinum masks the silver). We were excited by the striated nature of the DNA, again confirming that we were able to form duplexes. This DNA was supercoiled due to the sample preparation procedure, but was intriguing nonetheless.
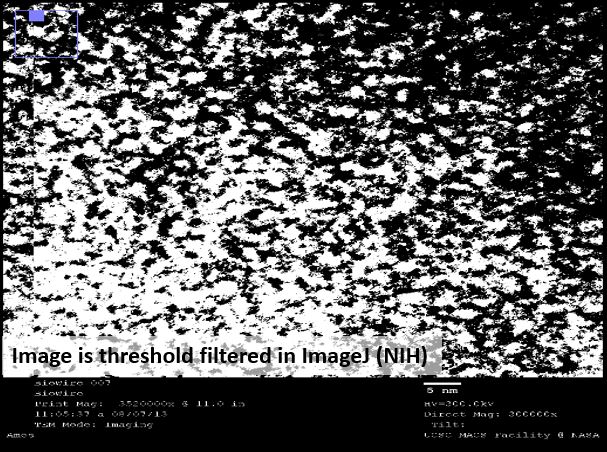
We then used a negative staining technique to visualize different samples to extract information about the structure of the strands. The high resolution images showed a mass of DNA, but we were able to analyze these images using ImageJ, an NIH-provided software for image analysis.
Under TEM, electron-dense areas such as silver are expected to shine brightly, while the carbon-rich, electron-sparse DNA is expected to show up as a dark spot. We used our 32bp10CC strand (BBa_K1218026), which has a silver ion pattern of 2-1-2:
5’ AAA CAT TTA CCA CCT CCT CCA CCT TAT AGT TT 3’
   ||| ||| ||| ••| ••| ••| ••| ••| ||| ||| ||
3’ TTG TTA AAT CCT CCA CCA CCT CCA ATA TCA AA 5’
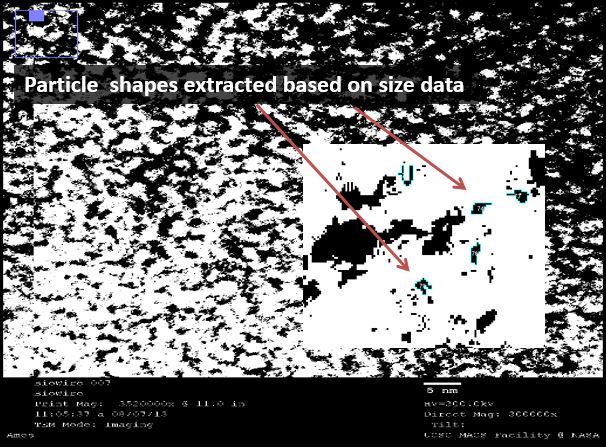
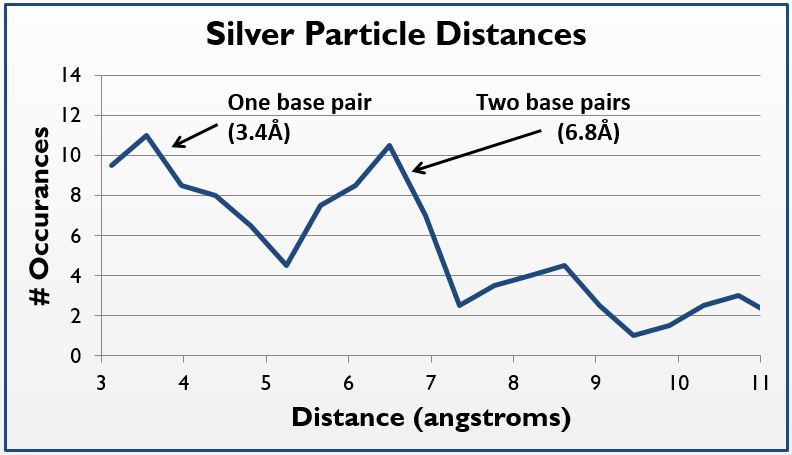
Thus, where silver is present inside the DNA, it should be at a known distance from other particles. With this in mind, we used ImageJ to find all particles within 30% of the silver ion size (2.4Å diameter, or 5.8Å2). We then measured the distance of the center of each particle from nearby particles. As expected, we saw local maxima at the distances representing distances of one and two base pairs (3.4Å and 6.8Å, respectively). We did this measurement manually using the software, and are in the process of using Matlab code to do the same process, albeit at a higher fidelity. Local maxima at integer multiples greater than two base pairs were not observed, likely due to the supercoiling of the DNA.
In sum, by using TEM, we were able to visually demonstrate the silver ion distribution across our samples, providing even further evidence of the robustness of our system.
Figure 5(a) Sputtering raw image: Platinum sputtering TEM image of 32bp10CC strand (BBa_K1218026); of note is the striated pattern in the DNA; Figure 5(b) Negative staining raw image: TEM micrograph taken using negative staining technique of different sample of BBa_K1218026 32bp10CC: dark areas are DNA, light areas are electron-dense areas; Figure 5(c) Negative staining threshold: image threshold of 5(b) taken using ImageJ; Figure 5(d) Particle isolation: using ImageJ, particles were delineated as ranging between 0.45 and 0.75 angstroms squared; Figure 5(e) Paired particle analysis: paired particle counting of 5(d) using ImageJ and manual measurements, though rudimentary, the trend was strong: 124/647 particles were within 2.5-4.5 angstroms of one another, corresponding to roughly the length of 1 nucleotide.
Figure 5(f) Silver particle distance histogram: Using a similar method but a tighter particle size (0.45-0.65 angstroms squared), distances between the centers of particles were counted and placed on a histogram; note local maxima at 3.4 and 6.8 angstroms, 1 and 2 bases in length, respectively; graph is generated as floating average trendline.
Experiments in Progress
In addition to the tests we demonstrated above, we are in the process of running a variety of other assays on our samples. We hope that with the addition of more structural and electrical testing, we will have a fully described system. All of the following tests are currently being prepared or run.
COSY-H NMR: Bond site confirmation
Per the literature (Torigoe 2012), we want to confirm the specific bonding site of the silver as being the N3 nitrogen in the cytosine ring. This will be accomplished by testing a 25bp AT palindrome with 1 CC mismatch in the center of the strand. We have noted that this sample can anneal both in the presence and absence of silver. We will be able to see a shift in the H5-H6 cross peak under COSY-H nuclear magnetic resonance (NMR). We wanted to avoid radioisotopes of nitrogen, and thus elected to test indirectly by looking at the hydrogen atoms in the ring. This test has, however, been established in the literature, are we are certain that a shift in this hydrogen peak will be a simple solution to demonstrate that Ag+ is binding to the N3 site on cytosine.
ESI-MS: Binding efficiency and molar ratio
We are using electrospray ionization mass spectrometry (ESI-MS), a non-fractioning mass spec method for analyzing charged molecules, to directly count the number of silver ions intercalated in the DNA. We want to know what the efficiency is of silver uptake by the highly-mismatched strands. We also want to confirm that a maximum of one ion per mismatch is taken up, and that a 1:1 ratio of silver to mismatches is the idea sample prep procedure.
To do this, we prepared two different sequences. The first was a 32bp10CC strand (BBa_K1218026) with space for 10 silver ions. We will find the number of strands with 10 ions as a proportion to the total number of strands. We also prepared a 25bp AT palindrome with one CC mismatch and annealed with one, two and three equivalents of silver to determine whether a 1:1 silver to mismatch ratio was kinetically sufficient for uptake of silver.
X-ray Crystallography: Solving the structure
We further wished to know whether the intercalation of silver by DNA caused any structural differences in the duplex. We hypothesized that this event could cause either a bulge in the 3.4Å diameter due to ion size or a compression due to ionic forces from the charge shift. We also hypothesized that the intercalation event could alter the tensility of the strand and affect the 10.5bp/helical turn ratio.
To test this, we prepared a 10bp duplex with five CC mismatches and a one base AT overhang to enhance crystallization. This sample is currently being crystallized to determine the structure.
Spin-Coupling NMR: Type of transport
In order to test conductivity, we devised two tests. The first test is to use spin-coupling nuclear magnetic resonance (NMR) to determine the quantum spin state of the silver atoms in the samples, which will enable us to understand the kind of charge transport that is occurring in our strands.
We prepared three samples, each 32base pairs long: 32bpNOCC (0 mismatches), 32bp10CC (10 mismatches, BBa_K1218026), and 32bp26CC (26 mismatches). These samples were annealed with a 30 equivalents of silver, or just larger than a 1:1 silver to mismatch ratio for the strand with the most mismatches. The samples were then desalted, and all aqueous ions were removed. Results will determine both the transport that is occurring as well as how ion proximity affects this transport.
DC Testing: solving for conductivity
We ultimately want to know the conductivity of our samples with respect to standard DNA. To do so, we are devising a protocol to use vacuum filtration on DNA to produce a film, which can then be placed on a direct current (DC) chip that will measure impedance. With this, we will be able to solve for conductivity. We have prepared samples in the same de-ionization method as for spin-coupling NMR, and are experimenting with film production. With this, we will be able to conclusively test the conductivity of our strands. As the conductivity of DNA is a volatile subject, we are taking the utmost care to ensure our method will be immune to confounding variables such as salt charges, strand bundling and extra-DNA silver.
Future Experiments and Applications
In the coming year, we will explore using DNA origami to create intricate networks of conducting DNA strands. We hope to incorporate DNA aptamers for specific device integration, as well as LNA for the "lamination" of any large secondary structures we produce. We posit that coils, bundles and sheets can be constructed with an ordered charge flow to allow for a wide array of applications. The potential of this approach is tremendous, and we hope to push the limits of nanocomputing with our new technology.
BioBricks
We produced two BioBricks for the BioWires project. Each serves a different purpose, but ultimately allows the user to produce mismatch-complementary nucleotide duplexes.
[http://parts.igem.org/Part:BBa_K1218026 BBa_K1218026] Star sequence (32bp10CC): This is a quick-and-dirty brick of the 32bp10CC Star sequence that was the workhorse for the BioWires project. It is extensively documented (see Data, above), and has been conclusively shown to take up silver. The extraction method is a simple PCR and restriction digest, and vast produce vast amounts of product.
Specs:
• DNA duplex 32bp in length
• 10 mismatches, bundled in the center in a 2-1-2 pattern (CCACC…)
• Will only anneal in the presence of Ag+
5’ AAA CAT TTA CCA CCT CCT CCA CCT TAT AGT TT 3’
   ||| ||| ||| ••| ••| ••| ••| ••| ||| ||| ||
3’ TTG TTA AAT CCT CCA CCA CCT CCA ATA TCA AA 5’
[http://parts.igem.org/Part:BBa_K1218022 BBa_K1218022] 100nt Dual-function Hairpin:
This brick produces a 100 base-long mismatch-complementary hairpin in both DNA and RNA. The capacity to produce multiple products renders this brick highly useful. This larger strand is intended to provide a better template for conductivity measurements, as well as a means to mass produce the mismatched strands. Kinetically, a hairpin is the ideal system for annealing as it comes together much more easily, ensuring a higher success rate and better test results. The protocols for DNA and RNA strand extraction are fully outlined on the registry page. The DNA extraction is quite similar to the Star sequence (above), while the RNA extraction involves a different set of restriction enzymes and a transcription step.
Specs:
• DNA hairpin is 100 bases, thus 50bp in length
• RNA hairpin is 113 bases, with 54bp forming a hairpin
• 24 CC mismatches are built into the system (48% and 44% mismatched, respectively)
5' AAA CAC TAC TCC CTC CTA CCC ACC ACA CAA CTC ATC ACT CAA CAC CTC AC__
   ||| •|• ||• |•• •|• •|| ••• |•• |•| •|| •|• ||• |•| •|| •|• •|• |•  |
3' TTT CTC ATC ACC CAC CAT CCC TCC TCT CTT CAC TAC TCA CTT CTC CAC TC--
Conclusions
Through this project, we have been able to demonstrate and characterize the assembly of silver on a mismatched DNA template. While FRET analysis and thermal denaturation test indicate the formation of duplex in the presence of silver, PAGE Gel electrophoresis shows the formation of duplex with an expected molar ration between cytosine mismatches and silver ions. Furthermore, data from Phen Green supports the observed silver uptake by DNA, and visual analysis such as TEM let us look at the structure of the system more closely through paired-particle analysis.
In sum, these strong pieces of evidence allow us to conclude that silver does intercalate in the gap between cytosine-cytosine mismatches of DNA duplexes. More importantly, we foresee a future employment of DNA with repeated Cytosine-Cytosine patterns as a powerful tool to assemble conductive nanowires and nanoscale devices.
Acknowledgements
The BioWires team took on all the literature research, sequence design, sample prep, protocol design and troubleshooting. We also ran all experiments for thermal denaturation, FRET analysis, gel electrophoresis, Phen Green, TEM prep, TEM imaging. We sourced out the NMR, mass spectrometry and x-ray crystalgraphy (below).
We extend our deepest thanks to:
- Dr. Lynn Rothschild, Dr. Gary Wessel, Dr. Joe Shih, Dr. Kosuke Fujisima, and Jesica Navarete — Primary advisors (and countless, tireless hours!)
- Dr. Akira Ono — Discovery of the interaction between DNA and silver, project advice
- Dr. Vittor Pinhiero — Consultation on DNA and metal-binding
- Dr. Ivan Paulino Lima — Advice on Phen Green data
- Dr. Rocco Mancinelli — Feedback on our presentation
- Dr. Jimmy Xu — Conductivity advice, lab space and critical questions
- Dr. Meya Meyyappan — Advice on conductivity test and nanoscale analysis
- Mark Capece, Dr. Corey Liu, Dr. Vesna Mitrovic — NMR tests
- Yifan Zhang — ESI-MS analysis
- Dr. Kyeong Kyu Kim — X-ray crystallography
Seminal Paper by Dr. Ono: Ono, Akira, Hidetaka Torigoe, Yoshiyuki Tanaka, and Itaru Okamoto. "Binding of Metal Ions by Pyrimidine Base Pairs in DNA Duplexes." Chemical Society Reviews 40 (2011): 5855-5866.
 "
"
