Team:Exeter/Modelling
From 2013.igem.org
Modelling
Abstract
We have developed a stochastic model of a colour bio-camera system in E.coli. The model takes the light incident of the bacteria and stochastically estimates the light regulated expression of pigment proteins over time. The population of proteins over time is combined with their absorption spectra and plotted as a surface showing the cell’s absorption spectrum over time. There have been insufficient experimental results to test the model with rates and absorption spectra taken from literature and theoretical conjecture. This prevents us from drawing accurate conclusions. However our preliminary results suggest that a collection of cells will show a reliable colour but with a very high variance between individuals. This causes spatial control to be reduced as individuals are unpredictable. This model requires experimental data to provide an accurate description of our biological system. It provides a well documented framework for future rule-based modelling of similar systems.
Introduction
Our model predicts how the absorption spectrum of a modified E. coli changes over time in response to a given incident light spectrum. It can estimate key properties of the system such as stability, development time of the image, and the balance of colours.
The model is split into three sections. Initially, the reaction of each sensor species to a given incident light spectrum is calculated. This information feeds to the heart of the model, which involves simulating the biochemistry of our designed pathways. Finally the data from the simulation is used to plot the absorption spectrum of the system as it varies with time.
Currently the model is based on results from literature and theoretical conjecture as sufficient experimental results are not available. The motivation for the model is to numerically characterize our bio-bricks for future use and to help us create the first colour coliroid. With experimental results the model could readily be updated to fulfill its original mandate.
Control of bacteria using light has many applications. Di-chromatic control of bacteria has been achieved (REFERENCE) the challenge now is for Tri-chromatic control. Our lab project aims to produce a full colour ‘coliroid’ to demonstrate tri-chromatic control of bacteria. The modified E.coli are designed to carry three independent light sensitive pathways that each control the production of a specific pigment protein.
A reliable computer model is essential for accurate implementation of tri-chromatic control. In the case of the theoretical bio-camera it is required to achieve an even balance of colours and optimum development time. In other applications it is essential to have accurate temporal control over the expression of light regulated genes.
The model is based around KaSim, a stochastic simulator that reads Kappa, a rule based language. Stochastic simulation has the advantage over deterministic simulation because it replicates the random nature of brownian motion in cells more accurately. Rule based languages are particularly useful for biochemical signalling as the physical reactions are readily converted into rules. Matlab is used to process the signal from the incident light to the KaSim simulation. The outputs of the simulation is used in MATLAB to calculate the change in absorbtion spectrum over time.
Modelling Software
The modelling was primarily conducted using two platforms; [http://www.mathworks.co.uk/products/matlab/ MATLAB®] and KaSiM. Together they provide the necessary tools to create an accurate model of our system.
They have been used succesfully by previous iGEM teams, notably the Edinburgh 2010 and 2011 teams, both of which one Best Model at the European Jamboree. This was the primary reason we chose the Kappa language to write our model in.
KaSiM is a [http://en.wikipedia.org/wiki/Stochastic stochastic] simulator that executes files written in [http://www.kappalanguage.org/ Kappa]. Kappa is a rule based modelling language for protein interaction networks. To download KaSiM or the manual please visit the KaSiM page.
KaSiM
KaSiMis a [http://en.wikipedia.org/wiki/Stochastic stochastic]simulator of rule based models written in the Kappa language. It is open source program that uses a variation of the Gillespie's algothrim to generate statistically correct trajectories. We advise you take the time to read the introduction to KaSiM in the KaSiM manual.
Kappa
Kappa is a high level rule-based langauge designed to describe protein interaction networks. Rule-based languages describe a system by a governing set of rules. There is no change in the configuration of the system without the execution of a rule. There are five fundemental parts to the kappa language; agents, tokens, rules, rates and observables. A quick introduction to these concepts is given below. For more detailed information we suggest visiting the [http://www.kappalanguage.org/ Kappa] website or for full examples [http://rulebase.org/ RuleBase] which offers a repository of complete rule based models. We can also reccomend the 2012 Edinburgh iGEM team's Introduction to Kappa which proved useful to us early on.
Agents and tokens
Agents and tokens represent the constituent molecules of a system. Agents are quantified in terms of their population number and are characterised having binding sites. Whereas tokens are quantified in terms of their concentration and do not have binding sites.
Rules
Rules represent specific bio-chemical processes, and involve either tokens, agents or both. Each rule has an initial condition which must be satisfied for the rule to be valid. If the conditions are met, the rule is applied according to the rate.
Rates
Each rule has a specific rate constant which determines the number of times the rule is applied for each instance of the rule.
Observables
Observables determine the output data in terms of either agent count or token concentration.
MATLAB®
[http://www.mathworks.co.uk/products/matlab/ MATLAB®] is a high-level language and interactive environment for numerical computation, visualization, and programming. It can be used to analyze data, develop algorithms, and create models and applications.
The model
The model describes the absorption spectrum of the cell as a function of time and a given time invariant incident light spectrum. This is achieved by calculating the effect of the known light input on the individual light sensitive proteins. This information is then fed into a stochastic simulation of the biological pathways that computes how the population of sensors and pigments vary over time. The total absorption spectrum over time is given by the sum of the product of every protein's population and the corresponding absorption spectrum of the protein. In this section each of these steps in considered in the following subsections.
It will be helpful to read the theory page and the modelling software section of this page before reading further as an understanding of the biological pathways and software is important.
Sensor activation rate calculation
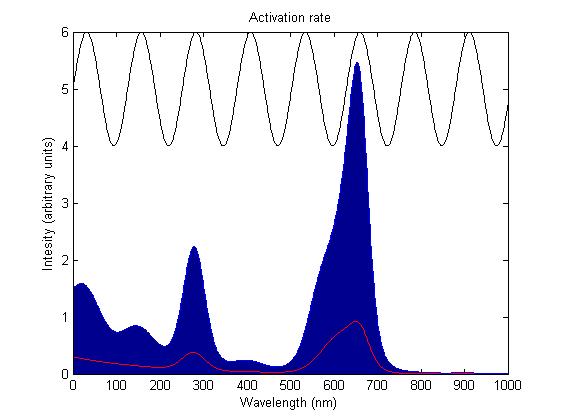
The rule for each sensor is that it is either on or off. In the on state it catalyses the phosphorylation of the primary intermediate sending a signal to the pathway downstream. In the off state it does not. Activation by light either turns a sensor on or off depending on the sensor species; the red and blue light sensors are switched off when activated while the green light sensor is switched on when activated. The activation rate is the forward rate of the rule that governs the state of a sensor. Its counterpart, the deactivation rate is the backward rate of the same rule and is constant. The activation rate is calculated as the integral over all space of the product of the sensor's frequency response with the frequency spectrum of the incident light.

This has two important implications. Firstly it means that the sensor will not be activated by light that has no overlap between its spectrum and the frequency response of the sensor. Secondly there will be a saturation point at high intensity light where increasing the intensity will not appreciably affect the system as the activation rate will dominate the deactivation rate. Causing the sensors to be effectively permanently activated. These characteristics are faithful to the light sensitive proteins we are using and that is why we are using this method.
Biological pathway simulation
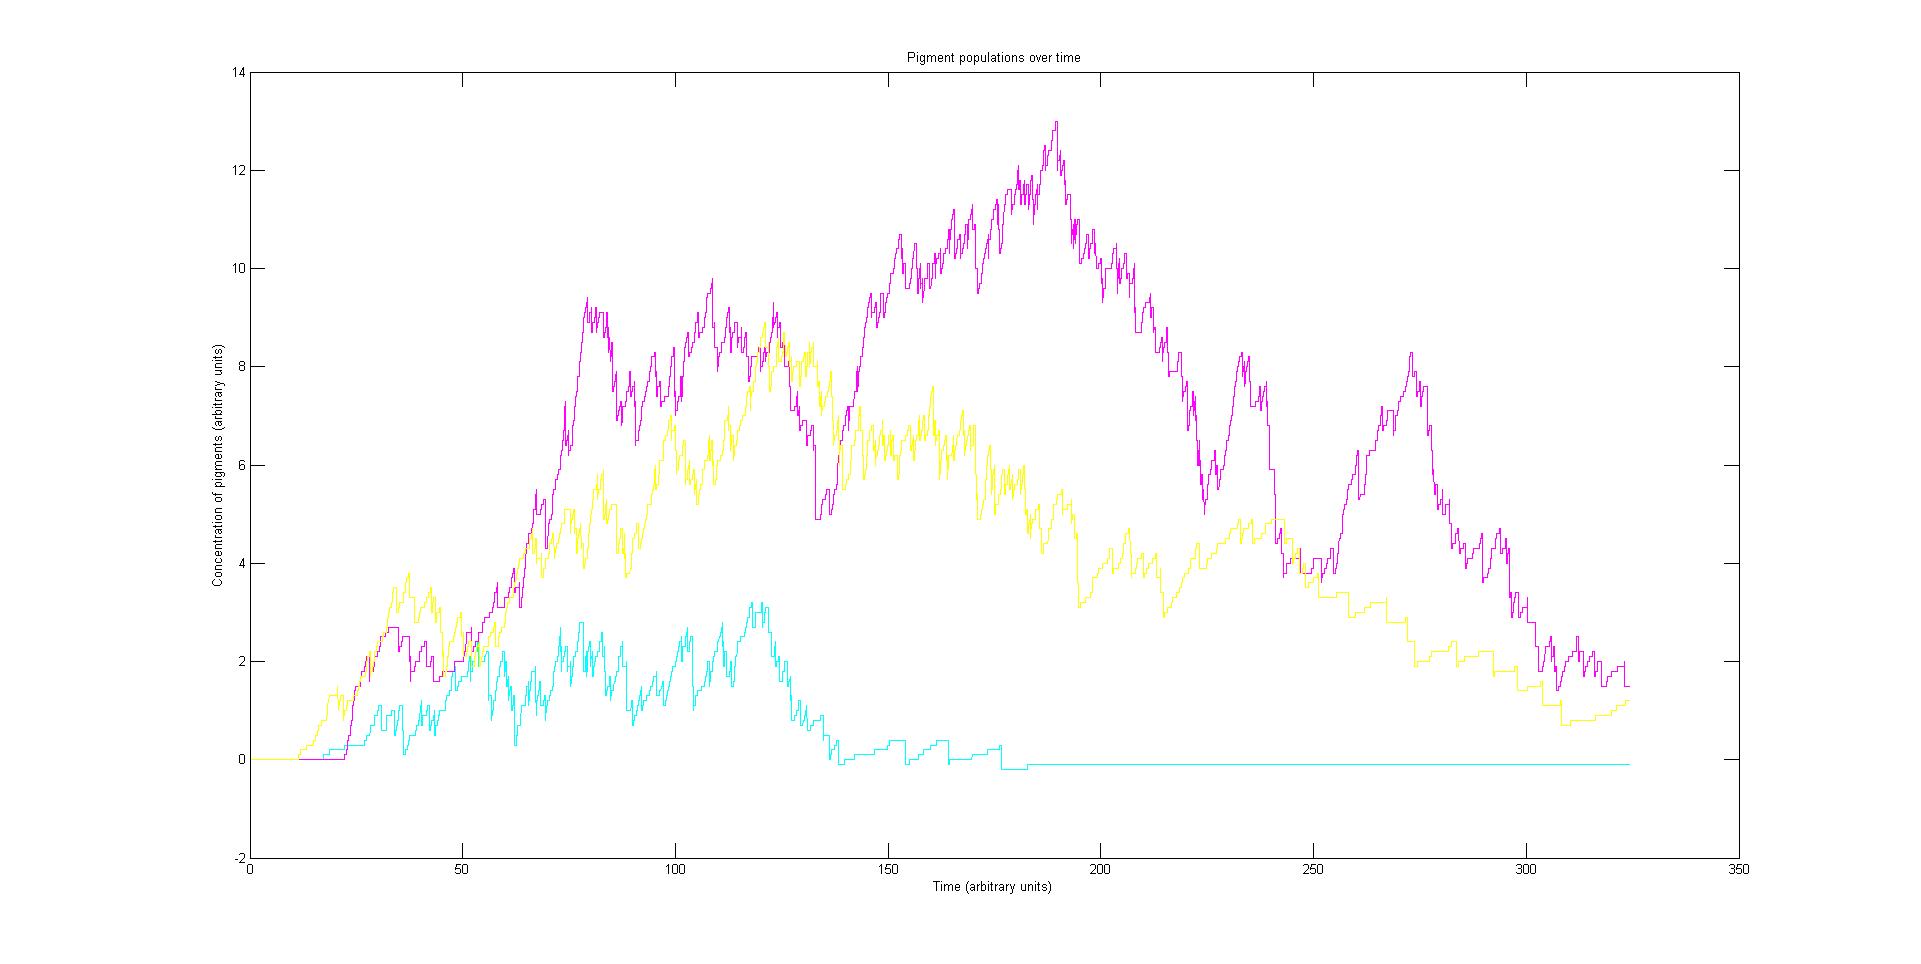
Our stochastic model is comprised of red, green and a blue light activated pathways. With multiple runs it will suggest how stable our tri-chromatic control system might be. What the balance of pigments is likely to be and how long it take for the image to develop. These have implications for future projects that might use a similar system and the model provides a platform for others to build on in the future.
Each pathway is independent in their signalling but share the common resources of the cell. The independent variable is the activation rate of each light sensor species, this is determined by the incident light and affects the expression of pigments, the dependant variable.
The kappa model describes in detail the pathway specific biochemistry and includes simplified descriptions of pathway related biochemistry. For example the controlled transcription and translation of pigment proteins is described in full but the constitutive transcription and translation of light sensor proteins is simplified. The rates were created to recreate experimental results recorded in literature CITATION NEEDED. With experimental results this model can be readily updated to accurately describe our system.
Every species of molecule except DNA is constitutively expressed. Every species of molecule except DNA, RNA polymerase and ribosomes has a spontaneous death rate. Every phosphorylated species has a spontaneous dephosphorylation rate. Every species of molecule is represented as an agent with the exceptions of pigment proteins and ATP.
The initial configuration has only DNA, RNA polymerase and ribosomes to transcribe and translate it. Constitutive expression of light sensors and intermediates are required before the cell can begin to respond to light.
Cell absorption spectrum calculation
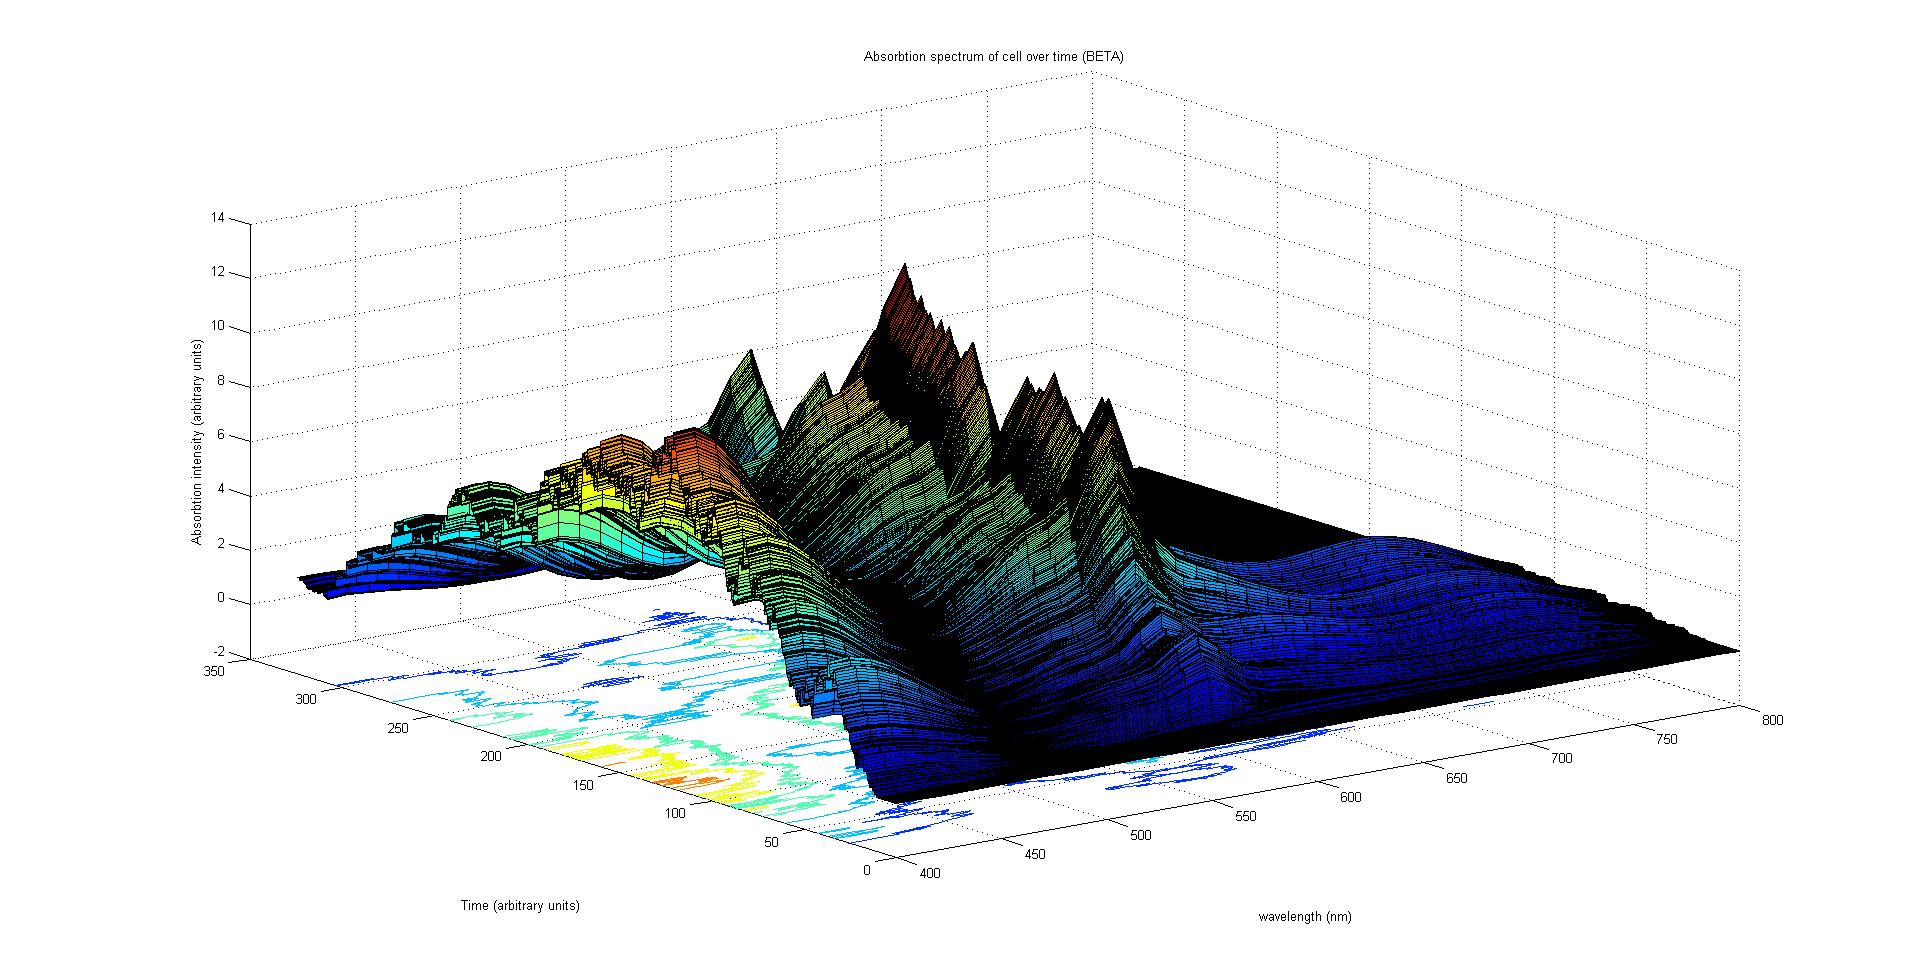
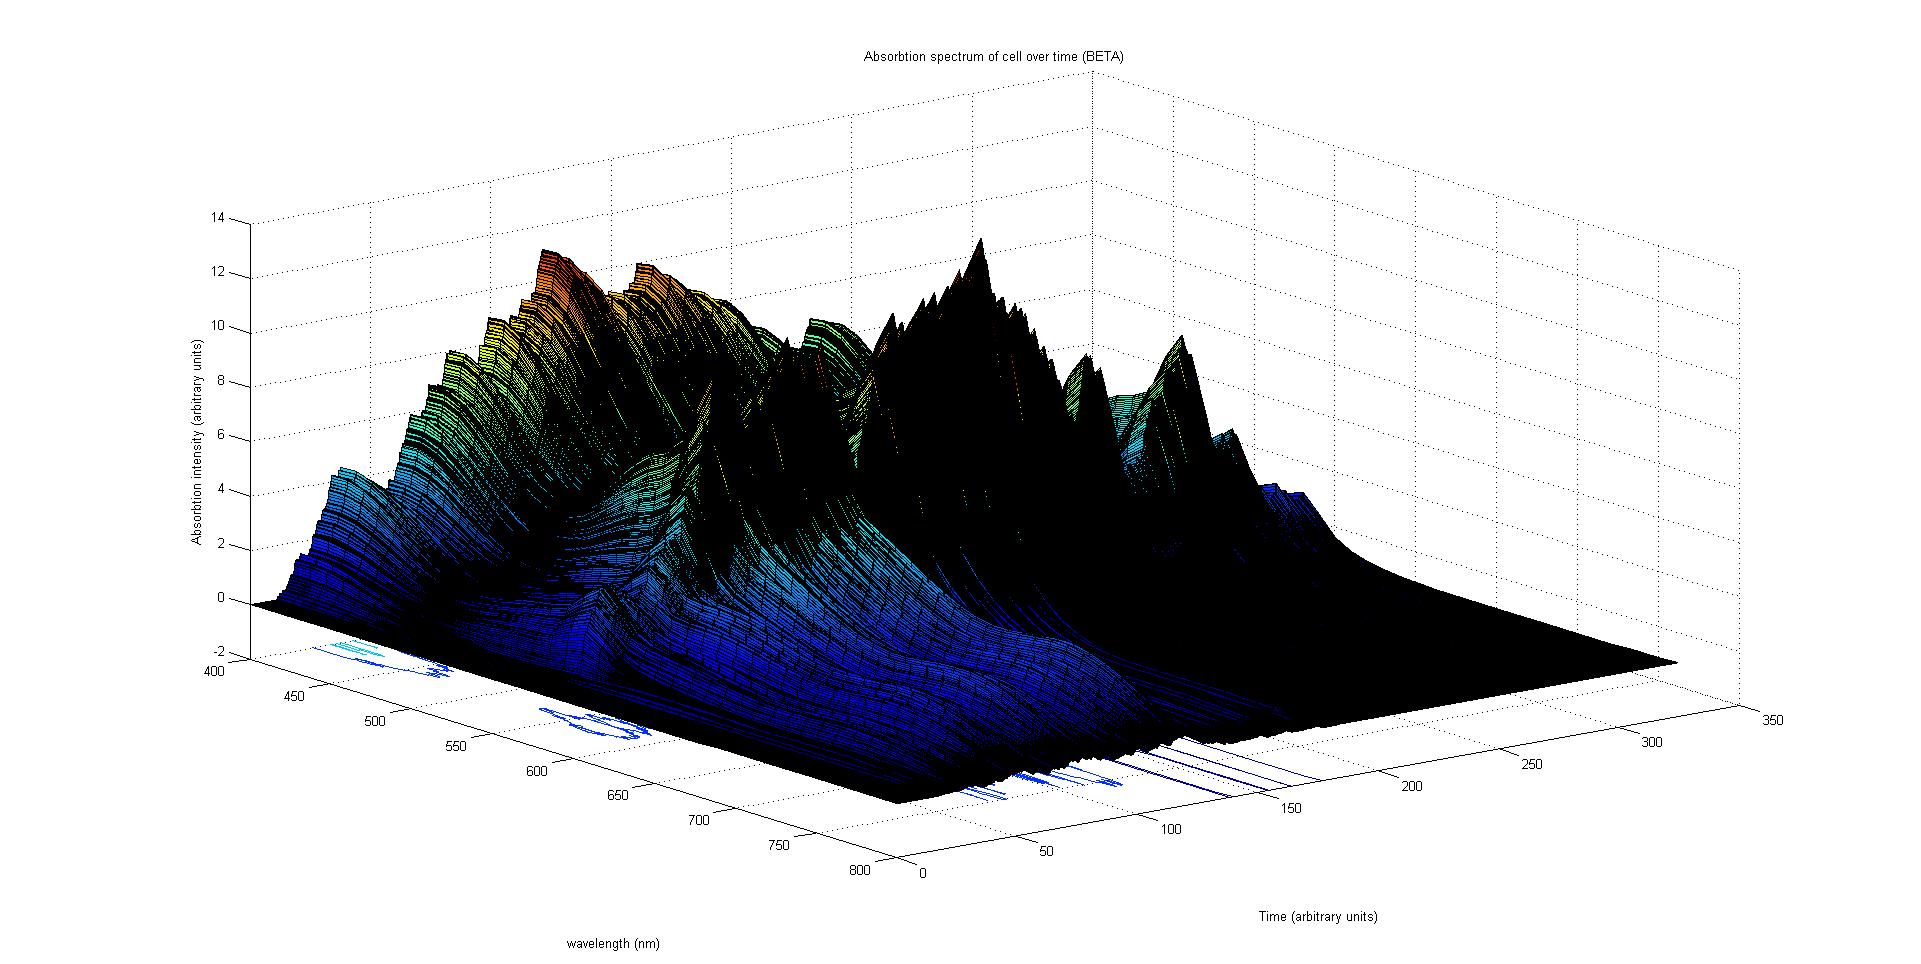
The final output of our model is a surface plot of absorbtion inensity as a function of time and wavelength. It reveals how the absorbtion spectrum and thus the colour of the cell changes with time. It also reveals how long it takes to reach an equilibrium, the moment of greatest contrast and many other important features.
Each protein species has an associated absorption spectrum.
This multiplied by the population of the protein at a point in time gives the contribution of that protein to the total absorption spectrum of the cell at that moment. The sum of the contributions from each protein plus the absorption spectrum of the background cell gives the total absorption spectrum of the cell at that moment. This calculation repeated for every time step gives the total absorption of the cell over time.
Data sources
The model is based on data from literature and theoretical conjecture:
- The stochastic rates are ballpark figures for E.Coli cells and are non specific.
- All absorbtion spectra do not have relative intensity all peak around 1 arbitrary unit.
- The light sensor absorption spectra are estimates of data taken from literature.
- The pigment sensor absorption spectra are estimates of the pigment absoption of colour printer ink.
- The operation of the light sensor is an idealisation of the true relationship between sensor activation and incident light
These will all contribute to the errors in our model
Results and analysis
All results in this section are obtained from the beta version of our model.
Results of model
Preliminary results suggest that the mix of colours in an individual e.coli is very unpredicatable. The model was run multiple times with all sensors having the same activation rate. The mix of colours is very unstable with successive runs producing varying greatly. However the average for a cohort of cells is more stable. It is due to the relatively small number of DNA agents with which the RNAP interacts. This amplifies the effects of chance and causes the instability observed in the model.
This will serve reduce the spacial control of tri-chromatic control system in E.Coli as a predictable average expression of a gene will require many individuals. For a biocamera this will reduce the pixel density and therefore the resolution.
User experience
The activation rate script is simple and deterministic. The results for activation rates are usually very high but that can be counterbalanced by either reducing the intensity of either the sensor absorption spectrum and/or the incident light. The results of this method have two important parrallels with the physical reality making it a working simplified model of sensor activation.
The Stochastic model is very sensitive to changes in rates and initial conditions. With very different behaviour resulting from only small pertubations. This is due primarily to the random nature of the stochastic model compounded by the small number of DNA agents as discussed before.
Sources of error
The model we have created is limited by the lack of experimental data to test and update it. As a result the data used in our model has a variety of sources and these indroduce many sources of error.
Firstly the rules describing the biochemistry of our cell addressed only the reactions unique to our pathway in detail and related reactions in a simplied manner. A small number of external conditions were addressed such as the competition for RNA polymerase and Ribosomes between our pathway and other activity in the cell. This however means that the model does not take into account any interference from other cell activity. This is a source of error in our pathway simulation, however it is unlikely to the primary source of error.
Secondly the absorbtion spectra for all proteins and the background cell do not have their relative absorbtion intensities. Furthermore the spectra of the light sensors are approximations to data in literature, but the blue light sensor's absorbtion is that of LOVtap not YF1. LOVtap and YF1 are both light oxygen voltage blue light receptors and therefore we expect them to have a similar absorbtion spectrum. The spectra of the pigments are approximations of the standard cyan, magenta and yellow pigments used in colour printers. Therefore the pigment absorbtion spectra only represent the ideal colour of our pigments. This final point does not affect our rule-based stochastic simulation. The inaccuracy in our spectra causes an uncertainty in the calculation of activation rate and a greater uncertainty in the calculation of the cell's absorbtion.
Thirdly the nature of the activation of the light sensors is unknown and the method we use to calculate the activation rate is likely to be errenous. This introduces another source of error in the calculation of sensor activation rates.
Fourthly the rates in our rule-based model are ballpark figures taken from literature and are not specific to the reactions in our model. This is the primary source of error in our pathway simulation.
Conclusions
This section will contain our conclusions about the model
The multitude and magnitude of error sources in our model mean that no accurate conclusions about our synthetic biological system can be drawn from it.
Future
This section will contain our opinions about the future of the model
Our model serves as a framework for modelling tri-chromatic control in E.coli. The foremost action to be taken in the future is the successful synthesis and testing of a working tri-chromatic control system. The experimental results could be used to update and test the model.
Further improvements include allowing the input signal to change with time. This means updating the rates in the kappa model while the model is being run by KaSiM. This requires either greater integration between KaSiM and mathematics programs like MATLAB or a more powerful mathematics suite in KaSiM.
Bibliography
Edinburgh iGEM 2010 https://2010.igem.org/Team:Edinburgh/
KaSim3 reference manual (release 3.4) Jérôme Feret and Jean Krivine1 KappaLanguage.org
J Mol Biol. 2011 Jan 14;405(2):315-24. doi: 10.1016/j.jmb.2010.10.038. Epub 2010 Oct 28. Multichromatic control of gene expression in Escherichia coli. Tabor JJ, Levskaya A, Voigt CA.
Department of Pharmaceutical Chemistry, University of California, San Francisco, CA 94158, USA.
J Mol Biol. 2012 Mar 2;416(4):534-42. doi: 10.1016/j.jmb.2012.01.001. Epub 2012 Jan 8. From dusk till dawn: one-plasmid systems for light-regulated gene expression. Ohlendorf R, Vidavski RR, Eldar A, Moffat K, Möglich A. Source
Humboldt-Universität zu Berlin, Institut für Biologie, Biophysikalische Chemie, Invalidenstraße 42, 10115 Berlin, Germany.
277, 27 October 2011, Pages 77–87
Modular Modelling in Synthetic Biology: Light-Based Communication in E. coli ☆ The Second International Workshop on Interactions between Computer Science and BiologyDonal Stewart E-mail the corresponding author DemonSoft Ltd, Edinburgh, United Kingdom John Roger Wilson-Kanamori E-mail the corresponding author
School of Informatics, University of Edinburgh, Edinburgh, United Kingdom
Applications of the Kubelka-Munk Color Model to Xerographic Images Final Report Kristen Hoffman Center for Imaging Science Rochester Institute of Technology May 1998
 "
"


