Team:Heidelberg/Templates/DelH week13
From 2013.igem.org
Contents |
22-07 - 28-07-13
Amplification of Backbone pSB6A1-lacZ-mRFP
Miniprep
- 4 colonies were picked and inoculated in 4x 3 ml LB Amp
- Incubated ON at 37°C
- 4x 3 ml were distibuted in 5x 2 ml eppis and centrifuged
- Supernatant was discarded, cell pellet was used for miniprep
- Two minipreps were pooled into 1 column and 180ipreps on another one (every eluation was performed with 50 µl)
Result
- 5 µl were loaded on a gel
- => Gel was not succesful
- => Miniprep didn't work and has to be repeated
Glycerol Stock
Glycerol stocks were prepared from liquid culture not used for miniprep.
Repetiotion of Miniprep
4x 2 ml of Top10 pSB6A1-lacZ-mRFP were minipreped with the Qiagen kit.
Result
| Sample | Performed | Concentration (Nanovue) | P2 Buffer |
|---|---|---|---|
| pSB6A1-lacI-mRFP (1) | upstairs | 88 ng/µl | from upstairs |
| pSB6A1-lacI-mRFP (2) | iGEM lab | 62 ng/µl | new |
| pSB6A1-lacI-mRFP (3) | iGEM lab | 104 ng/µl | new |
| pSB6A1-lacI-mRFP (4) | iGEM lab | 60 ng/µl | old |
- Of each miniprep, 3 µl were loaded
At 3Kb and at 8 Kb, there are bands visible.
- => Minipreps are fine.
PCR Conditions BB.W13.A
| Reagent | Backbone | Backbone |
|---|---|---|
| Template | Miniprep A | Miniprep A |
| Primer fw 10 µM | HM11 | HM11 |
| Primer rev 10 µM | HM12 | HM12 |
| Phusion Flash Ready Mix | 10 µl | 10 µl |
| ddH2O | 7 µl | 7 µl |
| DMSO | - | - |
| Cycles | Temperature [°C] | Time [s] |
|---|---|---|
| 1 | 98 | 10 |
| 12 | 98 | 1 |
| 68 (touchdown - 0,5) | 5 | |
| 72 | 1:15 min | |
| 18 | 98 | 1 |
| 67 | 5 | |
| 72 | 1:15 min | |
| 1 | 72 | 5 min |
| 1 | 4 | inf |
Result
Expected band: 5 Kb
Specific expected band at 5 Kb
- => Fragment was cut and gel isolated. A: 22 ng/µl, B: 25 ng/µl
Generation of DelH Plasmid 26-07
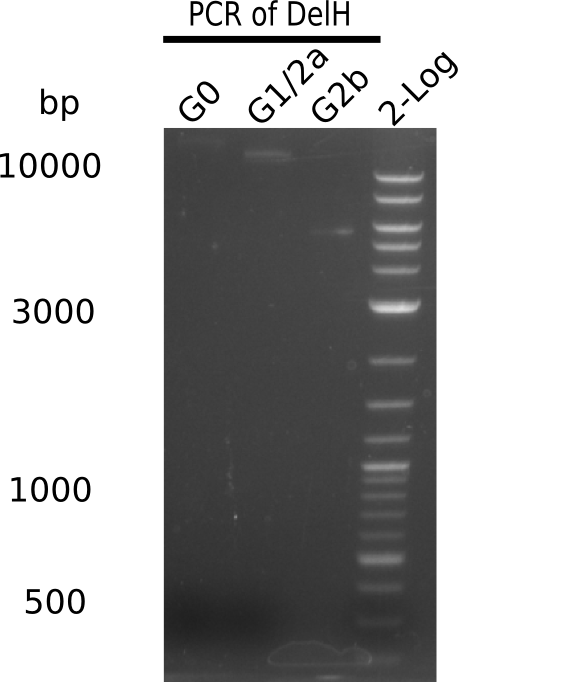
Analysis of G0, G1 & G2b on Gel
| Fragment | Size | Amount used [µl] | Amount used [ng] (by view) | Left for Gibson [µl] = [ng] | Concentration [ng/µl] |
|---|---|---|---|---|---|
| G0 | 18 Kb | 8 | 5 | 52 = 35.5 | 0.68 |
| G1 | 14 Kb | 8 | 10 | 12 = 15 | 1.25 |
| G2b | 5 Kb | 8 | 10 | 12 = 15 | 1.25 |
Overview on Fragments
| Fragment | Concentration [ng/µl] |
|---|---|
| G0 | 0.68 |
| G1 | 1.25 |
| G2b | 1.25 |
| BB A | 22 |
| BB B | 25 |
Gibson Assembly
| Assembly # | Fragments | Amount used [µl] |
|---|---|---|
| 1 |
|
|
| 2 |
|
|
| 3 |
|
|
- Incubated 1 hour at 50°C
- Stored ON at -20°C
Purification of Gibson Mix
- Purification performed with the long range gel extraction kit (because of 23 Kb size) of the entire sample (20 µl).
- Performed the purification by calculating with 100 mg DNA (gel- step1)
- Washing step with QX1 was not performed, because it is only to remove the residual agarose and we don't want to loose any DNA.
Electroporation
- Electroporation into freshly prepared electrocompetent cell following the protocol
- Streaked on LB Amp plates and incubated ON at 37°C
Result
There were no colonies on any of the plates. Ginson assembly and electroporation have to be repeated.
Generation of DelH Plasmid 28-07
NEB Protocol for Gibson Assembly
- Optimized cloning efficiency is 50–100 ng of vectors with 2–3 fold of excess inserts. Use 5 times more of inserts if size is less than 200 bps. Optimized cloning efficiency is 50-100 ng of vectors with 2-3 fold of excess inserts. Use 5 times more of inserts if size is less than 200 bps.
- Electrocompetent Cells Transformation Protocol:
- Thaw electrocompetent cells on ice.
- Transfer 50 μl of electrocompetent cells to a pre-chilled electroporation cuvette with 1 mM gap.
- Dilute assembled products 3-fold with H2O prior electroporation. This can be achieved by mixing 5 μl of assembled products with 10 μl of H2O. Add 1 μ l of the diluted assembly product to electrocompetent cells.Mix gently by pipetting up and down or flicking the tube 4–5 times. Do not vortex. Place the mixture on ice for 30 minutes. Do not mix.
- Mix gently by pipetting up.
- Once DNA is added to the cells, electroporation can be carried out immediately. It is not necessary to incubate DNA with cells.Add 950 μl of room temperature SOC media* to tubes.
- Add 950 μl of room temperature SOC media to the cuvette immediately after electroporation.
- Place the tube at 37°C for 60 minutes. Shake vigorously (250 rpm) or rotate.
- Warm selection plates to 37°C.
- Spread 100 μl of the cells onto the plates.
- Incubate overnight at 37°C.
Gibson Assembly
| Fragments | Concentraion [ng/µl] | Amount [µl] |
|---|---|---|
| G0 | 0.68 | 9 |
| BB (8.8) | 22 | 1 |
| Gibson Master Mix | 2x | 10 |
- Incubated 1 h at 37 °C in thermocycler
- 5 µl of mix added to 10 µl ddH2O and stored at -20°C
- 10 µl stored for isoprop purification
Result
Remaining 5 µl were checked on a gel:
Expected band: 23 Kb
No product visible of correct size. There is a light band at ~1.5 Kb.
- => Most probably too little DNA loaded.
Electroporation
- Electroporation into freshly prepared electrocompetent cell following the protocol
- Streaked on LB Amp plates and incubated ON at 37°C
Result
There were few colonies on the plates. Red colonies were picked and screenied by colony-PCR, but none of them was positive. The Gibson assembly has to be repeated.
Preparation of Electrocompetent E.coli DH10ß
According to the protocol
Amplification of Backbone pSB6A1-lacZ-mRFP
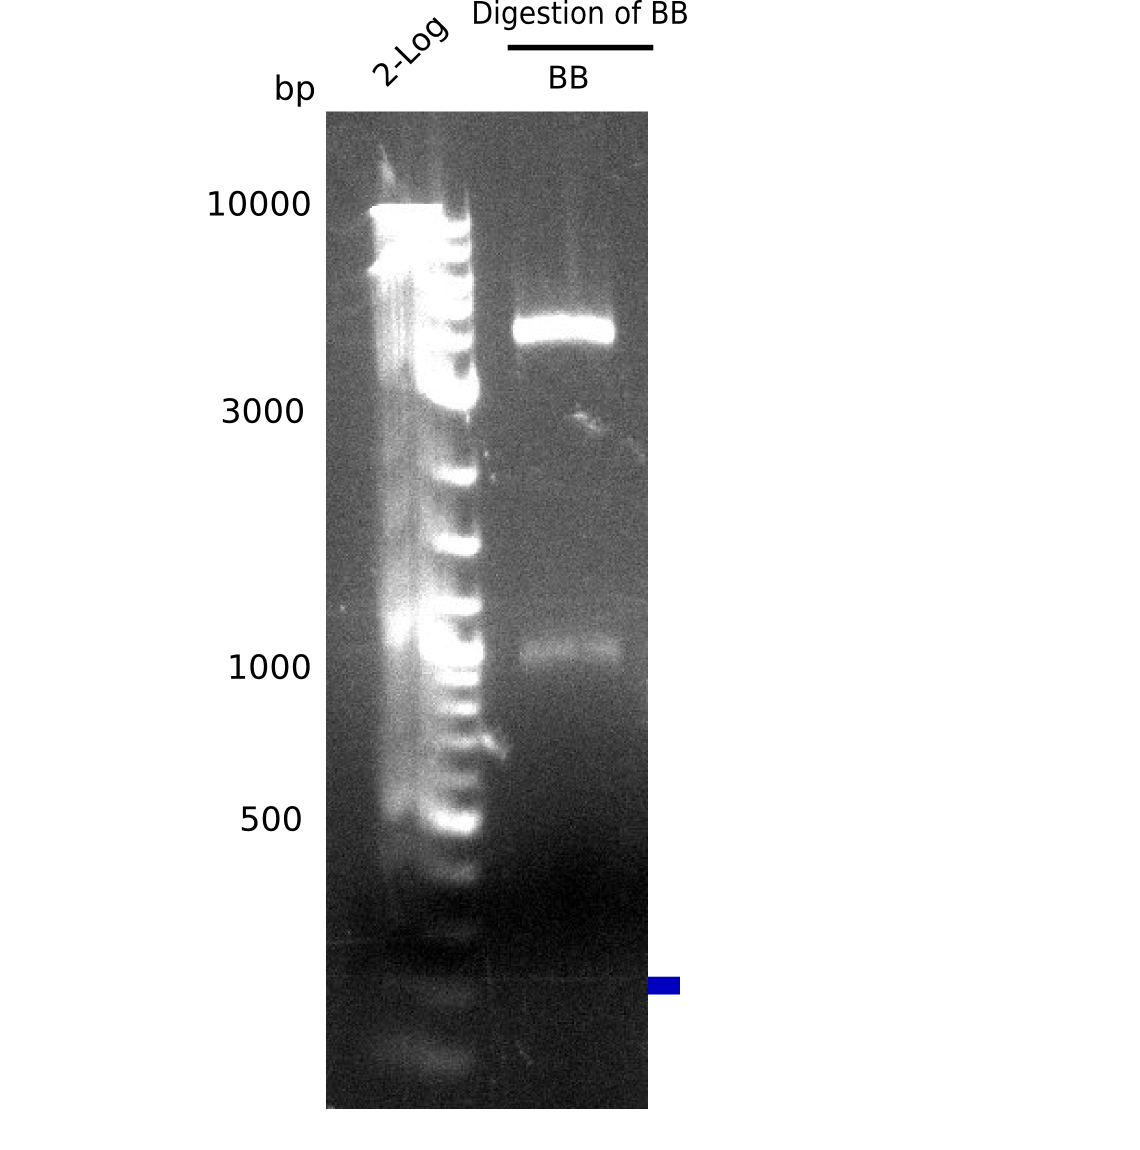
Test Restriction Digest
| Fragment | DNA [µl] | H2O [µl] | Enzymes [µl] | Buffer 3.1 [µl] |
|---|---|---|---|---|
| BB A (22 ng/µl) | 8 = 200 ng | 9 | NotI: 1 | 2 |
- Incubated 1.5 h at 37 °C
Result
Expected bands: 4 Kb & 1 Kb
Gel shows shows expeted bands at 4 Kb and 1 Kb.
- => Backbone is fine.
 "
"


