Team:DTU-Denmark/Kinetic Model
From 2013.igem.org
Contents |
Kinetic model of the Pathway
We are applying kinetic modeling to investigate how long it takes a cell to produce a certain amount of nitrous oxide.
The reactions of the pathway we are trying to integrate in E. coli are:
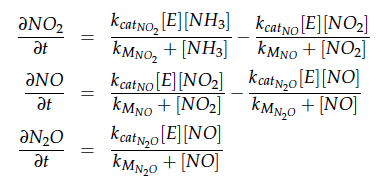
The iGEM team from Taipei in 2012 was using Nir and Nos in their project as well and did some kinetic modeling based on literature research. To describe product formation by the enzymes they used the Michaelis-Menten approach:
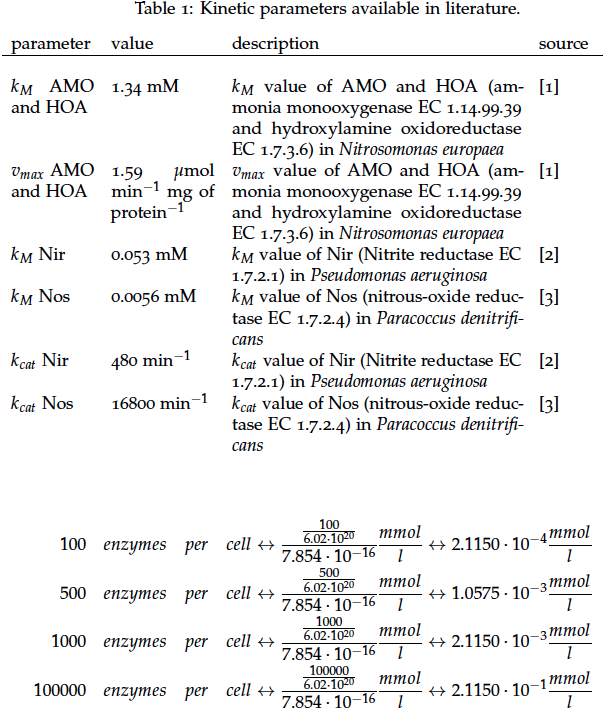
Some of the necessary parameters can be found in literature, they are listed in Table 1.
It is necessary to know or estimate the enzyme concentration if kcat values are used. The Taipei Team did this with another kinetic model, but we are missing information about many of this models parameters so the result would be very inexact. Therefore we chose to use four different enzyme concentrations in our model: 100, 500, 1000 and 100 000 enzymes per cell corresponding to low, medium, high and very high concentrations of enzyme. These numbers are based on [1].
We also need to know how much ammonia the water we want to treat will contain. The ammonia concentration in different types of waste water is given in [2] as 1 mg/l in aquatic cultures, 10 mg/l for municipal waste water and more than 100 mg/l for industrial waste water. So the concentrations we want to look at in our model are: 1 mg/l, 10 mg/l, 100 mg/l and 500 mg/l ammonia.
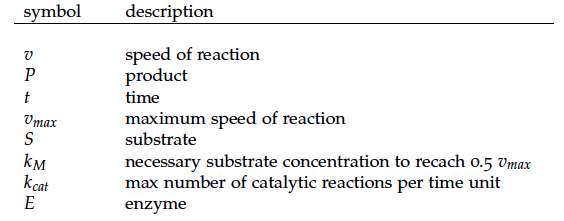
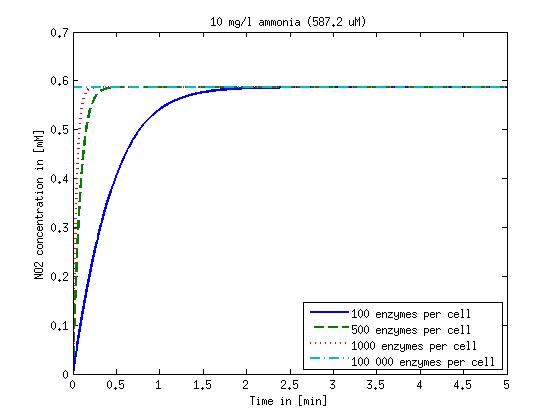
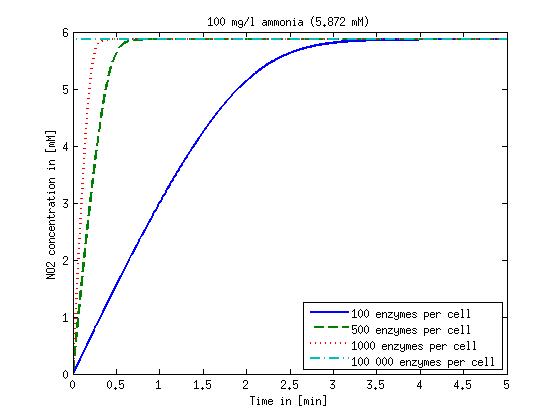
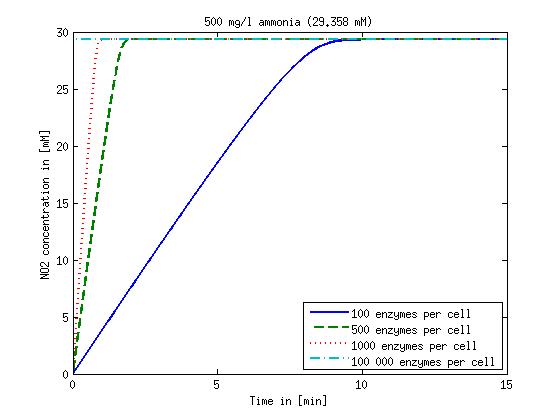
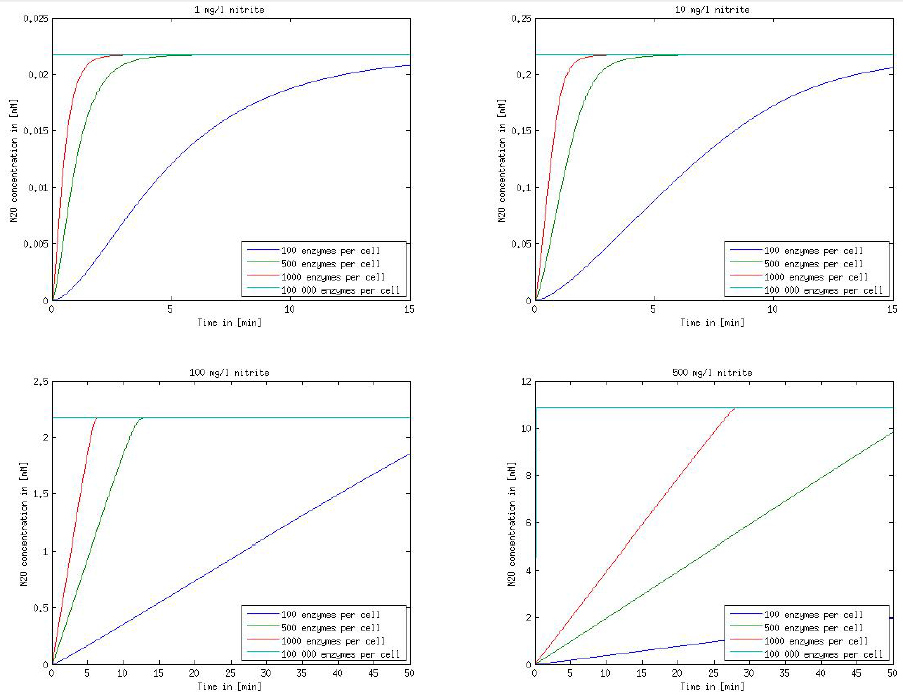
The modeling was done in MATLAB using the Systems Biology Toolbox [3] and the models equations are given below. Results are shown in Figures 1-2.
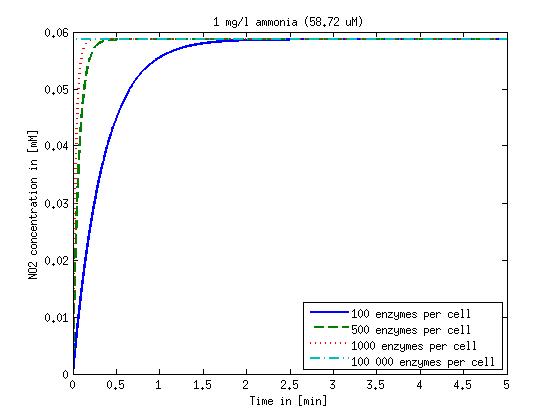
Figure 1: Kinetic modeling of Mutant 1. Nitrite concentration over time based on kinetic parameters found in literature and for different enzyme and substrate (here NO2) concentrations.
Figure 2: Kinetic modeling of Mutant 2. Nitrous oxide concentration over time based on kinetic parameters found in literature and for different enzyme and substrate (here NO2) concentrations.
References
[1] Y Ishihama, T Schmidt, J Rappsilber, M Mann, FU Hartl, MJ Kerner, and D Frishman. Protein abundance profiling of the escherichia coli cytosol.BMC genomics, 9, 2008.
[2] T.C. Jorgensen and L.R. Weatherley. Ammonia removal from wastewater by ion exchange in the presence of organic contaminants. Water Research, 37:723–1728, 2003.
[3] Systems biology toolbox for matlab: A computational platform for research in systems biology. Bioinformatics, 22(4):514–515, 2006.
 "
"


