Team:Heidelberg/Indigoidine
From 2013.igem.org


Indigoidine. Proving Modularity of NRPS by Shuffling Domains.
Lorem ipsum dolor sit amet, consetetur sadipscing elitr, sed diam nonumy eirmod tempor invidunt ut labore et dolore magna aliquyam erat, sed diam voluptua. At vero eos et accusam et justo duo dolores et ea rebum. Stet clita kasd gubergren, no sea takimata sanctus est Lorem ipsum dolor sit amet.
Week 5
At the beginning of our wetlab phase, we wanted to transform E. coli cells with plasmids containing an indigoidine synthetase and a 4'-Phosphopanthetheinyl-transferase (PPTase) to see whether we can observe blue colonies on our plates as this has been reported by groups working with indigoidine synthetases (<bib id="Takahashi2007"/><bib id="Brachmann2012"/>).
We focused on the work of Marius Müller et. al. in 2012 (<bib id="Muller2012"/>). The group used the bpsA indigoidine synthetase (blue pigment synthetase A) from S. lavendulae ATCC11924 (<bib id="Takahashi2007"/>) and the PPTase svp from S. verticillus ATCC15003 (<bib id="Sanchez2001"/>) to establish both a fluorescence and a chromophore based reporter assay for mammalian cells by expression of bpsA and svp which results in production of a blue pigment/ fluorophore. The group kindly supported us by sending two of their constructs, namely the pET derived expression vectors pMM64 carrying the bpsA indigoidine synthetase with an ampicillin resistance gene and pMM65 carrying svp and a kanamycin resistance gene. Both bpsA and svp rom the Fussenegger lab are codon-optimized versions for expression in eukaryotic cell lines.
We transformed competent E. coli TOP10 with each plasmid to prepare plasmid DNA and perform a cotransformation of an E. coli Rosetta strain with both plasmids. Transformed cells which carry both plasmids should produce the blue pigment indigoidine.
Unfortunately, there were no blue colonies after the co-transformation. We repeated the experiment under various growth conditions; i.e. we used different incubation temperatures, light conditions, shaking and addition of ascorbic acid, which was reported to stabilize indigoidine in liquid cultures (<bib id="Muller2012"/>).
Week 6
Cras justo odio, dapibus ac facilisis in, egestas eget quam. Donec id elit non mi porta gravida at eget metus. Nullam id dolor id nibh ultricies vehicula ut id elit.
Week 7
Cras justo odio, dapibus ac facilisis in, egestas eget quam. Donec id elit non mi porta gravida at eget metus. Nullam id dolor id nibh ultricies vehicula ut id elit.
Week 8
Cras justo odio, dapibus ac facilisis in, egestas eget quam. Donec id elit non mi porta gravida at eget metus. Nullam id dolor id nibh ultricies vehicula ut id elit.
Week 9
In order to transfer the gold precipitating NRPS from D. acidovorans to E.coli, the necessary modules will be amplified from the D. acidovorans genome and assembled as plasmids. Due to its large size of 18 Kb, the module DelH will be expressed on a separate plasmid. A strategy was developed, primers designed accordingly and necessary BioBricks obtained from the distribution. The D. acidovorans was obtained from the DSMZ and cultured in Acidovorax complex medium.
Week 10
In order to clone the Delftibactin cluster from D. Acidovorans we decided to use Gibson cloning. Accordingly Gibson Primers were designed to amplify our target backbone pSB4K5 with an overlap to DelA. Furthermore the Gibson Primer designed to join DelOP with DelAF will introduce the ribosome binding site BBa_BNILS. Accordingly the Gibson Primer designed to join DelL with DelOP will introduce the ribosome binding site BBa_BAGAINNILSYOUNOOB.
Week 11
Cras justo odio, dapibus ac facilisis in, egestas eget quam. Donec id elit non mi porta gravida at eget metus. Nullam id dolor id nibh ultricies vehicula ut id elit.
At the beginning of the week, we could verify that the Gibson Assembly for Tripeptide I was indeed positive, however, the other Gibson Assemblies did not work properly. Instead of picking new colonies, we decided to optimize the Gibson recipe instead, as backbone religations were the most common problem. With these improved protocols, we used Gibson Assembly for the Dipeptide, Tripeptide II and Tetrapeptide I, later that week, Tetrapeptide II followed. After the Transformation to DH10β cells and screening by restriction digest we could send samples for the Dipeptide and Tetrapeptide I to sequencing and obtained a positive alignment. Hence we transformed BAP I cells with the positive constructs. The same was...
Week 12
Cras justo odio, dapibus ac facilisis in, egestas eget quam. Donec id elit non mi porta gravida at eget metus. Nullam id dolor id nibh ultricies vehicula ut id elit.
At the beginning of the week, we could verify that the Gibson Assembly for Tripeptide I was indeed positive, however, the other Gibson Assemblies did not work properly. Instead of picking new colonies, we decided to optimize the Gibson recipe instead, as backbone religations were the most common problem. With these improved protocols, we used Gibson Assembly for the Dipeptide, Tripeptide II and Tetrapeptide I, later that week, Tetrapeptide II followed. After the Transformation to DH10β cells and screening by restriction digest we could send samples for the Dipeptide and Tetrapeptide I to sequencing and obtained a positive alignment. Hence we transformed BAP I cells with the positive constructs. The same was...
Week 13
Cras justo odio, dapibus ac facilisis in, egestas eget quam. Donec id elit non mi porta gravida at eget metus. Nullam id dolor id nibh ultricies vehicula ut id elit.
Week 14
At the beginning of the week, we could verify that the Gibson Assembly for Tripeptide I was indeed positive, however, the other Gibson Assemblies did not work properly. Instead of picking new colonies, we decided to optimize the Gibson recipe instead, as backbone religations were the most common problem. With these improved protocols, we used Gibson Assembly for the Dipeptide, Tripeptide II and Tetrapeptide I, later that week, Tetrapeptide II followed.
Week 15
Cras justo odio, dapibus ac facilisis in, egestas eget quam. Donec id elit non mi porta gravida at eget metus. Nullam id dolor id nibh ultricies vehicula ut id elit.
Week 16
Cras justo odio, dapibus ac facilisis in, egestas eget quam. Donec id elit non mi porta gravida at eget metus. Nullam id dolor id nibh ultricies vehicula ut id elit.
Week 17
Cras justo odio, dapibus ac facilisis in, egestas eget quam. Donec id elit non mi porta gravida at eget metus. Nullam id dolor id nibh ultricies vehicula ut id elit.
Week 18
Cras justo odio, dapibus ac facilisis in, egestas eget quam. Donec id elit non mi porta gravida at eget metus. Nullam id dolor id nibh ultricies vehicula ut id elit.
Week 19
Cras justo odio, dapibus ac facilisis in, egestas eget quam. Donec id elit non mi porta gravida at eget metus. Nullam id dolor id nibh ultricies vehicula ut id elit.
Week 20
Cras justo odio, dapibus ac facilisis in, egestas eget quam. Donec id elit non mi porta gravida at eget metus. Nullam id dolor id nibh ultricies vehicula ut id elit.
Week 21
Cras justo odio, dapibus ac facilisis in, egestas eget quam. Donec id elit non mi porta gravida at eget metus. Nullam id dolor id nibh ultricies vehicula ut id elit.
Week 22
Cras justo odio, dapibus ac facilisis in, egestas eget quam. Donec id elit non mi porta gravida at eget metus. Nullam id dolor id nibh ultricies vehicula ut id elit.
Week 23
Cras justo odio, dapibus ac facilisis in, egestas eget quam. Donec id elit non mi porta gravida at eget metus. Nullam id dolor id nibh ultricies vehicula ut id elit.
Methods:
Lorem ipsum dolor sit amet, consetetur sadipscing elitr, sed diam nonumy eirmod tempor invidunt ut labore et dolore magna aliquyam erat, sed diam voluptua. At vero eos et accusam et justo duo dolores et ea rebum. Stet clita kasd gubergren, no sea takimata sanctus est Lorem ipsum dolor sit amet. Lorem ipsum dolor sit amet, consetetur sadipscing elitr, sed diam nonumy eirmod tempor invidunt ut labore et dolore magna aliquyam erat, sed diam voluptua. At vero eos et accusam et justo duo dolores et ea rebum. Stet clita kasd gubergren, no sea takimata sanctus est Lorem ipsum dolor sit amet.Lorem ipsum dolor sit amet, consetetur sadipscing elitr, sed diam nonumy eirmod tempor invidunt ut labore et dolore magna aliquyam erat, sed diam voluptua. .
Indigoidine Production - bpsA
For the PCR amplification of native bpsA, Streptomyces lavendulae subsp. lavendulae DSM40708 was grown on GYM agar plates. We wanted to use the native indigoidine synthetase bpsA and the PPTase svp from pMM65 and to assemble pRB1, which is similar to pKH1. In this new assembly approach, we amplify the bpsA gene from the S. lavendulae genome instead of using a codon optimized sequence. Furthermore the svp coding sequence was placed behind a weaker promoter ([http://parts.igem.org/Part:BBa_B0029 BBa_B0029]) since the PPTase has to activate every indigoidine synthetase only once and thus is not required in huge amounts (Lambalot 1996).
In the subsequent weeks we wanted to exchange the Thiolation-domain (T-domain) of bpsA with T-Domains of other NRPS modules and show that it can be activated by various PPTases. We wanted to find out whether there are differences in the PPTases' efficiency concerning the activation of engineered indigoidine synthetases.
The PCR amplification of bpsA was unsuccessful. We will try again with a new set of primers.
In addition we will try to amplify the native svp PPTase from Streptomyces verticillus ATCC15003, which has been described in previous studies (Sanchez 2001).
06-07-2013
Amplification from FS_02 to FS_03; 5.3 kb
- Reaction
| what | µL |
|---|---|
| D. acidovorans DSM-39 | 1 |
| FS_02: (1/10) | 1 |
| FS_03: (1/10) | 1 |
| Phusion Master Mix | 10 |
| DMSO | 1/- |
| dd H2O | 6/7 |
- Conditions
| Biorad MyCycler | ||
|---|---|---|
| Cycles-PCR | temperature [°C] | Time [s] |
| 1 | 98 | 5 |
| 12 | 98 | 1 |
| 66 ↓ 0.5 | 5 | |
| 72 | 2:30 min | |
| 18 | 98 | 1 |
| 63 | 5 | |
| 72 | 2:30 min | |
| 1 | 72 | 10 min |
| 1 | 4 | inf |
Results:
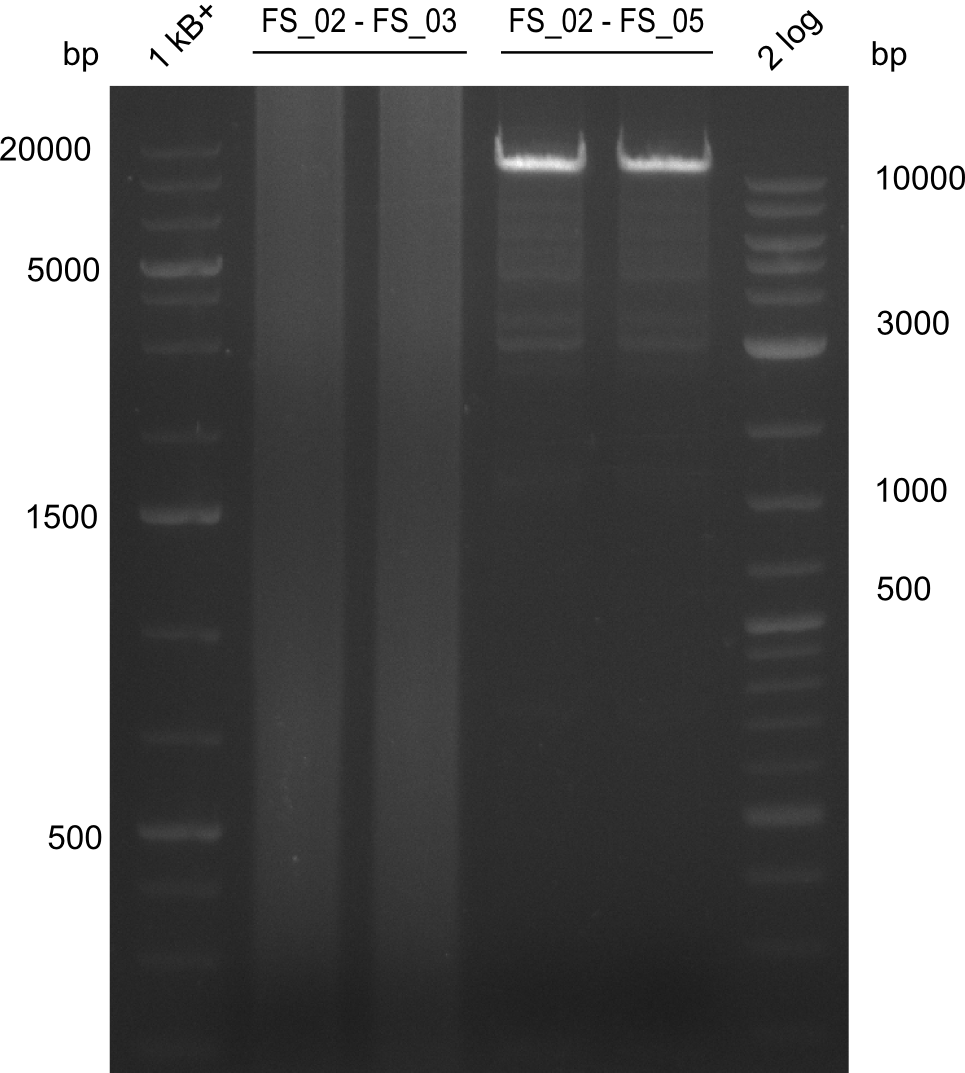
- Amplification worked with 5% DMSO
- Repeat Amplification with the same protocol to increase concentration when DNA is extracted from gel slices
Indigoidine Production - bpsA
Streptomyces verticillus ATCC15003 was cultivated and used for amplification of the svp PPTase. We tried to extract bpsA from S. lavendulae DSM40708 with a new set of primers (Primer RB11-20).
PCR results with various primers and PCR conditions suggested that the bpsA indigoidine synthetase gene is not present or mutated in S. lavendulae DSM40708. The amplification of svp was successful.
Photorhabdus luminescens laumondii TT01 has been shown to carry an indioidine synthetase called indC (Brachmann 2012). We will use indC instead of bpsA for the following project parts.
08-07-2013
Amplification from FS_02 to FS_03; 5.3 kb
- Reaction
| what | µL |
|---|---|
| D. acidovorans DSM-39 | 1 |
| FS_02: (1/10) | 2.5 |
| FS_03: (1/10) | 2.5 |
| Phusion Master Mix | 25 |
| DMSO | 2.5 |
| dd H2O | 19 |
- Conditions
| Biorad MyCycler | ||
|---|---|---|
| Cycles-PCR | temperature [°C] | Time [s] |
| 1 | 98 | 5 |
| 12 | 98 | 1 |
| 66 ↓ 0.5 | 5 | |
| 72 | 2:30 min | |
| 18 | 98 | 1 |
| 63 | 5 | |
| 72 | 2:30 min | |
| 1 | 72 | 10 min |
| 1 | 4 | inf |
Results:
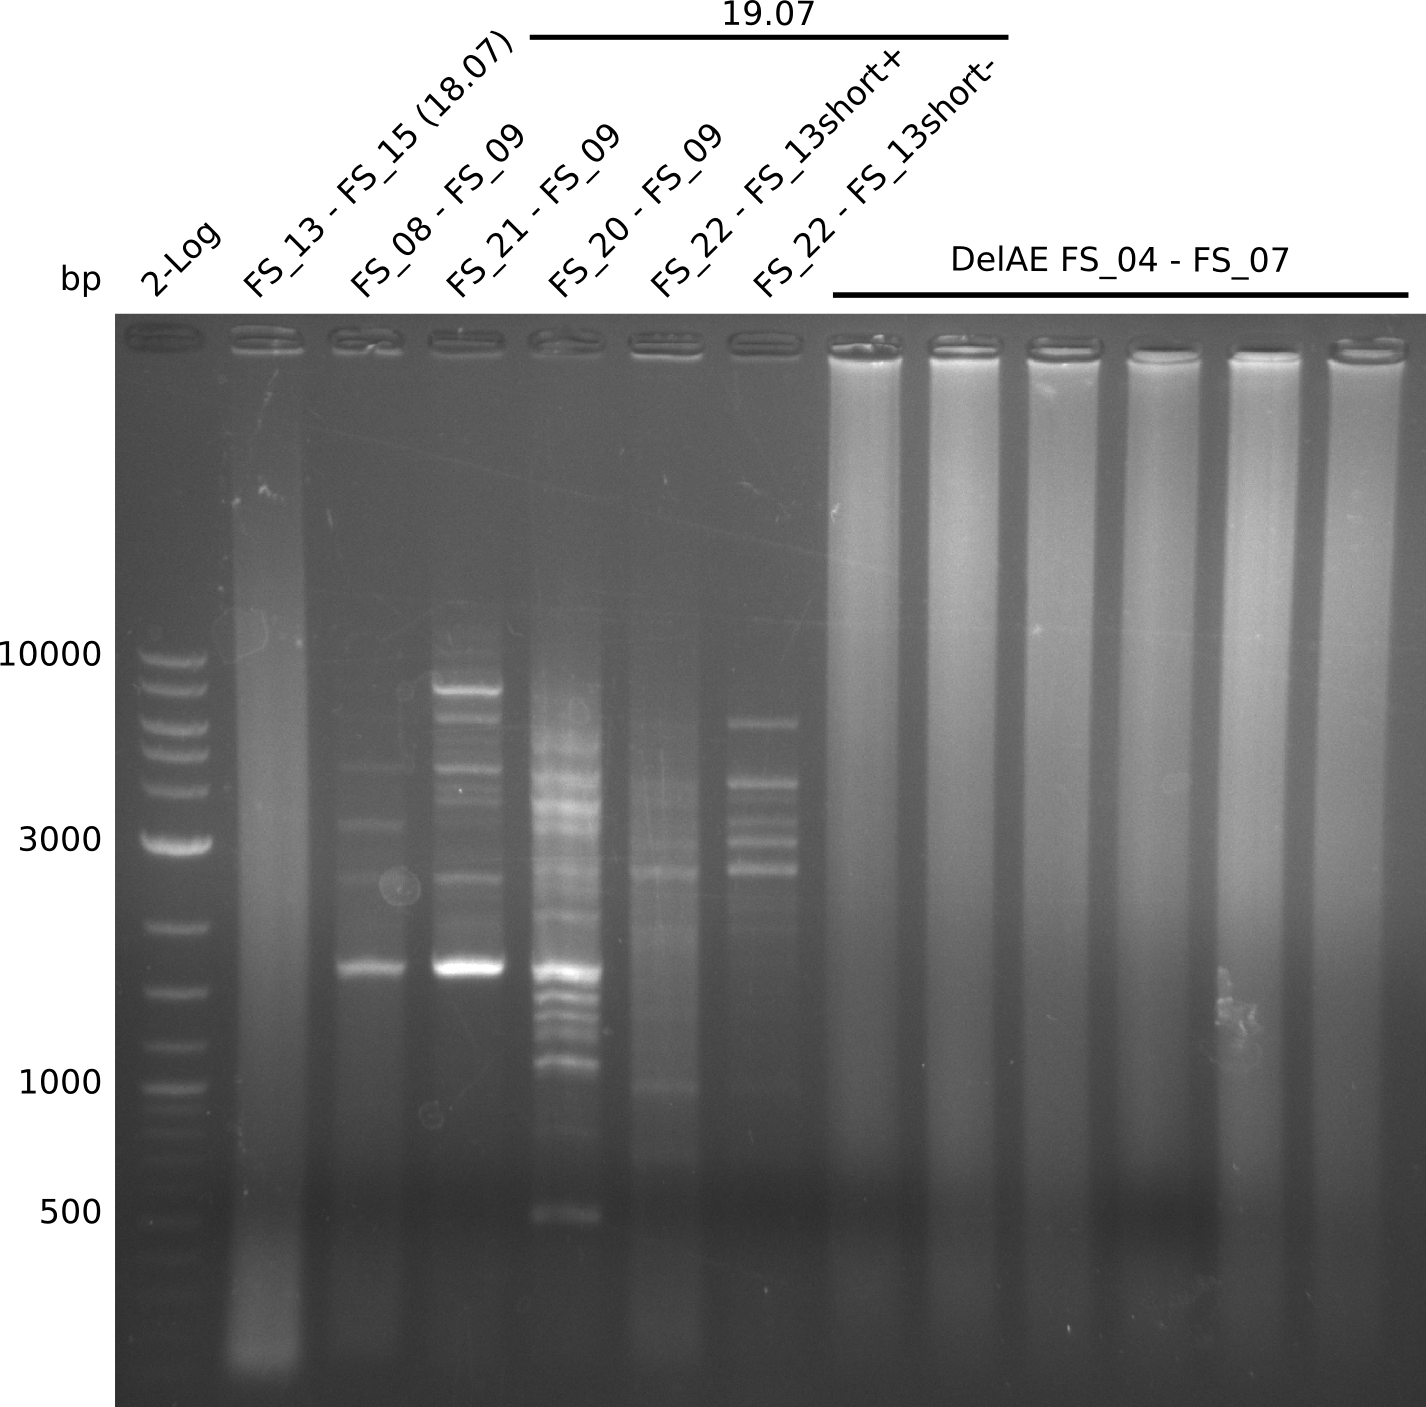
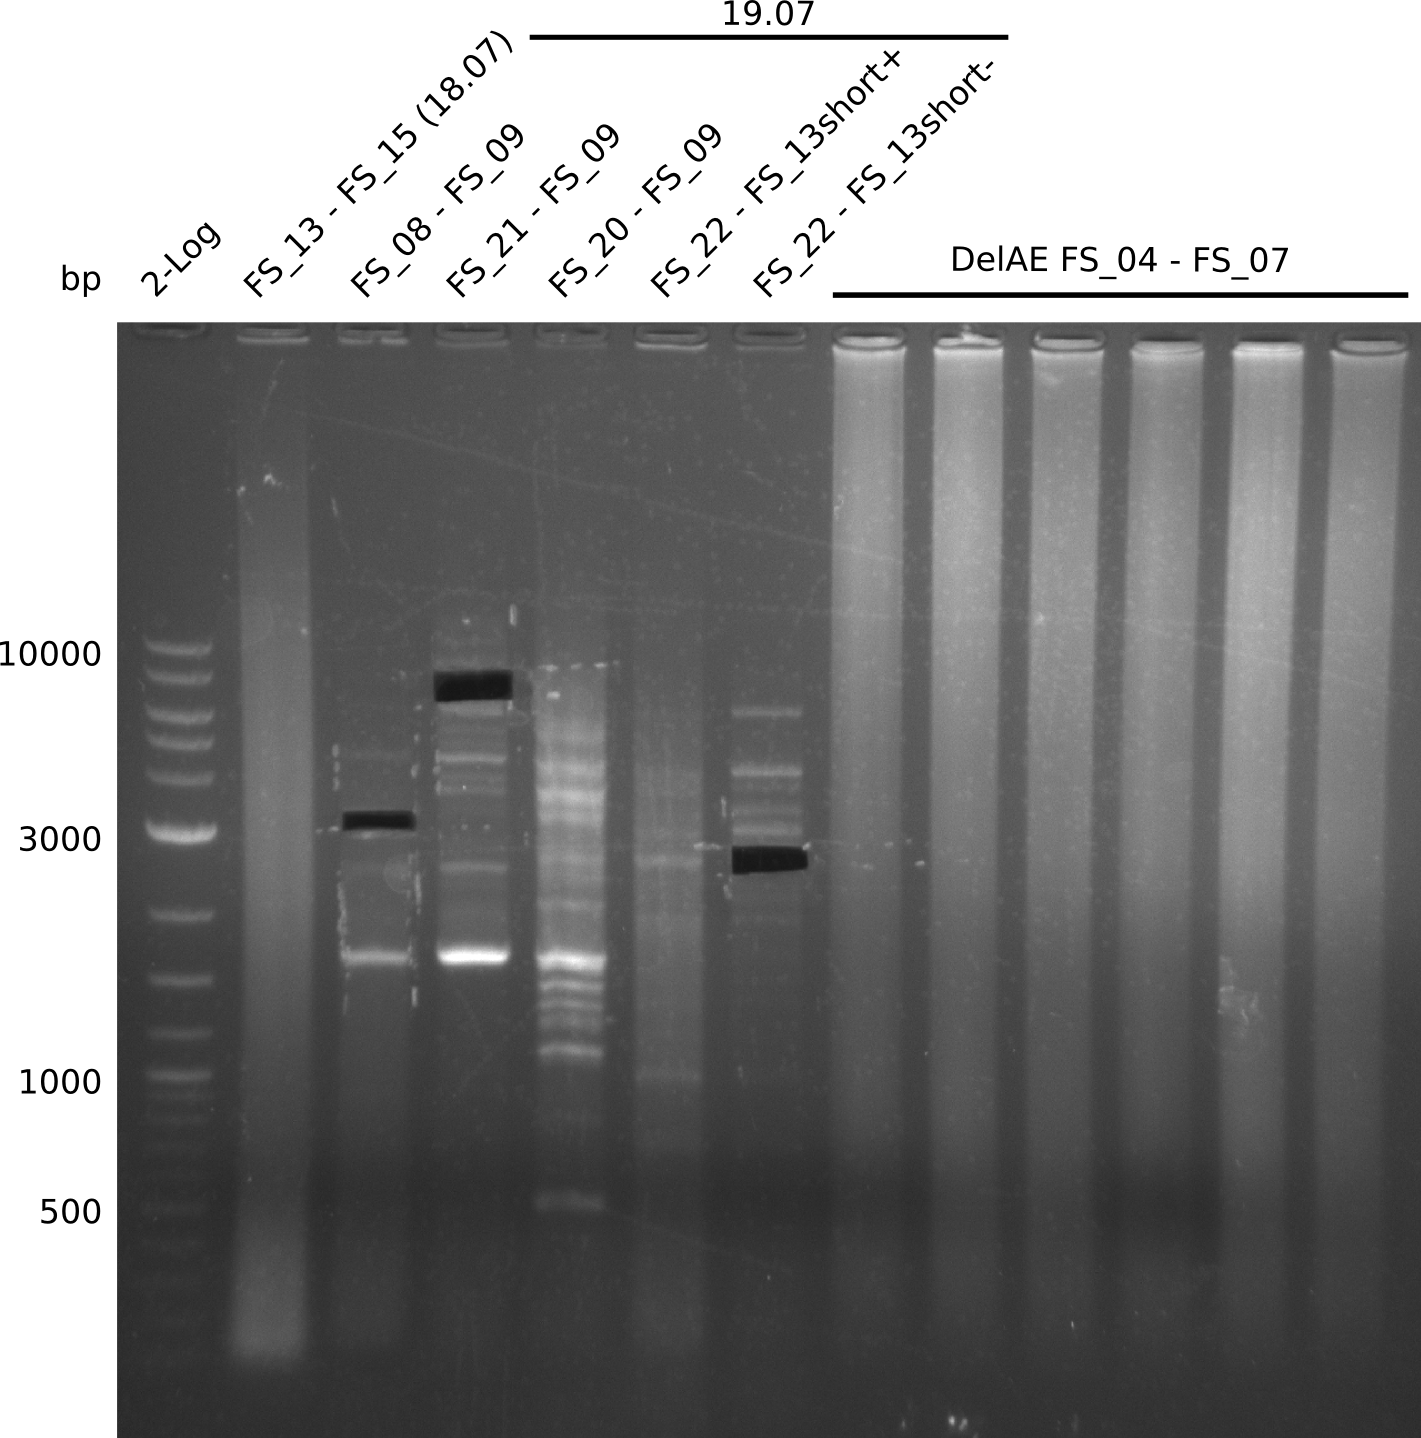
- Amplification of DelAE worked
- bands were cut out and DNA purified using QIAquick Gel Extraction Kit
Indigoidine Production - indC
Since S. lavendulae DSM40708 does not carry the bpsA gene, we used indC from Photorhabdus luminescens laumondii TT01 instead (Brachmann 2012).
The PPTase Sfp, originating from the B. subtilis strain 168, has been shown to exhibit a broad substrate specificity (Nakano 1988) and thus was used to activate indC on pRB3. pRB3 is similar to previous plasmids (indigoidine synthetase and PPTase on pSB1C3) but contains a KpnI cutting site as a spacer between the first ribosome binding site (RBS) and the indC coding sequence, a BamHI cutting site as a spacer between the second RBS and the sfp coding sequence as well as a NheI cutting site at the end of sfp. Therefore, this plasmid can be used with both Gibson or CPEC and a classical restriction cloning assembly strategies.
If pRB3 is functional, we will continue testing various combinations of PPTases and indigoidine synthetases.
pRB3 is a functional pSB1C3 construct with the genotype [http://parts.igem.org/Part:BBa_R0010 lacI-Promoter]-[http://parts.igem.org/Part:BBa_B0034 RBS1]-KpnI-indC-[http://parts.igem.org/Part:BBa_B0029 RBS2]-BamHI-sfp-NheI-pSB1C3ΔmRFP1. The blue phenotype of pRB3-transformed E.coli TOP10 cells proofs production of the blue pigment indigoidine after 30 hours and incubation at 37 °C. Transformed cells expressing the indigoidine synthetase gene and producing indigoidine grow much slower than usual TOP10 cells. This effect was already reported by other groups (Owen 2011) and is supposed to be due to the slight toxicity of indigoidine.
Next week we will amplify other PPTases and assemble plasmids with combinations of indC, bpsA(pMM64), sfp, svp, svp(pMM65) and entD. The ladder is the endogenous PPTase of E. coli and considered to be inefficient in activating indigoidine synthetases (Takahashi 2007). We want to test and compare entD with the other PPTases when overexpressed on a plasmid.
19-07-2013
Amplificaction from FS_02 to FS_03; 5.3 kb
- Reaction
2x ~50 µL
| what | µL |
|---|---|
| D. acidovorans DSM-39 | 1 |
| FS_02: (1/10) | 2.5 |
| FS_03: (1/10) | 2.5 |
| Phusion flash Master Mix | 25 |
| DMSO | 2.5 |
| dd H2O | 19 |
- Conditions
| Biometra TProfessional Basic | ||
|---|---|---|
| Cycles | temperature [°C] | Time [s] |
| 1 | 98 | 5 |
| 12 | 98 | 1 |
| 66 ↓ 0.5 | 5 | |
| 72 | 2:30 | |
| 18 | 98 | 1 |
| 63 | 5 | |
| 72 | 2:30 | |
| 1 | 72 | 10min |
| 1 | 12 | inf |
Results:
- Amplification of DelAE did not work since a different cycler was used
20-07-2013
Amplification from FS_02 to FS_03; 5.3 kb
- Reaction
| what | µL |
|---|---|
| D. acidovorans DSM-39 | 1 |
| FS_02: (1/10) | 2.5 |
| FS_03: (1/10) | 2.5 |
| Phusion flash Master Mix | 25 |
| DMSO | 2,5 |
| dd H2O | 19 |
- Conditions
| Biorad MyCycler | ||
|---|---|---|
| Cycles | temperature [°C] | Time [s] |
| 1 | 98 | 5 |
| 12 | 98 | 1 |
| 66 ↓ 0.5 | 5 | |
| 72 | 2:30 | |
| 18 | 98 | 1 |
| 63 | 5 | |
| 72 | 2:30 | |
| 1 | 72 | 10min |
| 1 | 12 | inf |
Results:
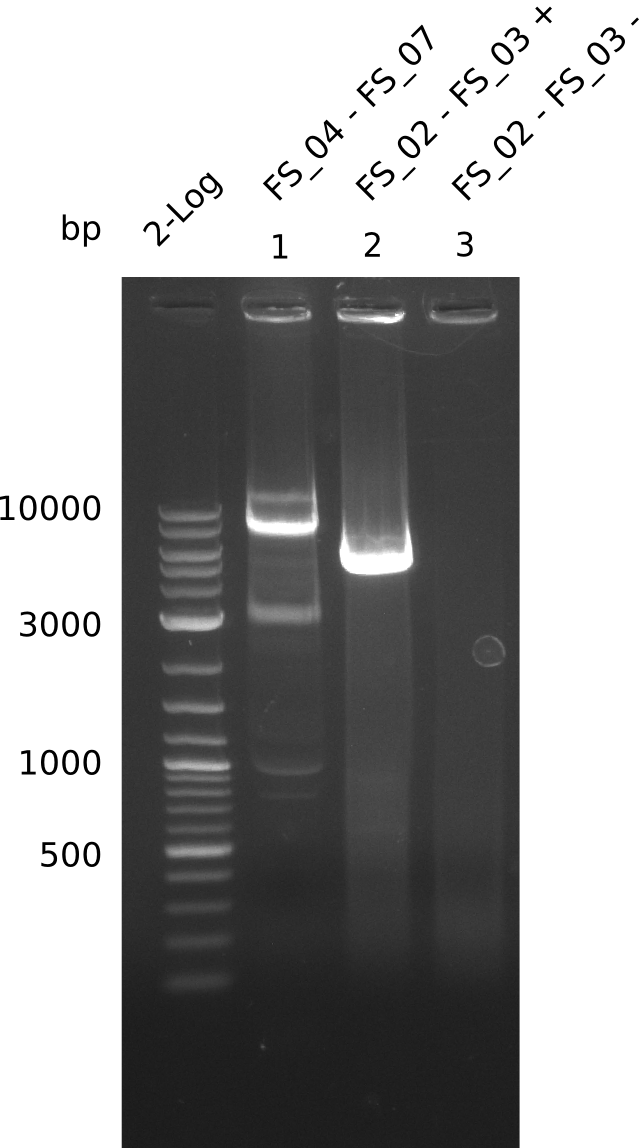
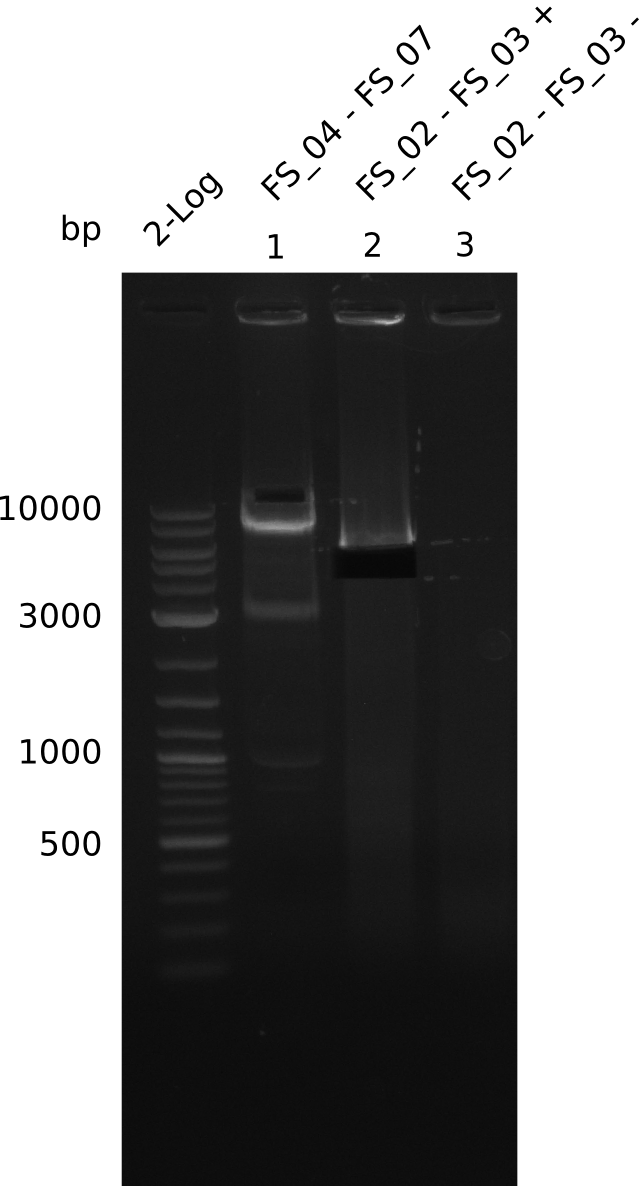
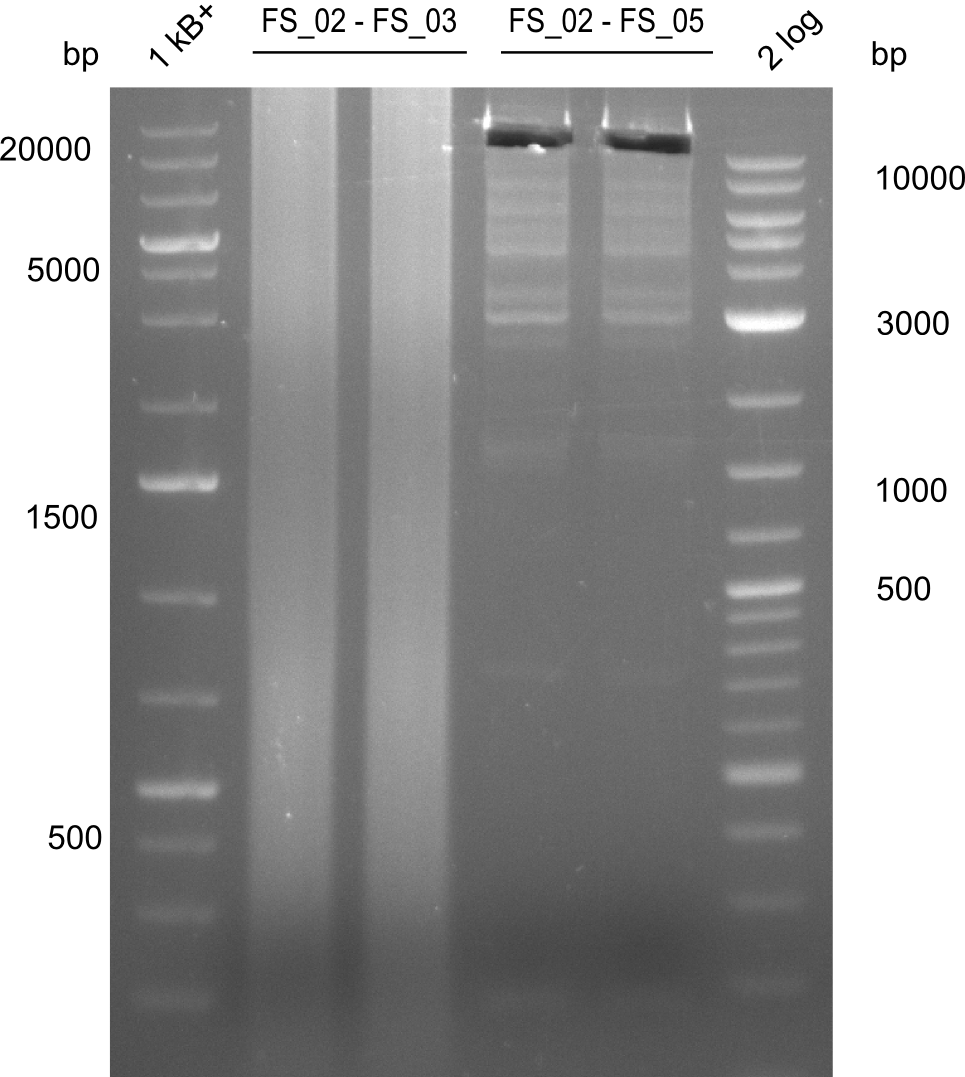
- Amplification of DelAE worked but a smear occured, therefore bands were cut out carefully and only used for a test restriction digest
Indigoidine Production – Testing PPTases
We wanted to test various PPTases on their functionality in activating the indigoidine synthetases indC and bpsA. The plasmids pRB3-10 represent all possible combinations of either indC or bpsA with the PPTases sfp, svp, svp (pMM65) or entD. We transformed E. coli TOP10 with all the plasmids.
All PPTases are capable of attaching the 4'-Phosphopanthetheinyl residue to the apo-form of the indigoidine synthetases as was observed by the blue phenotype of transformed E. coli TOP10 cells. The main focus was now on exchanging the T-Domain of the indigoidine synthetase indC to further proof the concept of modularity in the field of NRPS domains. We can easily determine which engineered versions of indC remain functionality by screening for blue colonies.
26-07-2013
Restriction digest of fragment FS_02 to FS_03; 5.3 kb; 08-07-2013 with EcoRI-HF
Incubation at 37°C for 1 h 45 min
| what | µL |
|---|---|
| FS_02 to FS_03 (08-07-2013) | 15 |
| EcorRI-HF | 0.5 |
| Buffer CutSmart | 2 |
| dd H2O | 2 |
| Expected fragment lengths [bp] | 3054, 2260 |
Results:
- restriction digest of DelAE did not work, since incubation time might have been to short
27-07-2013
Amplificaction from FS_02 to FS_03; 5.3 kb
- Reaction
| what | µL |
|---|---|
| D. acidovorans DSM-39 | 1 |
| FS_02: (1/10) | 2.5 |
| FS_03: (1/10) | 2.5 |
| Phusion flash Master Mix | 25 |
| DMSO | 2.5 |
| dd H2O | 19 |
- Conditions
| Biorad MyCycler | ||
|---|---|---|
| Cycles | temperature [°C] | Time [s] |
| 1 | 98 | 10 |
| 12 | 98 | 1 |
| 66 ↓ 0.5 | 5 | |
| 72 | 2:30 | |
| 18 | 98 | 1 |
| 63 | 5 | |
| 72 | 2:30 | |
| 1 | 72 | 12 min |
| 1 | 12 | inf |
Results:
- Amplification of DelAE didnt work out, only smear occured
- repeat PCR with better cycler
Amplificaction from FS_02 to FS_03; 5.3 kb
- Reaction
| what | µL |
|---|---|
| D. acidovorans DSM-39 | 1.5/1 |
| FS_02: (1/10) | 2.5/5 |
| FS_03: (1/10) | 2.5/5 |
| Phusion flash Master Mix | 25 |
| DMSO | 2.5 |
| dd H2O | 19/14 |
- Conditions
| Biorad MyCycler* | ||
|---|---|---|
| Cycles | temperature [°C] | Time [s] |
| 1 | 98 | 10 |
| 12 | 98 | 1 |
| 66 ↓ 0.5 | 5 | |
| 72 | 2:30 | |
| 18 | 98 | 1 |
| 63 | 5 | |
| 72 | 2:30 | |
| 1 | 72 | 12 min |
| 1 | 12 | inf |
Results:
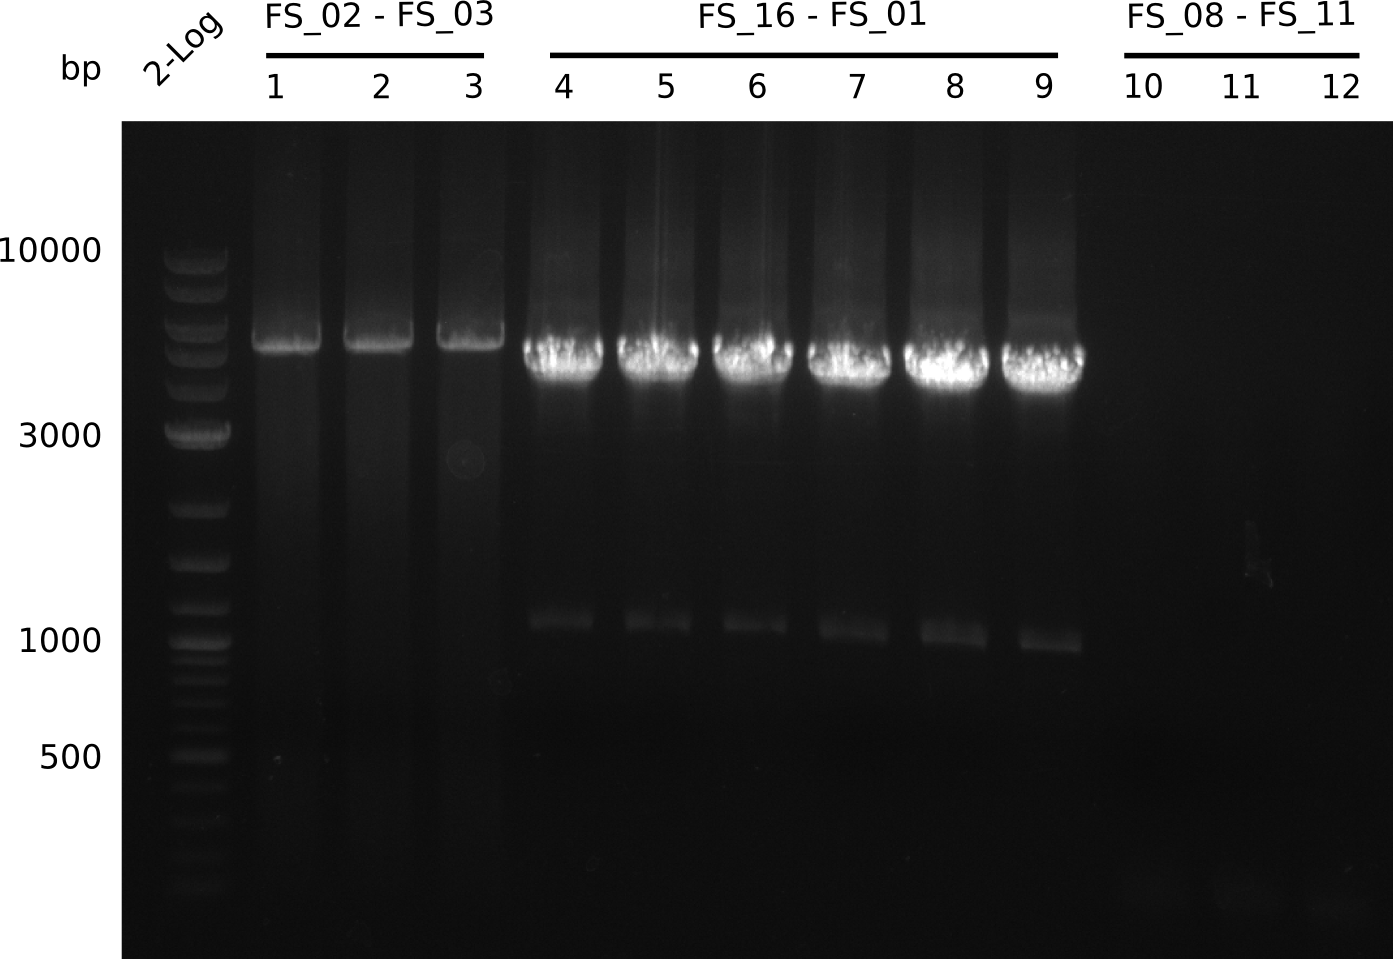
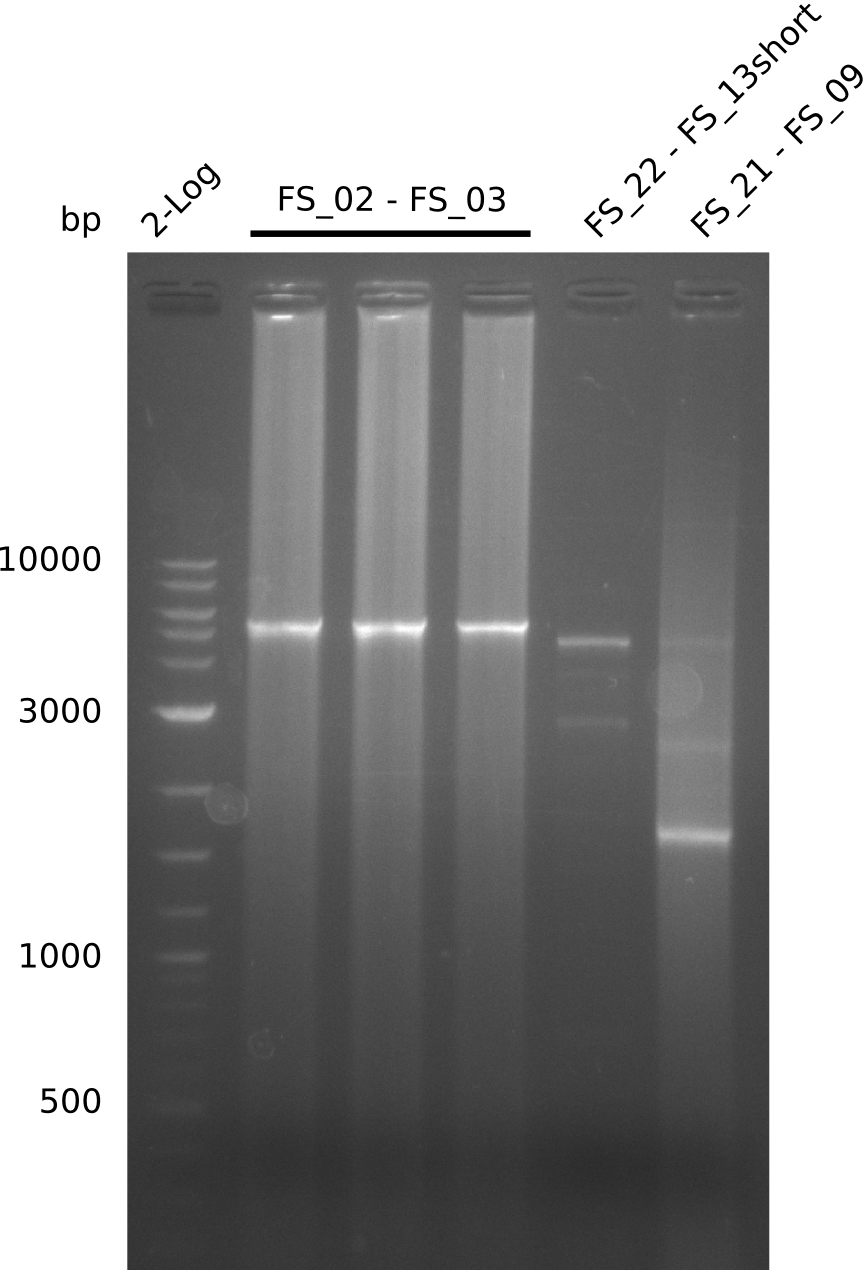
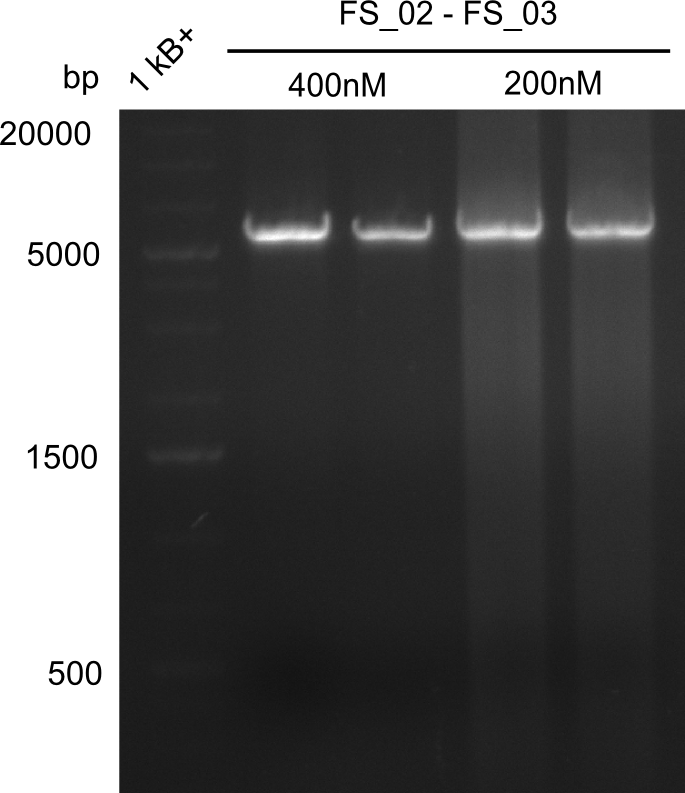
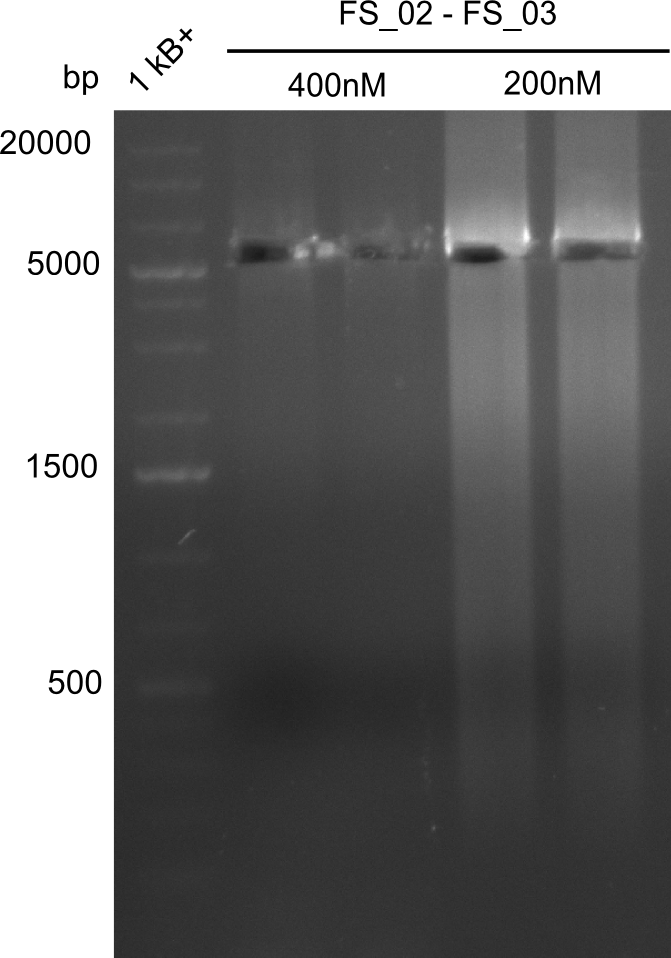
- Amplification of DelAE worked with both 200 and 400 nM of Primers, nevertheless amplification was more specific with the higher primer concentration
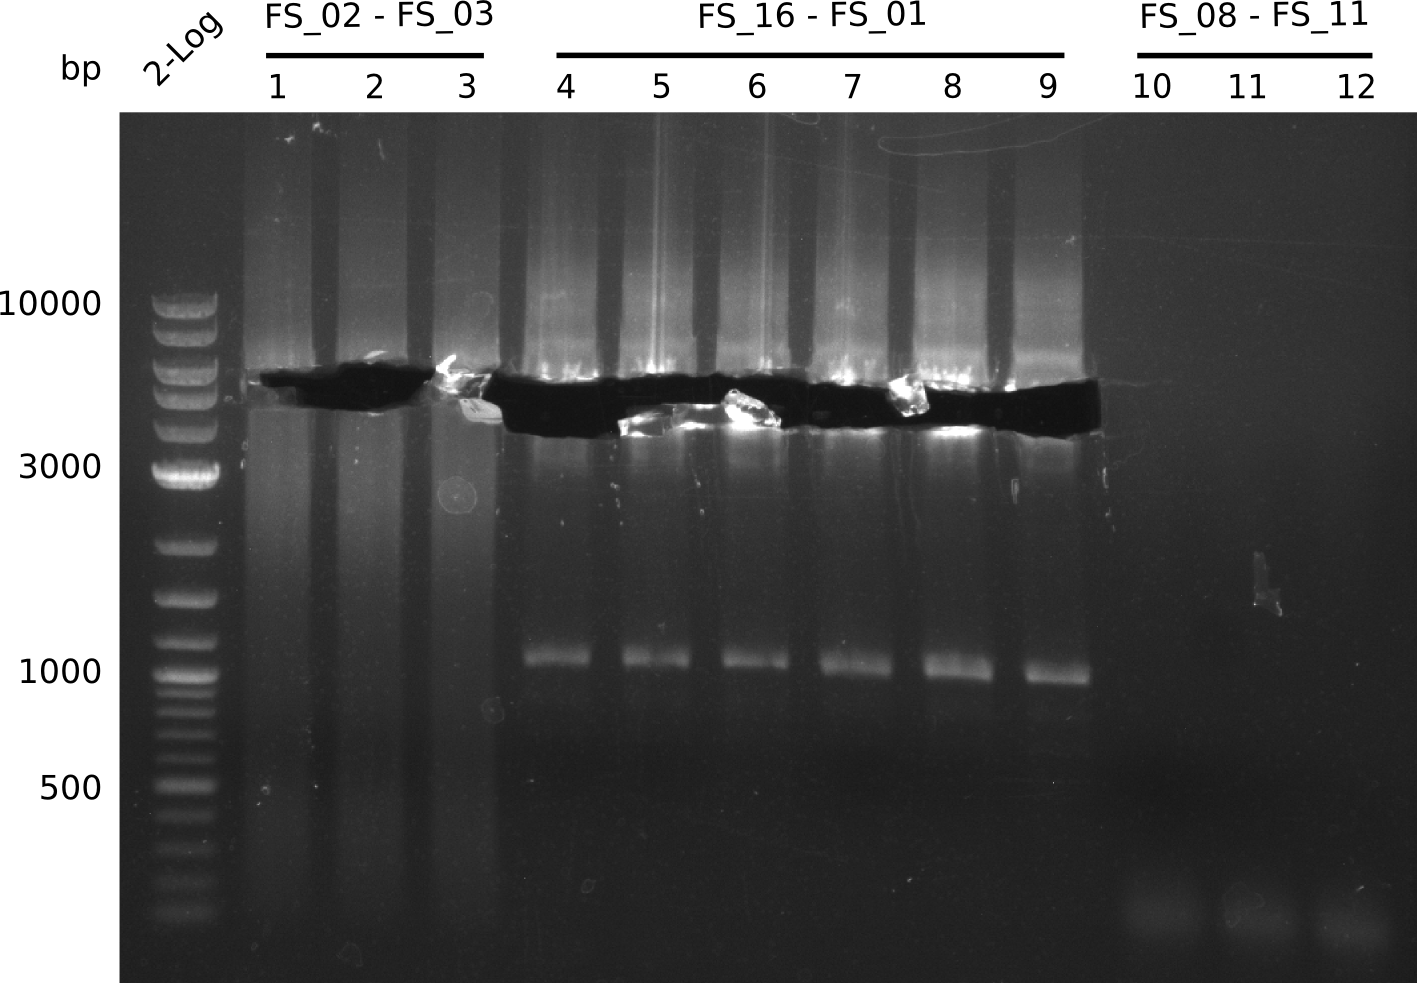
- bands were cut out and DNA purified using QIAquick Gel Extraction Kit
Amplification I from FS_02 to FS_24; 7.1 kb
4 reactions, 2 with 200nM Primers and 2 with 400nM Primers (both concentrations for each condition)
- Reaction
| what | µl |
|---|---|
| D. acidovorans DSM-39 | 1 |
| FS_02: (1/10) | 4/2 |
| FS_24: (1/10) | 4/2 |
| Phusion flash Master Mix | 10 |
| DMSO | 1 |
| dd H2O | 0/4 |
- Conditions I
| Biorad T100 | ||
|---|---|---|
| Cycles | temperature [°C] | Time [s] |
| 1 | 98 | 10 |
| 30 | 98 | 1 |
| 65 | 5 | |
| 72 | 3:50 | |
| 1 | 72 | 12 min |
| 1 | 10 | inf |
- Conditions II
| Biometra TProfessional Basic | ||
|---|---|---|
| Cycles-PCR | temperature [°C] | Time [s] |
| 1 | 98 | 10 |
| 12 | 98 | 1 |
| 68 ↓ 0.5 | 5 | |
| 72 | 3:50 min | |
| 18 | 98 | 1 |
| 66 | 5 | |
| 72 | 3:50 min | |
| 1 | 72 | 10 min |
| 1 | 4 | inf |
Results:
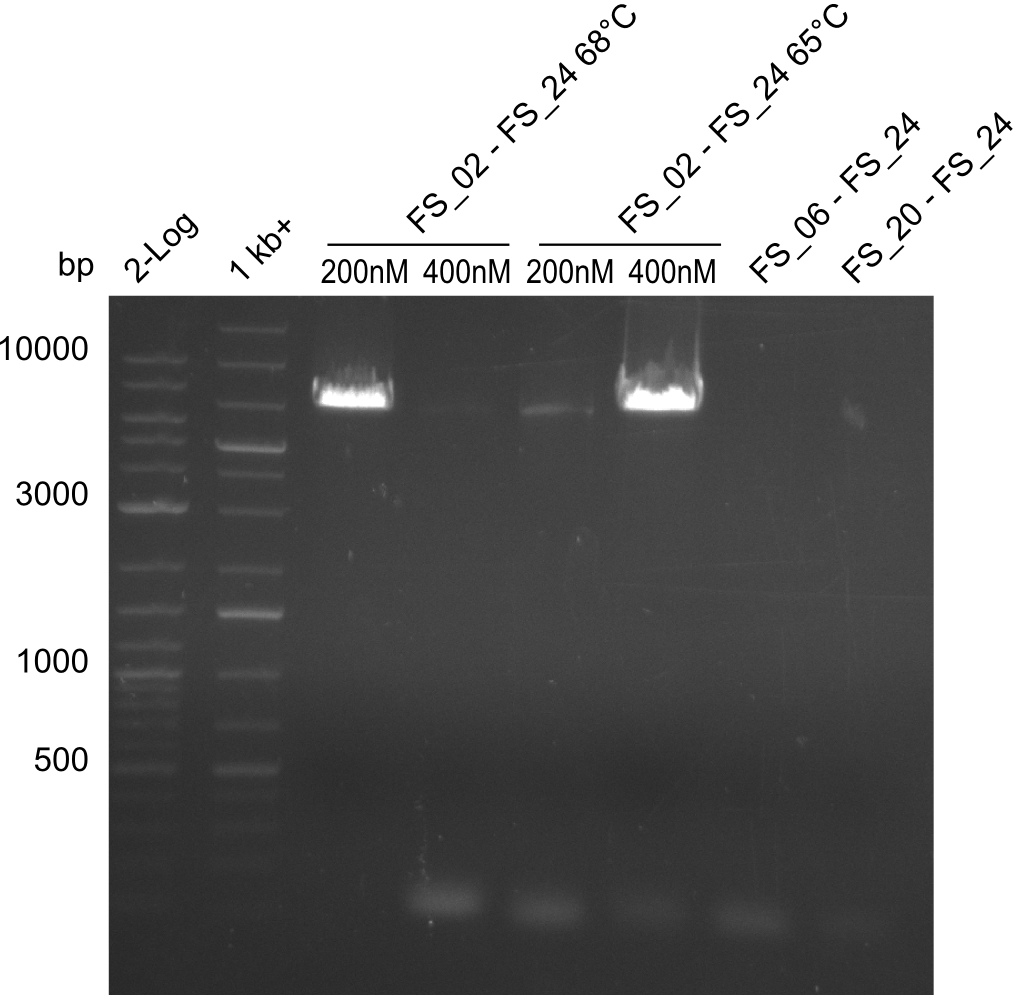
- Amplification of DelAE worked with 200 nM primer concentration at an annealing temperature of 68°C and 400 nM at an annealing temperature of 65°C, the product obtained at 65°C was more specific
- bands were cut out and DNA purified using QIAquick Gel Extraction Kit
Amplification II from FS_02 to FS_24; 7.1 kb
2 reactions, 68°C Touchdown with 200nM Primers and 65°C constant with 400nM Primers
- Reaction
| what | µl |
|---|---|
| D. acidovorans DSM-39 | 1 |
| FS_02: (1/10) | 2/4 |
| FS_24: (1/10) | 2/4 |
| Phusion flash Master Mix | 10 |
| DMSO | 1 |
| dd H2O | 0/4 |
- Conditions I
| Biorad T100 | ||
|---|---|---|
| Cycles | temperature [°C] | Time [s] |
| 1 | 98 | 10 |
| 30 | 98 | 1 |
| 65 | 5 | |
| 72 | 5:40 | |
| 1 | 72 | 12 min |
| 1 | 10 | inf |
- Conditions II
| Biometra TProfessional Basic | ||
|---|---|---|
| Cycles-PCR | temperature [°C] | Time [s] |
| 1 | 98 | 10 |
| 12 | 98 | 1 |
| 68 ↓ 0.5 | 5 | |
| 72 | 5:40 min | |
| 18 | 98 | 1 |
| 66 | 5 | |
| 72 | 5:40 min | |
| 1 | 72 | 10 min |
| 1 | 4 | inf |
Results:
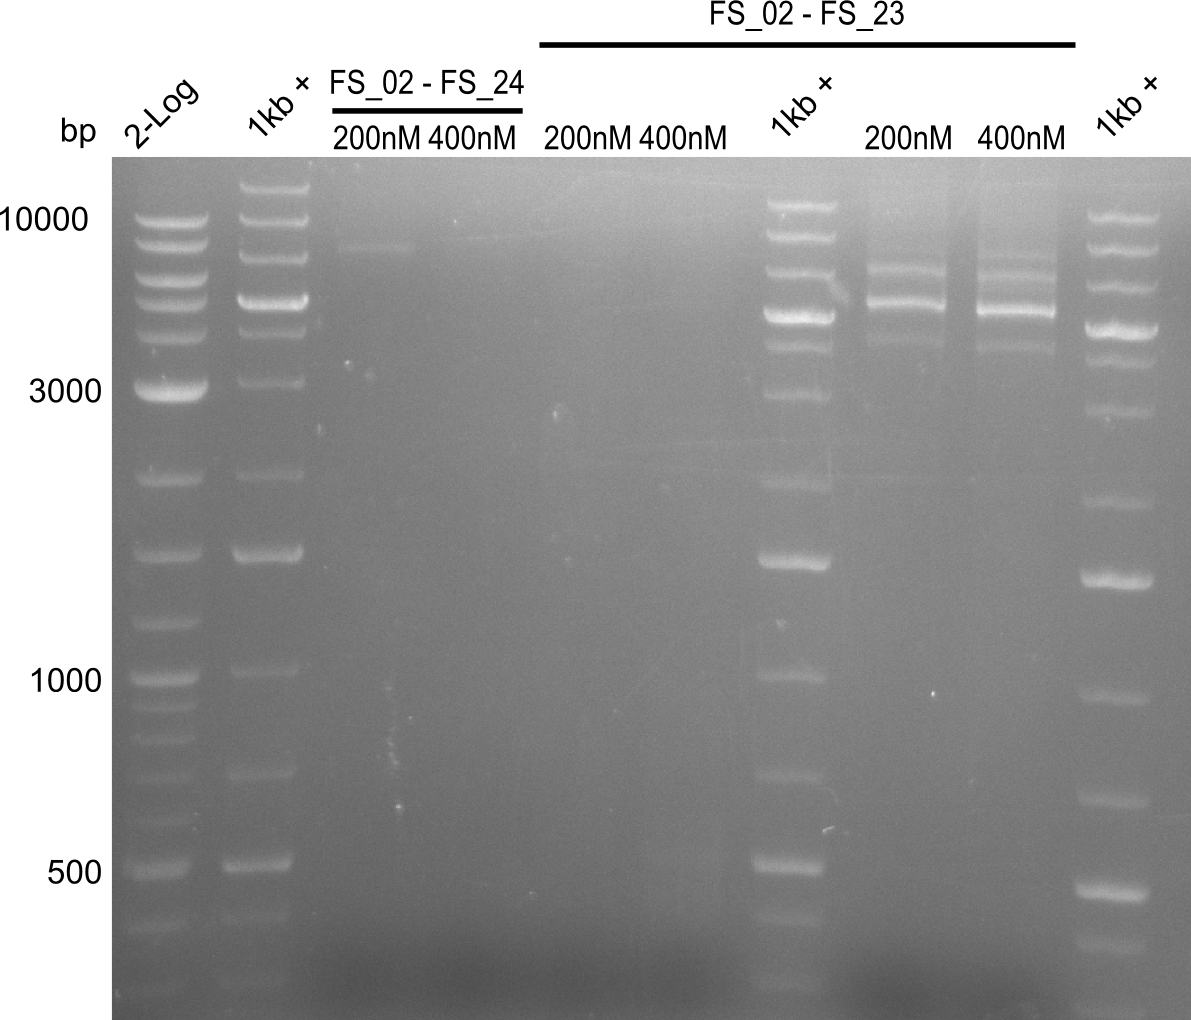
- Amplification did not work, neither with 200nM and 68°C touchdown, nor with 400nM and 65°C constant.
- Repeat amplfication with different conditions as primers did not bind very effectively
Amplification III from FS_02 to FS_24; 7.1 kb
2 reactions, 66°C Touchdown with 200nM Primers and 60°C constant with 400nM Primers
- Reaction
| what | µl |
|---|---|
| D. acidovorans DSM-39 | 1 |
| FS_02: (1/10) | 2/4 |
| FS_24: (1/10) | 2/4 |
| Phusion flash Master Mix | 10 |
| DMSO | 1 |
| dd H2O | 0/4 |
- Conditions I
| Biorad T100 | ||
|---|---|---|
| Cycles | temperature [°C] | Time [s] |
| 1 | 98 | 10 |
| 30 | 98 | 1 |
| 60 | 5 | |
| 72 | 5:40 | |
| 1 | 72 | 12 min |
| 1 | 10 | inf |
- Conditions II
| Biorad C1000 Touch Block A | ||
|---|---|---|
| Cycles-PCR | temperature [°C] | Time [s] |
| 1 | 98 | 10 |
| 12 | 98 | 1 |
| 66 ↓ 0.5 | 5 | |
| 72 | 5:40 min | |
| 18 | 98 | 1 |
| 64 | 5 | |
| 72 | 5:40 min | |
| 1 | 72 | 10 min |
| 1 | 4 | inf |
Results:
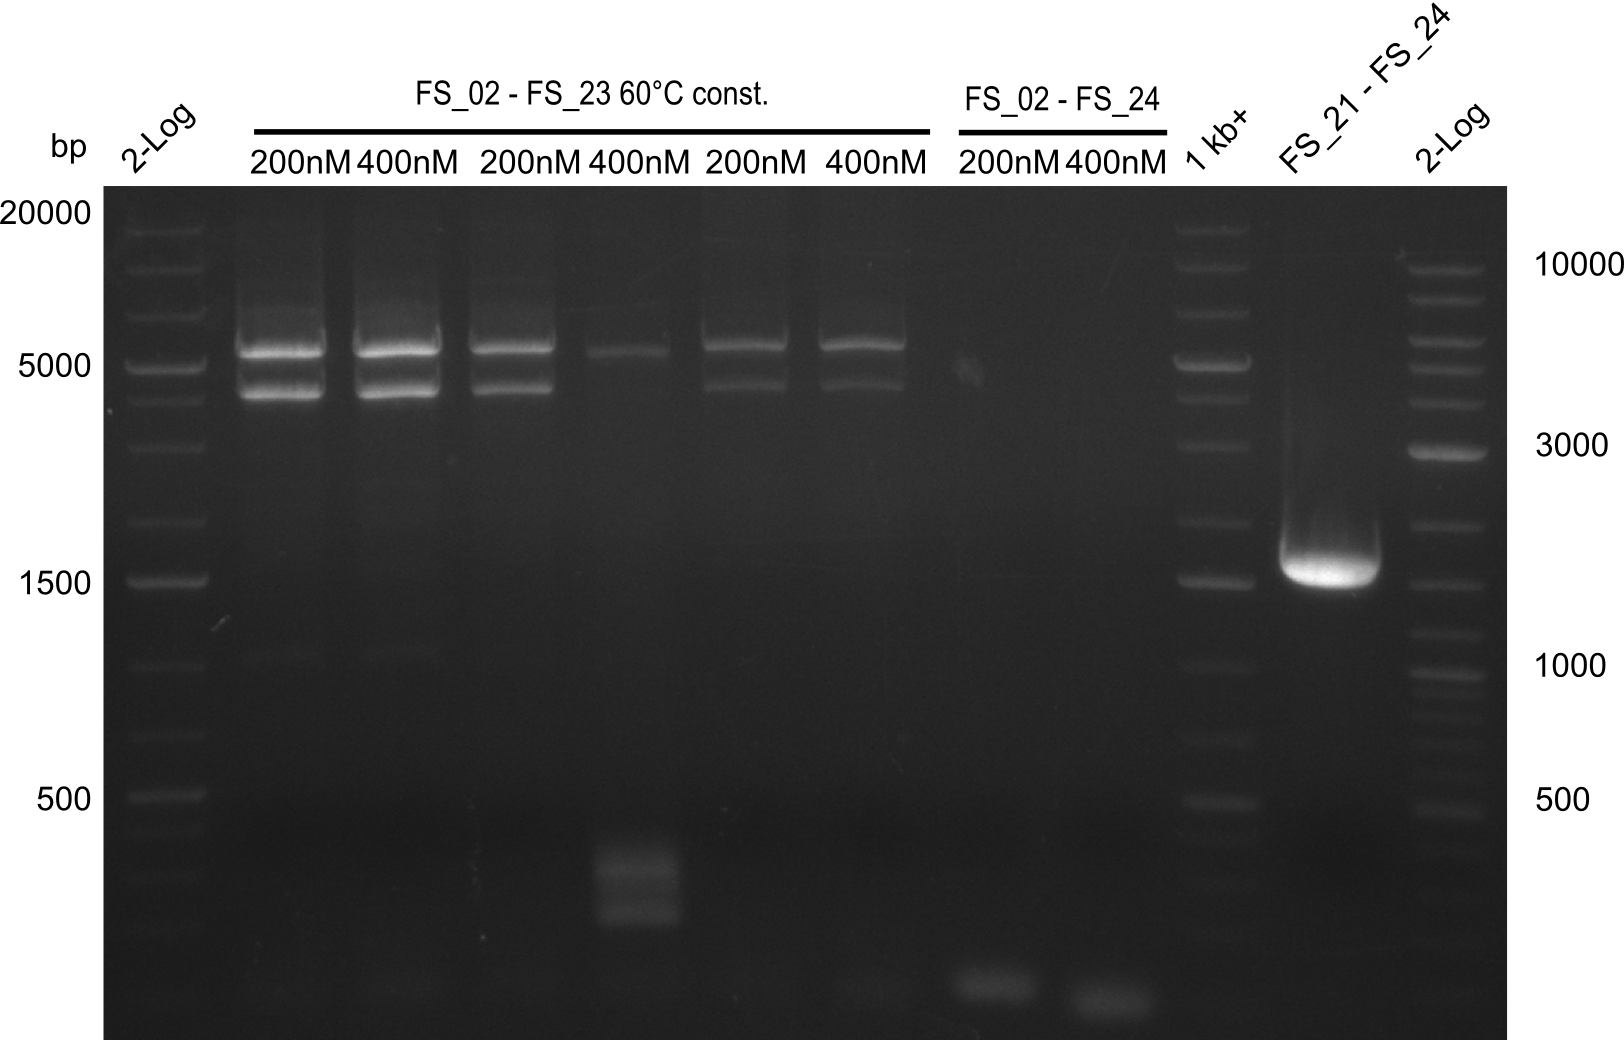
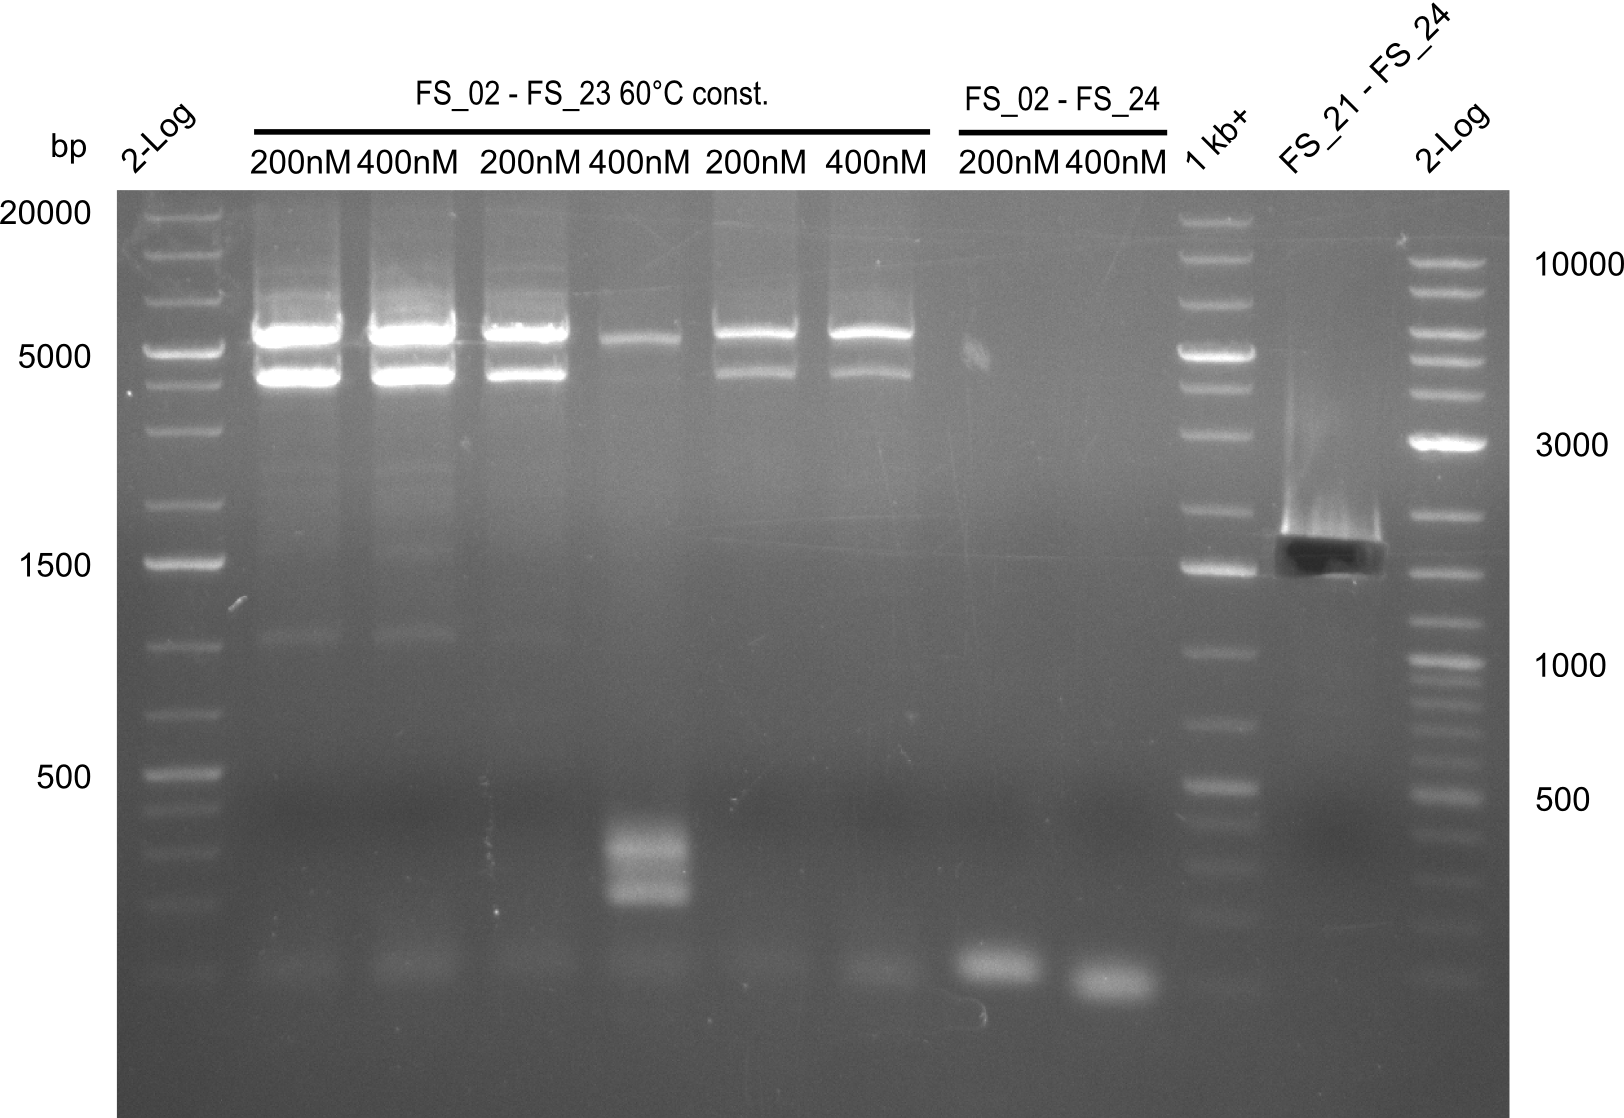
- Amplification from DelAE (7.1 kbp) failed again
- stick to the old strategy and use previously obtained fragments with different other fragments for gibson assembly.
29-07-2013
Restriction digest of FS_02 to FS_03; 5.3 kb;(27-07-2013; II) with BglII
Incubation at 37°C for about 3 h
| what | µL |
|---|---|
| FS_02 to FS_03 (27-07-2013; II) | 15 |
| BglII | 1 |
| Buffer 3.1 | 2 |
| dd H2O | 2 |
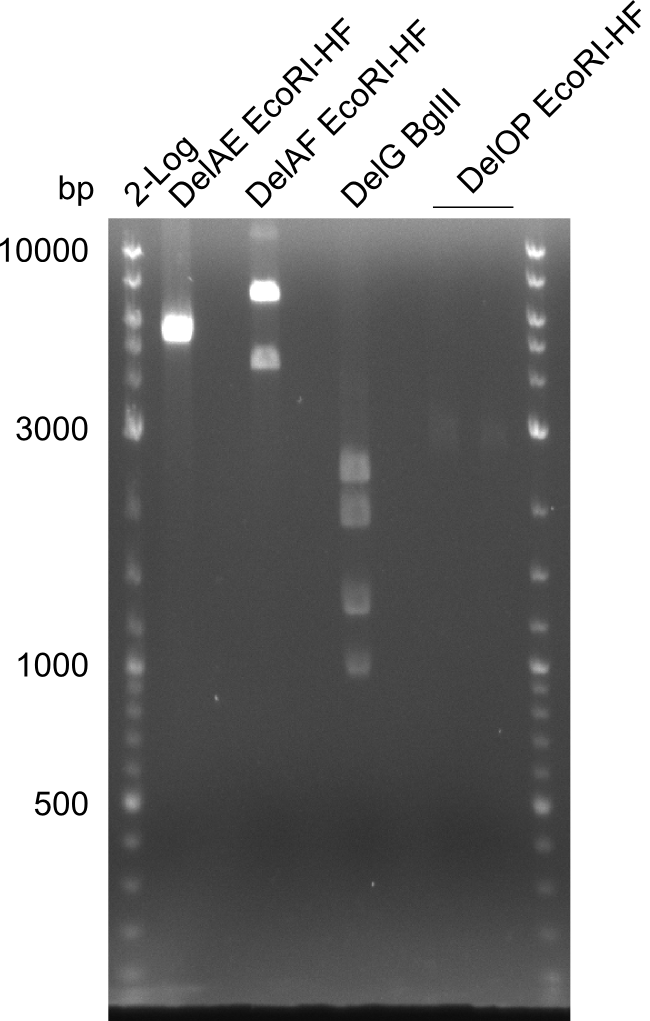
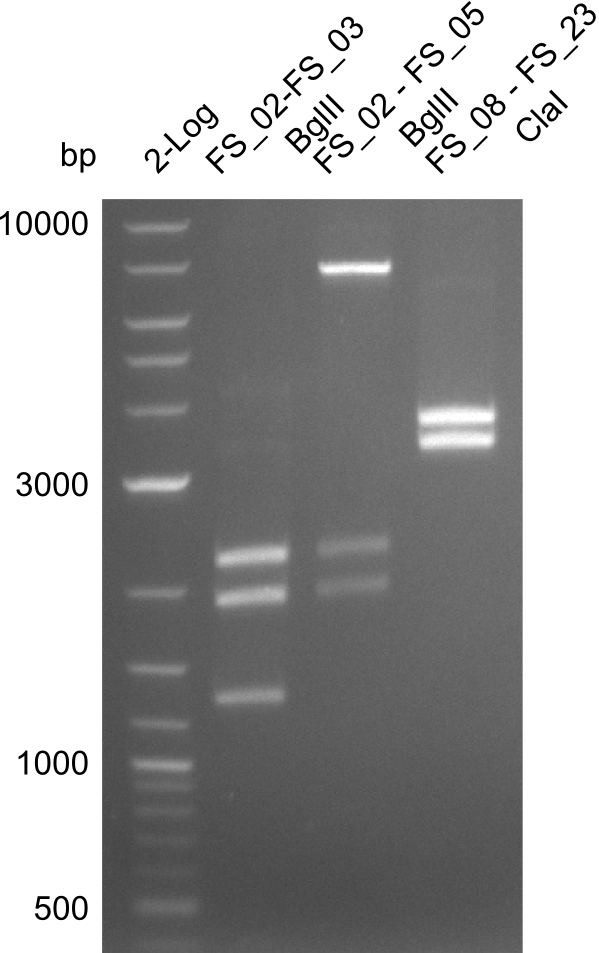
Expected fragment lengths: 2,146 kb; 1,862 kb; 1,306 kb
Results:
- Restriction digest shows the expected product sizes
- indicator for correct amplicon but to be sure, PCR product will be prepared for single read sequencing by GATC
T-Domain Shuffling – Assembly of ccdB Plasmids
In the subsequent weeks we wanted to exchange the indC T-domain with several T-domains of other NRPS modules. These are modules derived from the Tyrocidine and Delftibactin pathway, from the E. coli NRPS entF and two NRPS modules of unknown function from P. luminescens itself.
pRB11 (derived from pKH1), pRB12 (derived from pKH2) and pRB13 (derived from pRB3) carry the ccdB gene with a RBS instead of their native T-Domain, thus they express an unfunctional indC and the ccdb toxin which kills E. coli TOP10 cells. We extracted the ccdB gene from pDONR (Invitrogen, [http://www.lifetechnologies.com/order/catalog/product/12536017 pDONR™221]). E. coli OneShot ccdb survival cells produce an antidote to ccdB and are able to survive upon transformation with the ccdB carrying plasmid. After exchange of the ccdB gene with a novel T-domain only positive E. coli TOP10 transformants survive and the background colonies will be diminished.
Assembly and/or transformations were inefficient, as blue colonies on each plate suggest that an excess of template was contained in the transformation mix.
A ccdB PCR screening of pRB12 was positive but transformation in DH5alpha, TOP10 and OneShot ccdb survival cells showed that the ccdB gene is unfunctional. In the following, all the insert from pDONR was used including a promoter and the ccdA gene.
Also we used a two plasmid strategy to test every possible combination of engineered indigoidine synthetases and the respective PPTases. We worked with indC on pSB1C3 and the PPTases on separate pSK3K3 derived plasmids.
29-07-2013
Restriction digest of fragment FS_02 to FS_03 (5.3 kb; 27-07-2013; II) with BglII
Incubation at 37°C for about 3 h
| what | µL |
|---|---|
| FS_02 to FS_03 (27-07-2013; II) | 15 |
| BglII | 1 |
| Buffer 3.1 | 2 |
| dd H2O | 2 |
| Expected fragment lengths [bp] | 2146, 1862, 1306 |
Results:
- Restriction digest shows the expected product sizes
- indicator for correct amplicon but to be sure, PCR product will be prepared for single read sequencing by GATC
Indigoidine Production – Testing PPTases
pRB3 contains indC and sfp and results in a blue phenotype after tranformation of E. coli MG1655, BAP1 and TOP10. pRB4-10 plasmids code for different combinations of either indigoidine synthetase indC or bpsA and the PPTase sfp, svp, svp (pMM65) or entD. Transformation of E. coli TOP10 showed that all combinations result in indigoidine production. This week we validated these plasmids using colony PCR screenings and Sanger sequencing (GATC-biotech, Konstanz).
The PCR screening was inconclusive but sequencing results showed that all combinations of indC or bpsA with sfp, svp, svp (pMM65) or entD have been assembled correctly.
These results are remarkable since entD was previously described as an inefficient activator of indigoidine synthetases (Takahashi 2007). In the following week we prepared separate PPTase plasmids for co-transformation with engineered versions of indC. Also, we included the delC PPTase from D. acidovorans SPH-1, which is the PPTase involved in delftibactin synthesis.
07-08-2013
Sequencing Results
We send the following samples (amplified fragments of D. acidovorans DSM-39 and backbone pSB4K5 from the partsregistry) to GATC for sequencing:
- AE (FS_02-FS_03) with Primer FS_02
- AE (FS_02-FS_03) with Primer FS_03
08-08-2013
Amplification from FS_02 to FS_03; 5.3kb
- Reaction
| what | µL |
|---|---|
| D. acidovorans SPH-1 | 1 |
| FS_02: (1/10) | 4 |
| FS_03: (1/10) | 4 |
| Phusion flash Master Mix | 10 |
- Conditions
| Biometra TProfessional Basic | ||
|---|---|---|
| Cycles | temperature [°C] | Time [s] |
| 1 | 98 | 10 |
| 30 | 98 | 1 |
| 58 | 5 | |
| 72 | 1:30 | |
| 1 | 72 | 7min |
| 1 | 12 | inf |
Results:
- Amplification of DelAE was repeated successfully with the new strain SPH-1
- bands were cut out and DNA purified using QIAquick Gel Extraction Kit
- if fragment is used in Gibson assembly the amplification has to be repeated to increase the amount of product
T-Domain Shuffling – PPTase Plasmids
This week we wanted to prepare plasmids for the T-Domain exchange experiments. We assembled four plasmids pRB15-18, each containing one PPTase on the pSB3K3-backbone with a kanamycine resistance. These plasmids should be used for co-transformations with the engineered indigoidine synthetase indC on a pSB1C3 plasmid pRB19 with a chloramphenicole resistance.
We successfully assembled pRB15-18.
BioBricks for the Registry
As a first set of BioBricks we chose the coding sequences of the four PPTases sfp, svp, entD and delC as well as the indigoidine synthetase indC. Since indC contains two internal RFC[10] cutting sites (EcoRI and SpeI), the DNA sequence had to be mutated for the part submission. Therefore we first assembled pRB21, which is identical to pRB3 but doesn't contain a PPTase.
We successfully assembled pRB21 and amplified the PPTases with the BioBrick RFC[10] prefix and suffix (Primer KH13-20). Next week we cloned the PPTases into the pSB1C3 backbone using restriction cloning and removed the EcoRI and SpeI cutting sites contained in indC using a CPEC mutagenesis strategy.
12-08-2013
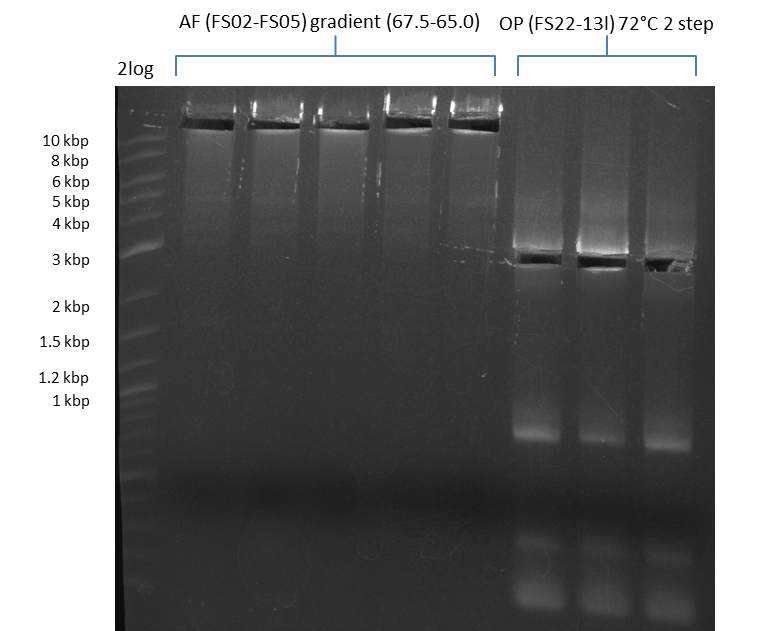
Amplification from FS_02 to FS_05; 11.2 kb
- Reaction
| Reagent | DelAF | |||||||||
|---|---|---|---|---|---|---|---|---|---|---|
| Template | D.acidovorans SPH-1 colony | |||||||||
| Primer fw | 4.5 µL FS_02 | |||||||||
| Primer rev | 4.5 µL FS_05 | |||||||||
| DMSO | 1 µL | |||||||||
| Phusion Ready Mix | 10 µL | |||||||||
- Conditions
| Biometra TProfessional Basic | ||
|---|---|---|
| Cycles | temperature [°C] | Time [s] |
| 1 | 98 | 10 |
| 12 | 98 | 1 |
| 67.5 - 65.0 (ΔT = 0.5) ↓ 0.5 | 5 | |
| 72 | 3:20 | |
| 18 | 98 | 1 |
| 65.5 - 63.0 (ΔT = 0.5) | 5 | |
| 72 | 3:20 | |
| 1 | 72 | 10min |
| 1 | 10 | inf |
Results:
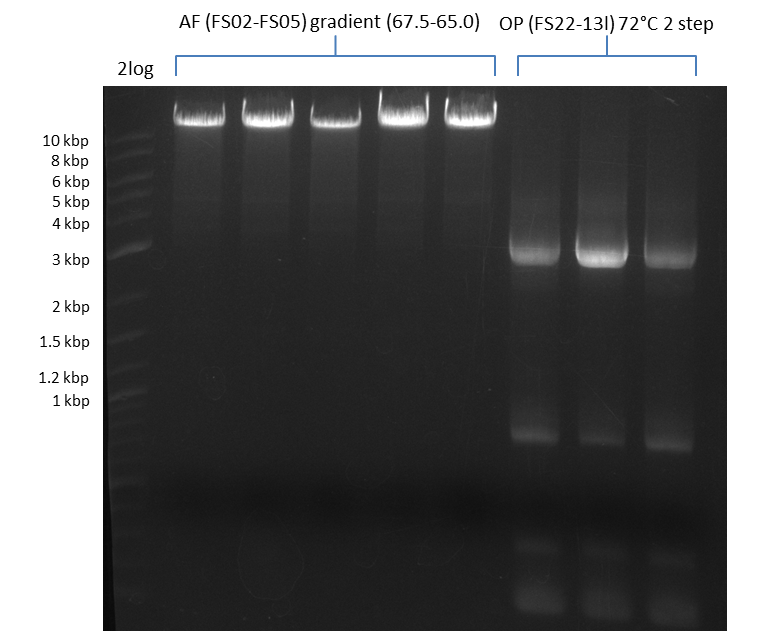
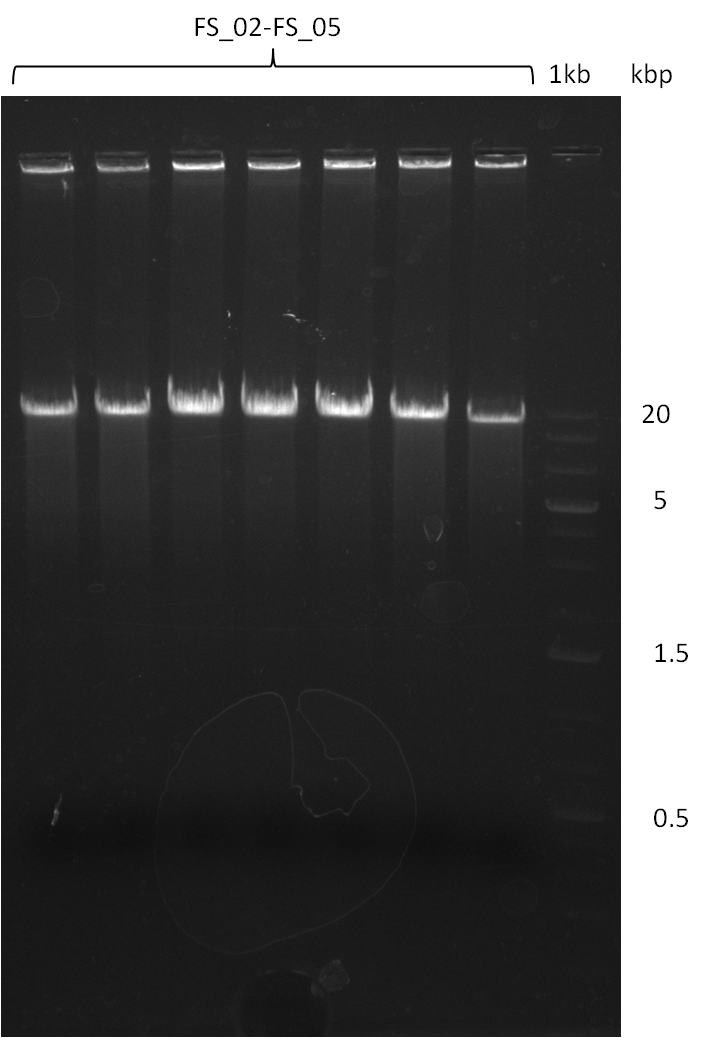
- Amplification of DelAF worked well, gradient displays an optimal annealing temperature of 65.5°C, which will be used for further amplifications
- bands were cut out and DNA purified using QIAquick Gel Extraction Kit
13-08-2013
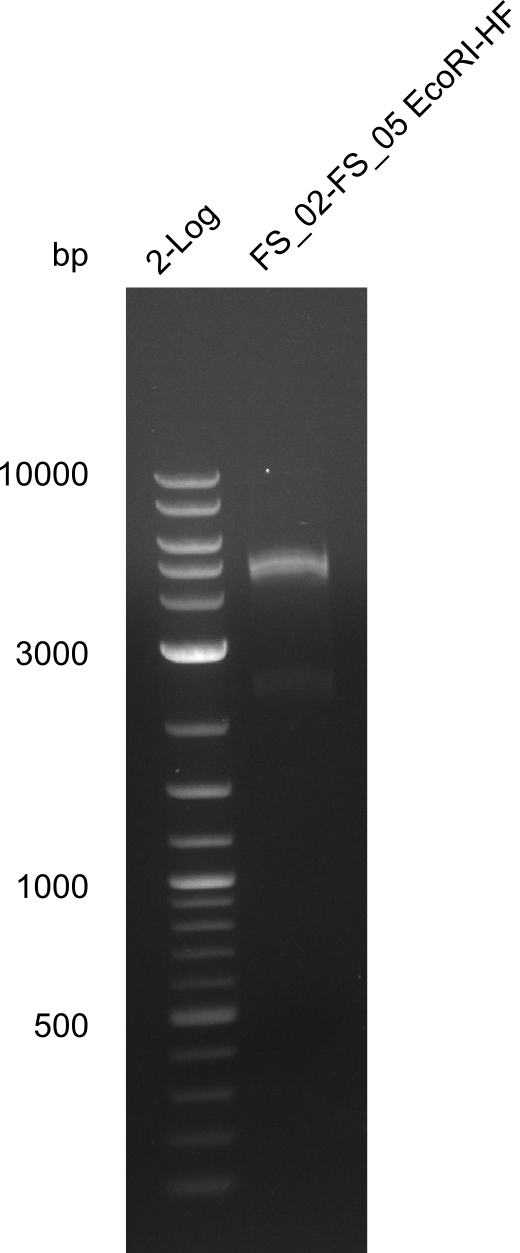
Restriction digest of fragment FS_02 to FS_05; 11.2 kb; 12-08-2013 with EcoRI-HF
Incubation at 37°C for 2 hours
| what | µL |
|---|---|
| FS_02 to FS_05 (12-08-2013) | 20 |
| EcoRI-HF | 1 |
| CutSmart Buffer | 2.5 |
| dd H2O | 1.5 |
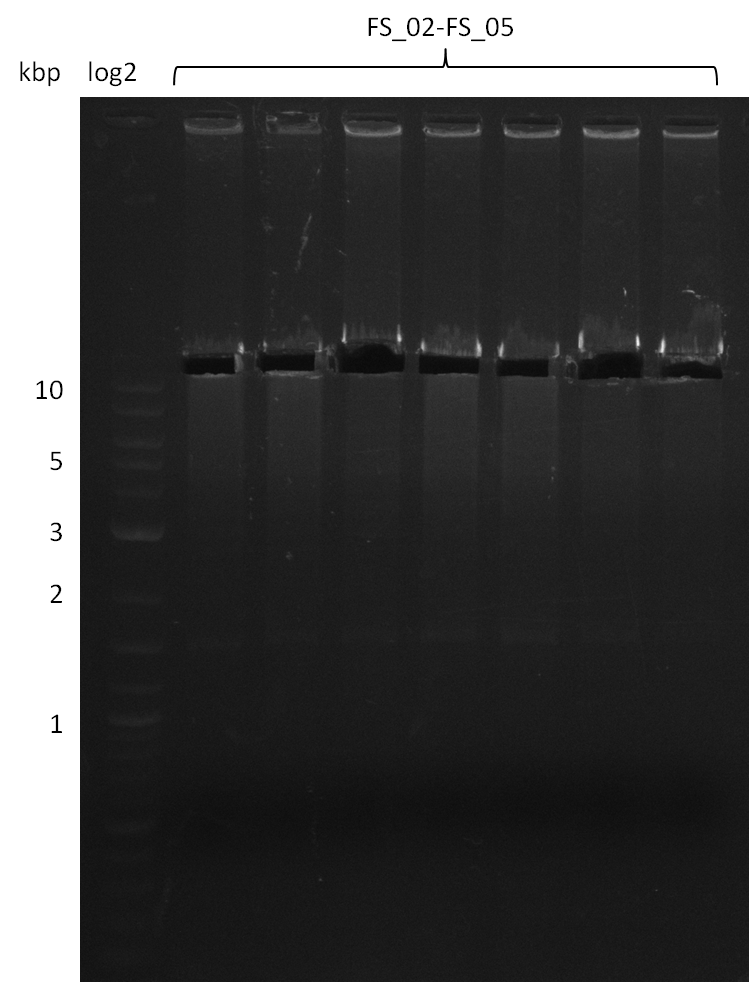
Expected fragment sizes: 2.26kbp; 4.62kbp; 4.32kbp
Results:
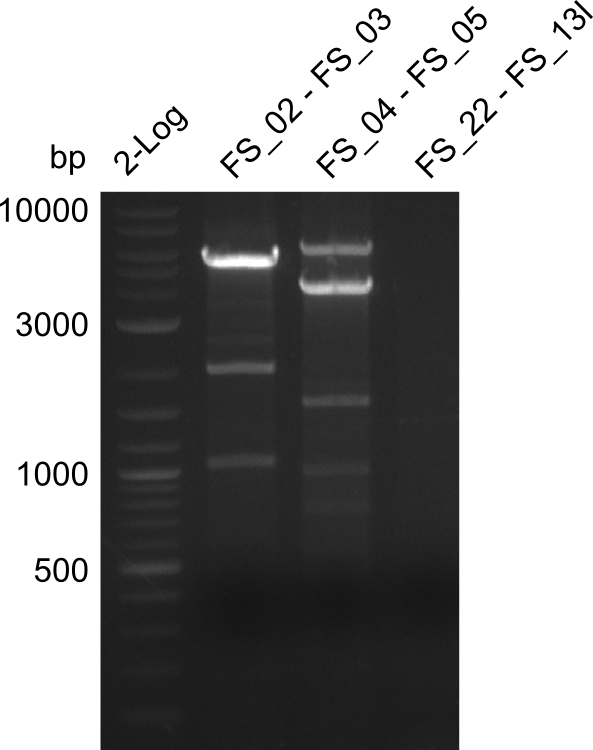
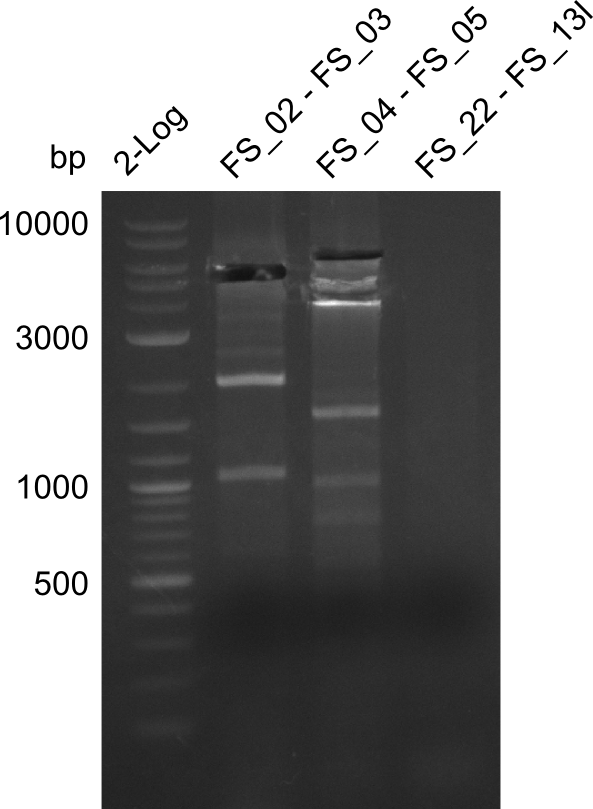
- Weak bands of about 4.6kbp visible, as well as on of about 2.6kbp
- digest will be repeated using higher concentrations of DNA to clearify results of restriction digest
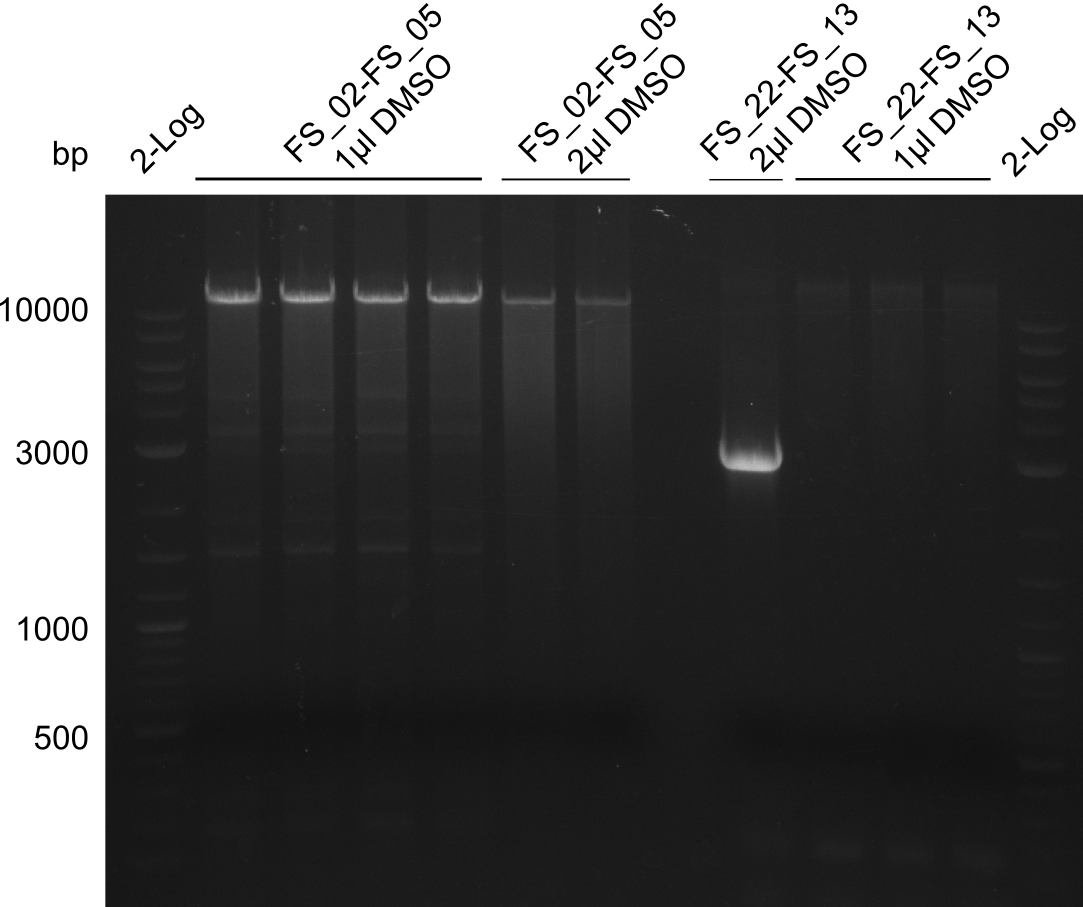
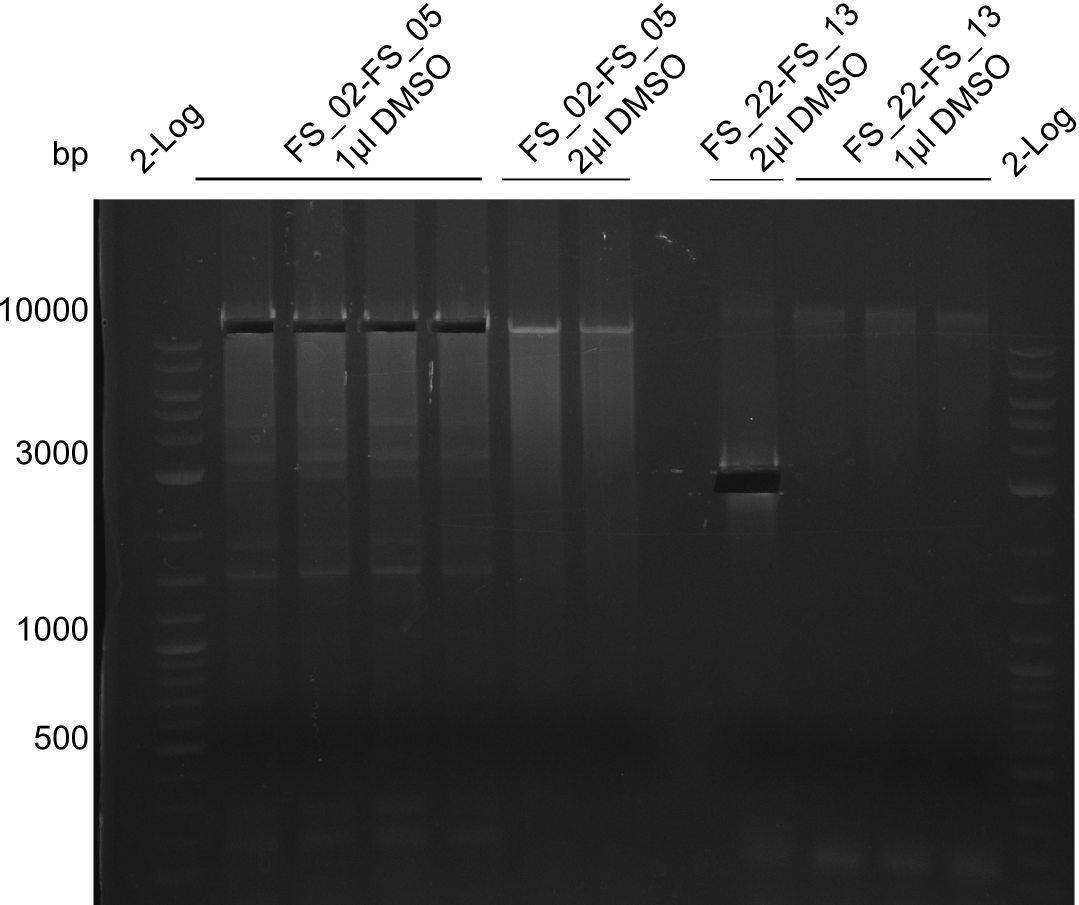
Amplification from FS_02 to FS_05; 11.2 kb
- Reaction
1 sample contains 2µL of DMSO
| Reagent | DelAF | |||||||||
|---|---|---|---|---|---|---|---|---|---|---|
| Template | D.acidovorans SPH-1 colony | |||||||||
| Primer fw | 4.5 µL FS_02 | |||||||||
| Primer rev | 4.5 µL FS_05 | |||||||||
| DMSO | 1 µL | |||||||||
| Phusion Ready Mix | 10 µL | |||||||||
- Conditions
| Biorad T100 | ||
|---|---|---|
| Cycles | temperature [°C] | Time [s] |
| 1 | 98 | 10 |
| 12 | 98 | 1 |
| 65.5 ↓ 0.5 | 5 | |
| 72 | 3:20 | |
| 18 | 98 | 1 |
| 63.5 | 5 | |
| 72 | 3:20 | |
| 1 | 72 | 10min |
| 1 | 10 | inf |
Results:
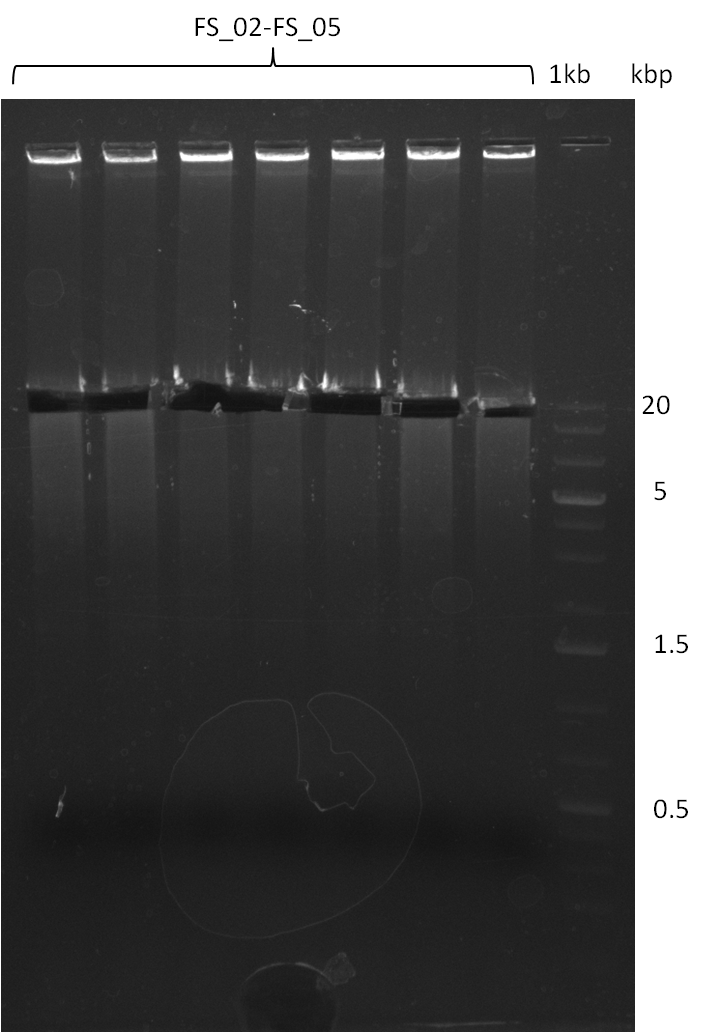
- Amplification of DelAF worked though a slight smear occured, therefore PCR will be repeated on the more precise Biometra TProfessional Basic cylcer again
- bands were cut out and DNA purified using QIAquick Gel Extraction Kit
14-08-2013
Concentration measurement (FS_02 to FS_05; 11.2 kb)
| Fragment | Primer | Date PCR | Concentration |
|---|---|---|---|
| DelAF | FS02-FS05 | 11-08-2013 | ~10 ng/µL |
| DelAF | FS02-FS05 | 12-08-2013 | 0 ng/µL |
| DelAF | FS02-FS05 | 12-08-2013 | 0 ng/µL |
Results:
- concentrations are not sufficient for gibson assembly
- PCR will be repeated and gel slices of different reactions will be pooled for one gel extraction using QIAquick Gel Extraction Kit to obtain the concentrations needed for gibson assembly
Restriction digest of fragment FS_02 to FS_05; 11.2 kb; 11-08-2013 with EcoRI-HF
Incubation at 37°C for 2 hours 45min
| what | µL |
|---|---|
| FS_02 to FS_05 (11-08-2013) | 18 |
| EcoRI-HF | 1 |
| CutSmart Buffer | 2.5 |
| dd H2O | 3.5 |
Expected fragment sizes: 2.26kbp; 4.62kbp; 4.32kbp
Results:
- One band of about 5kbp and one of 2.5kbp
- no clear result, digest will be repeated with another enzyme (ClaI), as the enzyme used was beyond expiration date
Restriction digest of fragment FS_02 to FS_05; 11.2 kb; 10-08-2013 with ClaI
Incubation at 37°C for 2 hours
| what | µL |
|---|---|
| FS_02 to FS_05 (10-08-2013) | 20 |
| ClaI | 1 |
| CutSmart Buffer | 2.5 |
| dd H2O | 1.5 |
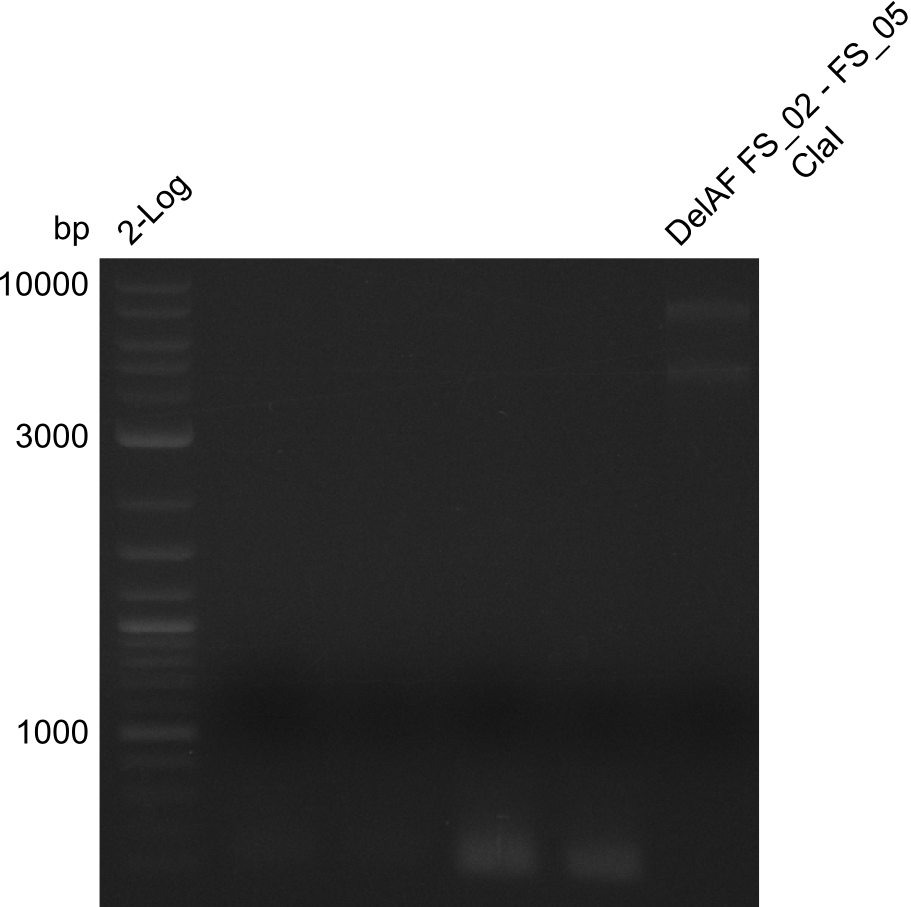
Expected fragment sizes: 6.9kbp, 4.3kbp
Results:
- restriction digest displays the expected fragments, therefore amplification of the desired fragment can be assumed
- PCR product will be prepared for sequencing by GATC to proof amplification of the desired DNA sequence before Gibson Assembly
17-08-2013
Amplification from FS_02 to FS_05; 11.2 kb
- Reaction of DelAF
6x20 µL
| Reagent | DelAF | |||||||||
|---|---|---|---|---|---|---|---|---|---|---|
| Template | D.acidovorans SPH-1 colony | |||||||||
| Primer fw | 2.5 µL FS_02 | |||||||||
| Primer rev | 2.5 µL FS_05 | |||||||||
| Phusion Ready Mix | 10 µL | |||||||||
| DMSO | 1 µL | |||||||||
| dd H2O | 4 µL | |||||||||
- Conditions
| Biometra TProfessional Basic | ||
|---|---|---|
| Cycles | temperature [°C] | Time [s] |
| 1 | 98 | 10 |
| 12 | 98 | 1 |
| 65.5 ↓ 0.5 | 5 | |
| 72 | 3:20 | |
| 18 | 98 | 1 |
| 63.5 | 5 | |
| 72 | 3:20 | |
| 1 | 72 | 10min |
| 1 | 10 | inf |
Results:
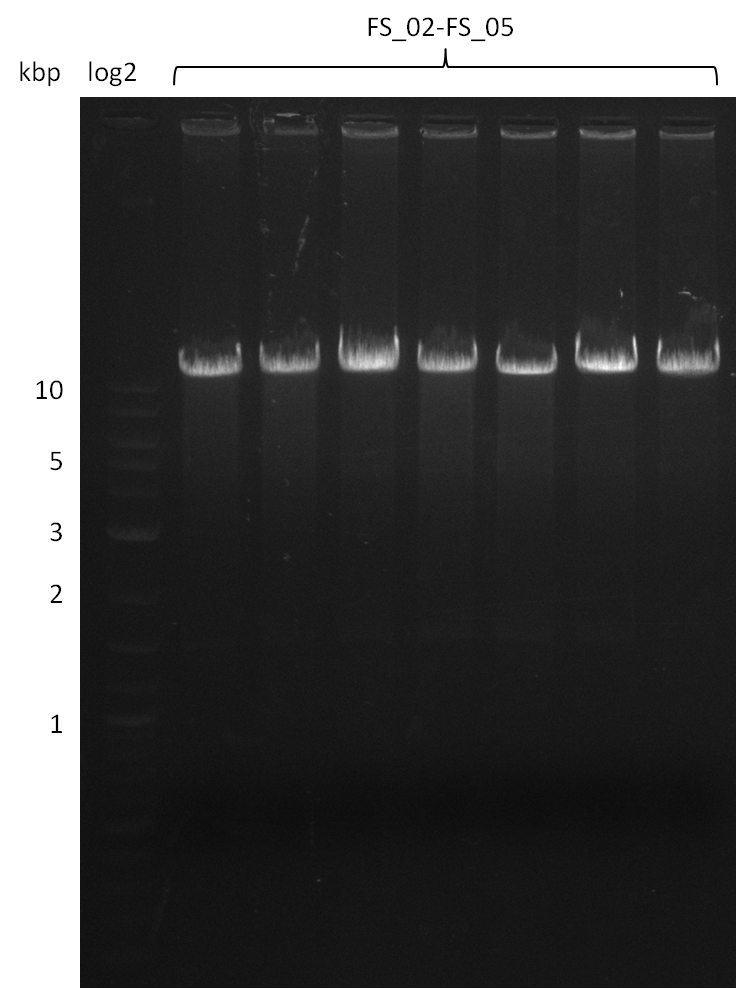
- Amplification of DelAF worked
- bands were cut out, pooled and DNA purified using QIAquick Gel Extraction Kit to obtain concentrations needed for gibson assembly
18-08-2013
Amplification from FS_02 to FS_05; 11.2 kb
- Reaction of DelAF
6x20 µL
| Reagent | DelAF | |||||||||
|---|---|---|---|---|---|---|---|---|---|---|
| Template | D.acidovorans SPH-1 colony | |||||||||
| Primer fw | 2.5 µL FS_02 | |||||||||
| Primer rev | 2.5 µL FS_05 | |||||||||
| DMSO | 1 µL | |||||||||
| Phusion Ready Mix | 10 µL | |||||||||
| dd H2O | 4 µL | |||||||||
- Conditions
| Biometra TProfessional Basic | ||
|---|---|---|
| Cycles | temperature [°C] | Time [s] |
| 1 | 98 | 10 |
| 12 | 98 | 1 |
| 65.5 ↓ 0.5 | 5 | |
| 72 | 3:20 | |
| 18 | 98 | 1 |
| 63.5 | 5 | |
| 72 | 3:20 | |
| 1 | 72 | 10min |
| 1 | 10 | inf |
Results:
- Amplification of DelAF worked
- bands were cut out and DNA purified using QIAquick Gel Extraction Kit
T-Domain Shuffling
We started inserting new T-Domains into indC to check their functionality. In total we first assembled 19 variants of pRB19, which are named pRB19-Txx. The appended three-letter code identifies the respective T-domain or TTE-domain and is listed on our plasmid page in the materials section.
Since PCR screenings of pRB19 were inconsistent, we started with replacing the T-Domain of pRB14, which contains sfp as a PPTase. Screenings and sequencing results showed that assembly and transformation were correct but all colonies except for that on the positive control retained a white phenotype. We tested all the other T-domains on the newly assembled pRB19 with every PPTase pRB15-18 next week.
T-Domain Shuffling – PPTase Plasmids
As the PPTase plasmids pRB15-18 showed red colonies after retransformation of a positively prepped colony, we picked new colonies and prepped them. We will do the co-transformation experiments with the new version of pRB15 but with the old ones of pRB16-18.
BioBricks for the Registry
This week we removed the two internal RFC[10]-cutting sites of indC (EcoRI and SpeI) on pRB21 using a CPEC approach to yield pRB22]. The modified indC (indC*) was amplified introducing the RFC[10] prefix and suffix (Primer KH21/22). The four PPTases and indC* coding sequences were cloned into pSB1C3 using standard BioBrick Assembly.
Due to faulty primer design of RB71, the resulting plasmid pRB22 was incorrect as well. We ordered a corrected version of RB78 and assembled the plasmids again in the following week.
19-08-2013
Concentration measurement
The concentration of the gel purified, and DpnI digested fragments was measured using a NanoDrop Instrument.
| Fragment | Primer | Date PCR | Concentration |
|---|---|---|---|
| pSB4K5 DpnI digested | FS_01-FS_16 | 17-08-2013 | 101.2 ng/µl |
| pSB4K5 DpnI digested | FS_01-FS_16 | 18-08-2013 | 159.2 ng/µl |
T-Domain Shuffling
We again assembled pRB19 from pRB14 and did all T-domain-exchanges in this plasmid. After we picked and prepped positive colonies we performed co-transformations with pRB15-18 to see which PPTases are able to activate any of the T-domains inserted into indC.
To obtain experimental validation that the strategy to use two separate plasmids works and to verify that the PPTase plasmids are free of template backbone we co-transformed TOP10 cells with pRB21 and pRB15-18.
In parallel we assembled pKH4, which is derived from pRB14. The sfp coding sequence was replaced by a nonsense part of pMM65 using the cutting sites BamHI and NheI. In this way, we were independent from the success of the assembly of pRB19.
BioBricks for the Registry
After the corrected primer RB78 arrived we assembled pRB22 and cloned the BioBricks pKH6-10 for the part submission.
19-08-2013
Concentration measurement
The concentration of the gel purified, and DpnI digested fragments was measured using a NanoDrop Instrument.
| Fragment | Primer | Date PCR | Concentration |
|---|---|---|---|
| pSB4K5 DpnI digested | FS_01-FS_16 | 17-08-2013 | 101.2 ng/µl |
| pSB4K5 DpnI digested | FS_01-FS_16 | 18-08-2013 | 159.2 ng/µl |
Domain Shuffling – PPTase Plasmids
The PPTase plasmids pRB15-18 have been reassembled with pSB3K3 from a different plate of the partsdistribution, using a CPEC approach. This week we validated those plasmids. Additionally, we assembled them by restriction cloning.
T-Domain Shuffling
Last week we assembled pKH4, which is a pSB1C3 derived plasmid coding for indC but lacking a PPTase. We validated the plasmid and used it as the template to assemble pKH5 in which the T-domain of indC were replaced by ccdB. In parallel and as a backup strategy, we assembled pRB19 using restriction cloning.
As a second backup strategy, we assembled pRB22 and pRB23 using CPEC with single fragments that were amplified from a P. luminescens cell pellet.
Both pKH5 and pRB22 were correct as seen by PCR screenings and sequencing. We used pRB22 to assemble pRB23, which is the ccdB-variant of pRB22, enabling to test every combination of T-domain in co-expression with the four PPTases.
19-08-2013
Concentration measurement
The concentration of the gel purified, and DpnI digested fragments was measured using a NanoDrop Instrument.
| Fragment | Primer | Date PCR | Concentration |
|---|---|---|---|
| pSB4K5 DpnI digested | FS_01-FS_16 | 17-08-2013 | 101.2 ng/µl |
| pSB4K5 DpnI digested | FS_01-FS_16 | 18-08-2013 | 159.2 ng/µl |
T-Domain Shuffling
We prepared pRB23-T1 to -TTE19 and performed transformations in E. coli TOP10 as well as co-transformations with the four PPTase plasmids pRB15-18 and a pSB3K3-plasmid with a nonsense insert. This shows whether there is a dependency of T-Domain activation on the PPTases and if there are differences in indigoidine yield using different combinations of T-Domains and PPTases. The co-transformation with a pSB3K3 plasmid with a nonsense insert shows whether the smaller size of the colonies in our co-transformation experiments is due to the co-transformation itself or to the PPTases.
We sequenced every variant of pRB23-Txx and they were all correct. The cotransformation experiment showed, that some of the engineered indigoidine synthetases are still capable of producing the blue pigment. The indigoidine production strongly differs among the various T-Domains. All the combinations are shown in a big table in the detailled lab journal below.
T-Domain Borders
This week we tried to assemble pRB23-b11 to -b34, which are 12 pRB22-derived plasmids, in which the indC-T-Domain was exchanged by the bpsA T-domain. In every variant, the domain borders were defined differently. Those constructs were co-transformed with the four PPTase plasmids pRB15-18 as well as with a pSB3K3 plasmid containing a nonsense insert (Transformation strain: E. coli TOP10). The appearance of blue colonies on the plates showed which domain borders work best for the domain exchange between functionally related NRPS.
The cotransformations of the pRB23-bxx CPEC assembly products with the PPTase plasmids was not successful. Therefore, we prepared plasmid DNA of the pRB23-bxx variants and repeated the co-transformation experiments.
T-Domain Shuffling – PPTase Plasmids
As there is always leaky expression of indC* - due to the fact that E. coli TOP10 lacks the lac repressor and we use a lacPromoter - we assembled variants of the PPTase plasmids which also carry the lacI gene with a lacPromoter.
Engineered indC - Quantitative Assay
Since we want to characterize the indC*-variants and PPTases in a quantitative manner, we establish an assay for measuring the correlations between T-domains, PPTases, growth rate and indigoidine production using OD measurements. We take 96 well plates and measure absorption spectra of various indigoidine producing cultures.
19-08-2013
Concentration measurement
The concentration of the gel purified, and DpnI digested fragments was measured using a NanoDrop Instrument.
| Fragment | Primer | Date PCR | Concentration |
|---|---|---|---|
| pSB4K5 DpnI digested | FS_01-FS_16 | 17-08-2013 | 101.2 ng/µl |
| pSB4K5 DpnI digested | FS_01-FS_16 | 18-08-2013 | 159.2 ng/µl |
BioBricks for the Registry
This week we prepared our parts for submission to the registry. We submitted the coding sequences of indC, sfp, svp, entD and delC, as well as expression constructs coding for indC with the exchanged T-domains that resulted in a blue phenotype. These are pRB22 and pRB23-T8, -T10, -T12, -T13, -T14. We also submitted our construct in which the indC-T-Domain is exchanged by the ccdB gene.
A table of all the parts we submitted can be found on the Parts site.
Engineered indC – Quantitative Assay
We started with the detailled characterization of our engineered indC-variants using a Tecan infinite M200 plate reader to measure the absorbance spectra of 52 liquid cultures of different (co-)transformants over time. The table in the detailled lab journal shows the loading scheme of our 96 well plate and the transformants we used.
Since a variant of indC, where the T-domain has been exchanged by the bpsA T-domain with the specific domain borders b31 resulted in a blue phenotype, we ordered primers to try other native T-Domains with these newly defined domain borders.
19-08-2013
Concentration measurement
The concentration of the gel purified, and DpnI digested fragments was measured using a NanoDrop Instrument.
| Fragment | Primer | Date PCR | Concentration |
|---|---|---|---|
| pSB4K5 DpnI digested | FS_01-FS_16 | 17-08-2013 | 101.2 ng/µl |
| pSB4K5 DpnI digested | FS_01-FS_16 | 18-08-2013 | 159.2 ng/µl |
T-domain shuffling
Last week's co-transformation experiments showed that exchanging the indC-T-domain with the bpsA T-domain results in a functional indigoidine synthetase, provided specific domain borders were chosen. We now used this domain borders to also try the other native T-Domains T3-9 from B. parabrevis, D. acidovorans, P. luminescens and E. coli. We assembled the pRB23 variants T3 to T9 with the domain borders b31 and performed co-transformations with the PPtase plasmids pRB15-18.
We analyzed the data of the spectral absorption measurements versus time and compared the growth synamics and pigment production between different engineered indigoidine synthetases in interplay with different PPTases.
Controlling Indigoidine synthesis
Furthermore we co-transformed E. coli TOP10 with the lacI-Sfp-constructs and pRB22 to determine whether the indigoidine production is controllable.
The lacI-sfp-constructs were not functional because the transformed cells did not turn blue even if induced.
Instead we tried the E. coli NEB Turbo strain which overexpresses the lac repressor. In this way, leaky expression and thereby growth retardation might be prevented.
19-08-2013
Concentration measurement
The concentration of the gel purified, and DpnI digested fragments was measured using a NanoDrop Instrument.
| Fragment | Primer | Date PCR | Concentration |
|---|---|---|---|
| pSB4K5 DpnI digested | FS_01-FS_16 | 17-08-2013 | 101.2 ng/µl |
| pSB4K5 DpnI digested | FS_01-FS_16 | 18-08-2013 | 159.2 ng/µl |
Domain Shuffling – Indigoidine Synthetase Conversions
Besides the delH4 T-domain only the plu2642 T-domain resulted in a functional indigoidine synthetase when introduced to indC. We used our NRPS-Designer to predict the domain sequence of plu2642 and the selectivity of its A-domain and found that it is a single-module NRPS with the domain sequence A, T, TE. Its A-domain exhibits glutamine specificity, analogous to our indigoidine synthetase. Also the basic domain sequence is similar, whereas the internal oxidation domain of indC is missing in plu2642.
Another NRPS module which shows glutamine specificity is tycC2 from the Tyrocidine pathway (further described in the <a href="https://2013.igem.org/Team:Heidelberg/Project/Tyrocidine">Peptide Synthesis Project Page</a>).
To take the domain shuffling experiment even one step further, we assembled every possible domain combination involving the indC oxidation domain and an A-, T- and TE-domain from indC. plu2642 or tycC2 and transform a given, naturally occuring NRPS module into a functional indigoidine synthetase.
Engineered indC – Quantitative Assay
This week we also repeated the spectral measurement of our engineered indC variants cotransformed with single PPTases to see which combination of PPTase and T-domain is most efficient in producing indigoidine.
19-08-2013
Concentration measurement
The concentration of the gel purified, and DpnI digested fragments was measured using a NanoDrop Instrument.
| Fragment | Primer | Date PCR | Concentration |
|---|---|---|---|
| pSB4K5 DpnI digested | FS_01-FS_16 | 17-08-2013 | 101.2 ng/µl |
| pSB4K5 DpnI digested | FS_01-FS_16 | 18-08-2013 | 159.2 ng/µl |
 "
"


