|
- Overview
- Winter
- Spring
- Summer
- Fall
|
1. Goals for the week
2.Experiments and results
5.9 T7+ Liquid Culture Phage Concentration Test #2
- We infected E. coli BL21 with different concentrations (1ul, 10ul, and 100ul) of phage to see which would yield the highest titer. Plaques formed up to -8 on all the spot tests, showing that the concentration difference had no effect on the titer. However, the plates were badly contaminated.
5.13 Determining E. coli Concentration With Spectrophotometer
- To check if we could determine E. coli concentration with a spectrophotometer, we created a 7/5 dilution series of E. coli. We then measured the absorption at 600nm of each E. coli dilution. When plotted, these measurements showed a linear relationship between E. coli concentration and the absorption reading.
-

5.15 Titer Test on 5.3 T7 new Phage Stock
- Created a 1:10 dilution series with 5.3 T7 stock. We then created titers of -5, -6, -7, and -8. -5, -6, and -7 plates all had overlapping plaques. However, the -8 plate had 7 plaques, giving us an estimated phage concentration of 7E8 particles/20ul.
5.20 Mutagen Concentration Experiment
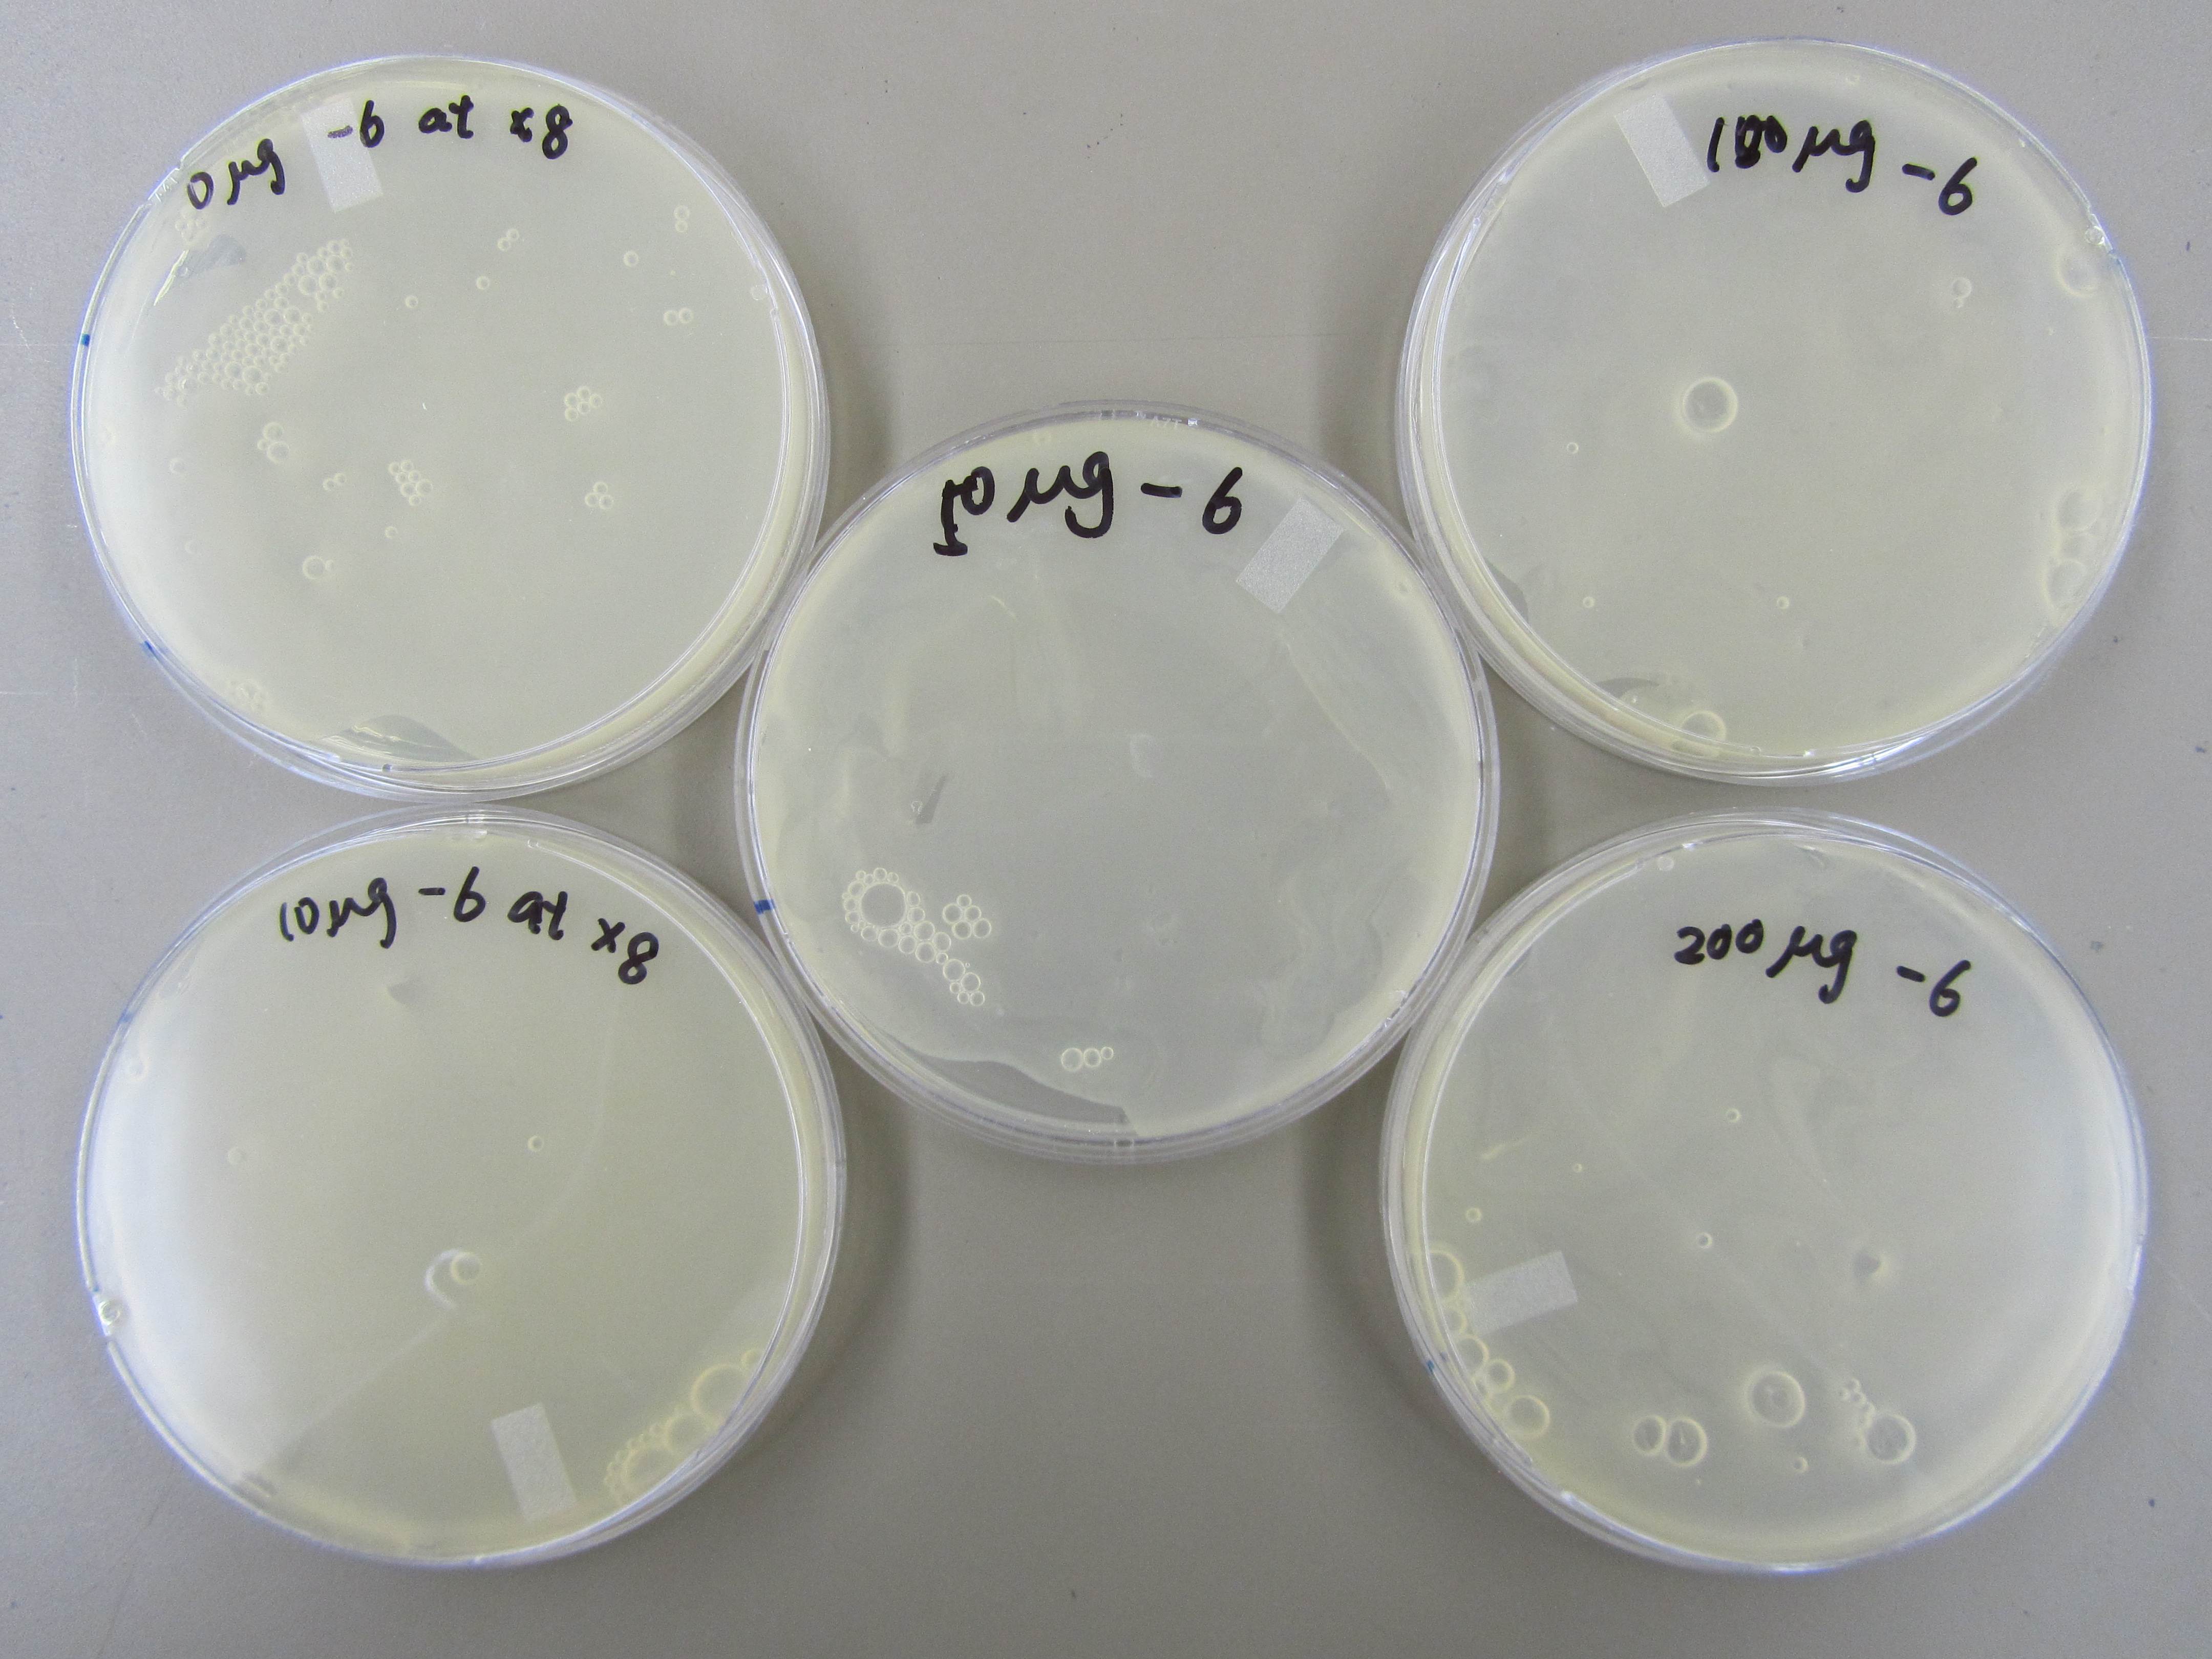
- In order to determine the best concentration of mutagen to use, we infected the E. coli in 5 tubes with 0ul, 10ul, 50ul, 100ul, and 200ul of our mutagen, 5-bromodeoxyuridine. We then added 6uL of 5.3 phage stock to each tube, allowed it to incubate for 20 minutes, and purified the phage. Next, we made a dilution series and performed a spot test and found that when the mutagen concentration is increased, the concentration of phage is decreased. We then performed titers from -6, -7, and -8 of phage from our dilution series with x8 top agar. There are a couple plaques on each plate.
3. Next Steps
|
 "
"

