From 2013.igem.org
ccdb Construct
Amplification
ccdb-C(tycC2)-indC plasmid (pJS01)
Amplification of C(tycC2), ccdB and pSB1C3 DNA fragments (indC was stored in the fridge from former experiments).
- ccdB pcr contents
| What | µl
|
| primer_fw (PW38) | 2
|
| primer_rv (PW41) | 2
|
| template (Gateway pDONR vector) | 2
|
| Phusion Flash 2x Master Mix | 10
|
| ddH20 | 4
|
- PCR-Program ccdB sequence
| Cycles | Temperature [°C] | Time [min:s]
|
| 1 | 98 | 0:10
|
| 8 | 98 | 0:01
|
| 70 ↓0.5 | 0:05
|
| 72 | 0:15
|
| 28 | 98 | 0:01
|
| 65 | 0:05
|
| 72 | 0:15
|
| 1 | 72 | 1:30
|
| 1 | 10 | inf
|
- pSB1C3 PCR contents
| wWhat | µl
|
| primer_fw (PW23) | 2
|
| primer_rv (PW42) | 2
|
| template (pSB1C3) | 0.5
|
| Phusion Flash 2x Master Mix | 10
|
| ddH20 | 5.5
|
- PCR-Program pSB1C3 sequence
| Cycles | Temperature [°C] | Time [min:s]
|
| 1 | 98 | 2:00
|
| 35 | 98 | 0:05
|
| 60 | 0:20
|
| 72 | 1:00
|
| 1 | 72 | 10:00
|
| 1 | 10 | inf
|
- C(TycC2) PCR contents
| What | µl
|
| primer_fw(PW21) | 2
|
| primer_rv(PW14) | 2
|
| template (B. Parabrevis) | 1
|
| Phusion Flash 2x Master Mix | 10
|
| ddH20 | 5
|
- PCR-Program C(TycC2)
| Cycles | Temperature [°C] | Time [min:s]
|
| 1 | 98 | 2:00
|
| 35 | 98 | 0:01
|
| 59 | 0:05
|
| 72 | 1:00
|
| 1 | 72 | 5:00
|
| 1 | 10 | inf
|
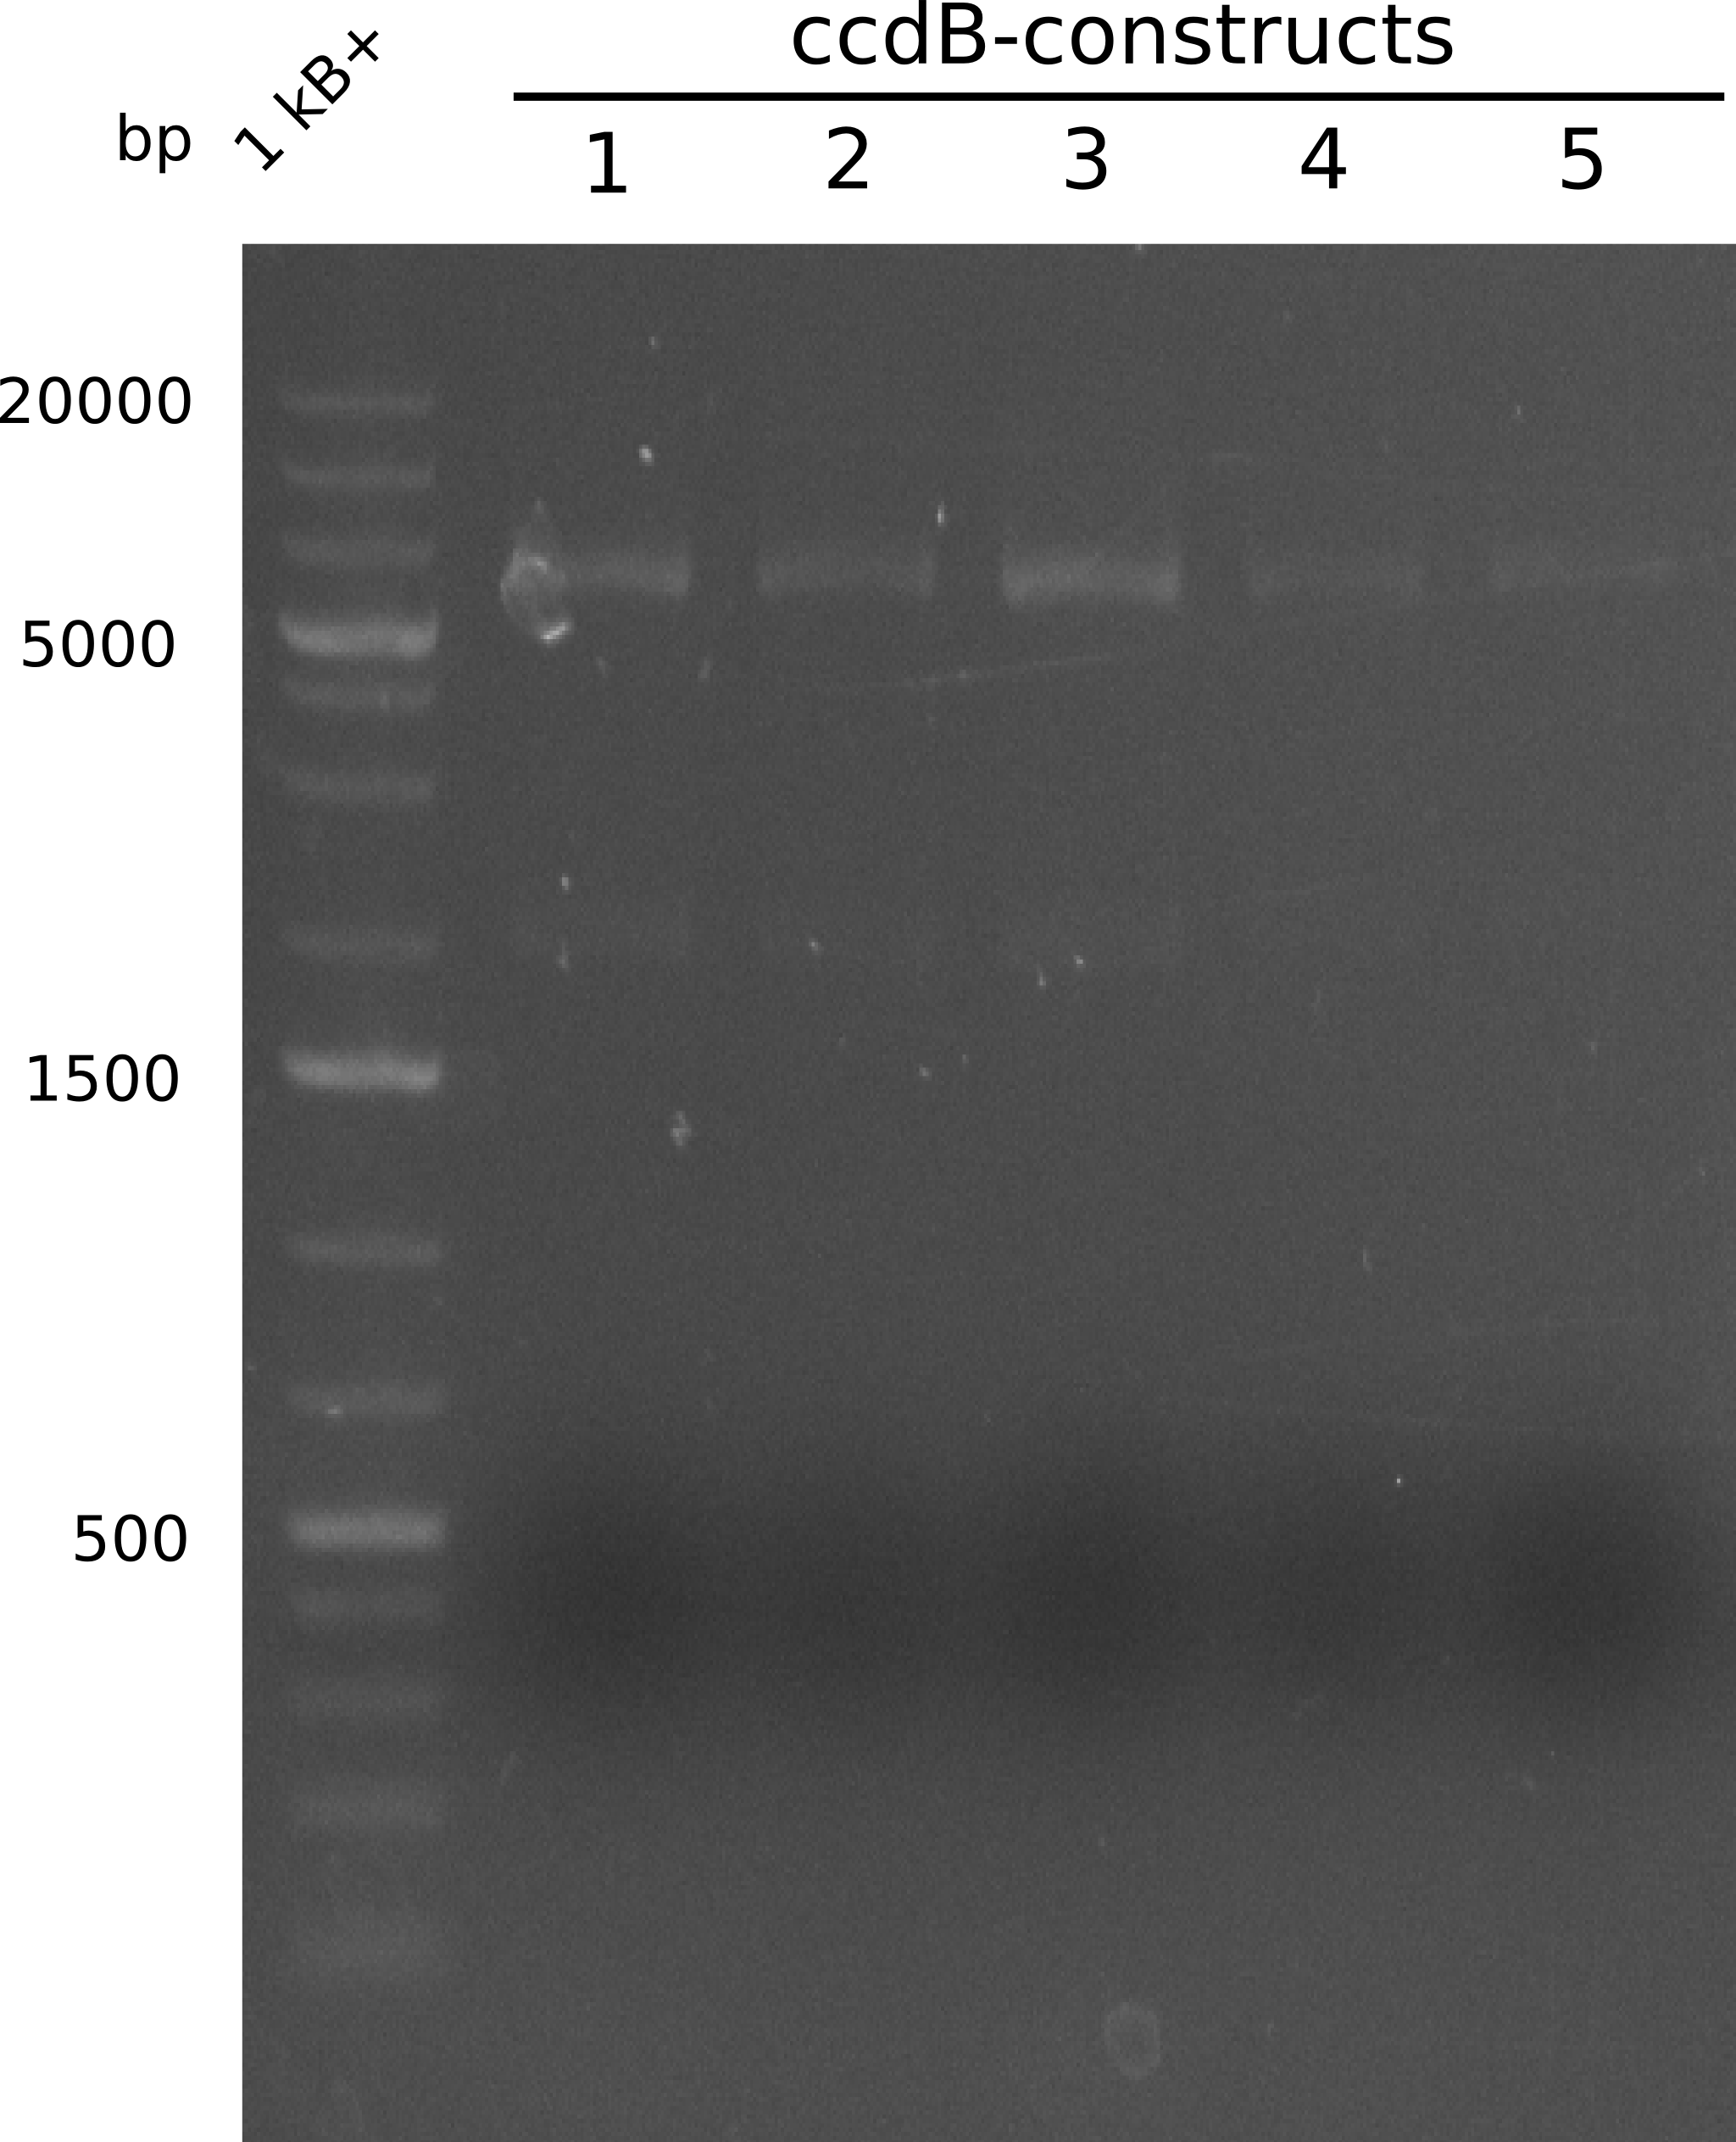
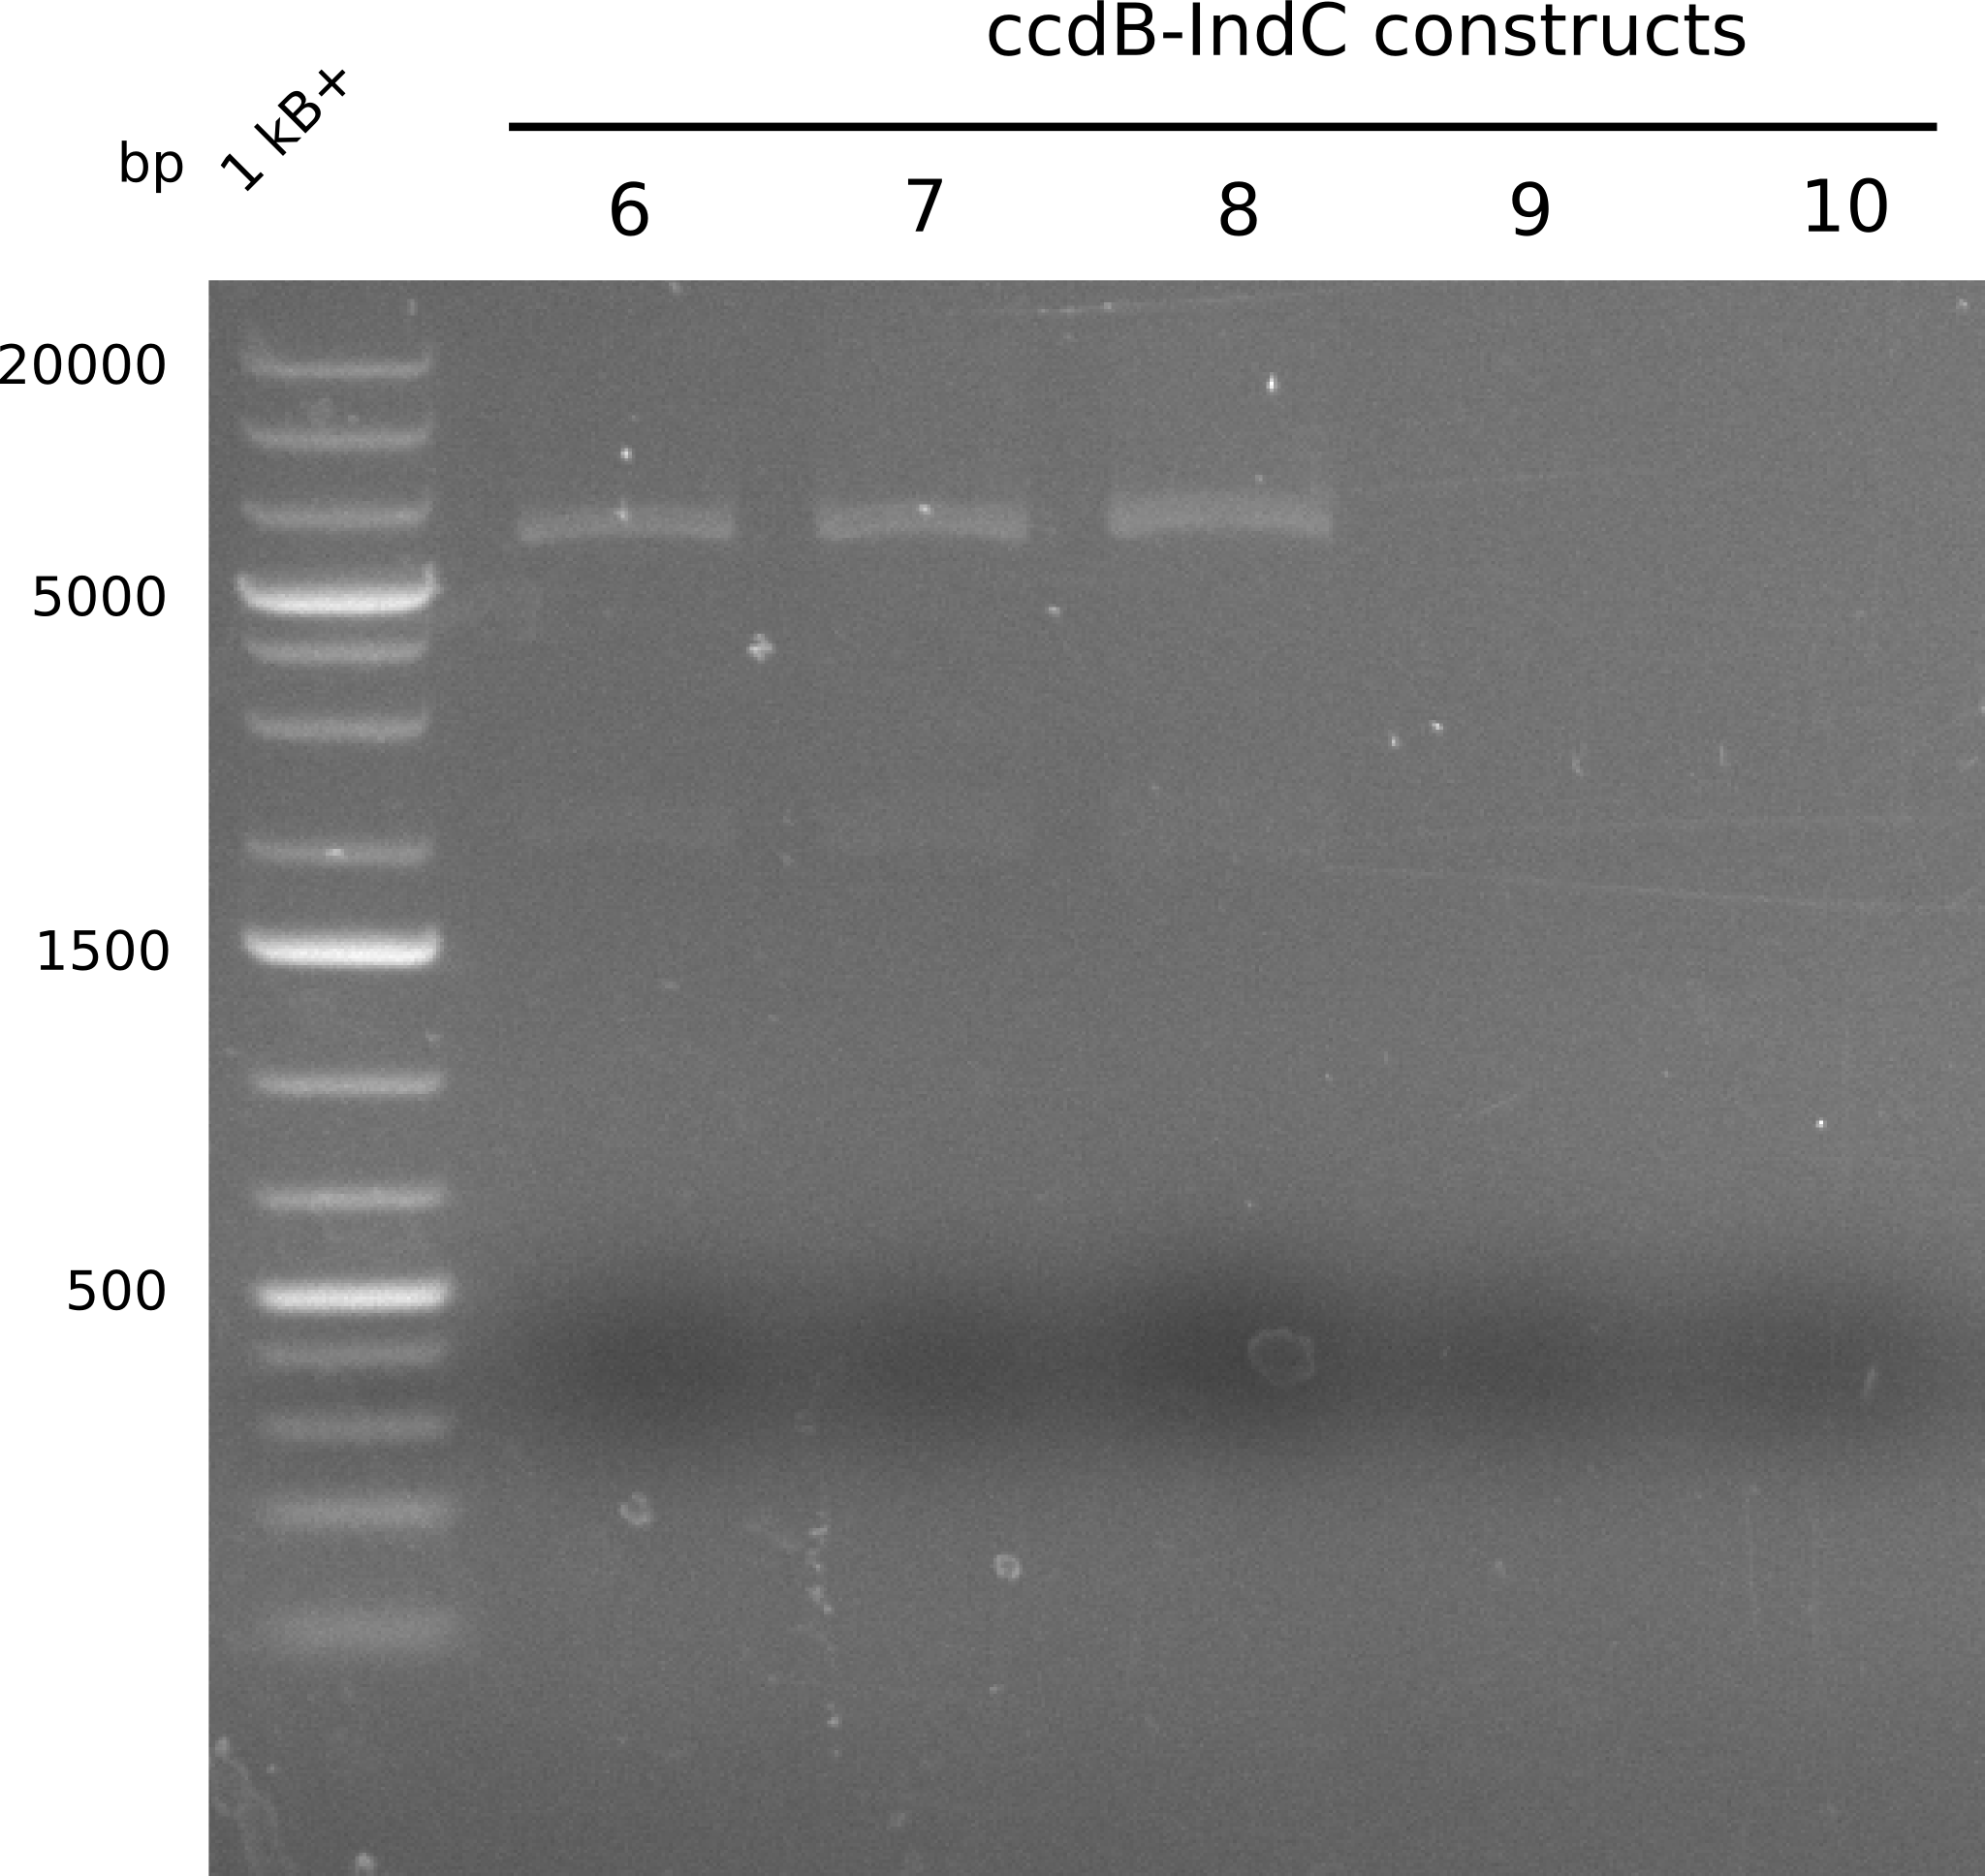
After amplification, an analytical gel electrophoresis was run to quantify DNA concentrations.

Check on PCR-products by gel eletrophoresis. All products showed an appropriate size.
- C(TycC2) PCR contents
| What | Size [bp] | Estimated concentration
|
| pSB1C3 | 2500 | 35
|
| ccdB | 600 | 30
|
| C(TycC2) | 1000 | 30
|
| indC | 4000 | 100
|
Assembly
Gibson assembly was followed by purification with isopropanol and transformation by heat shock into ccdB resistent and non-resistent (Top10) cells.
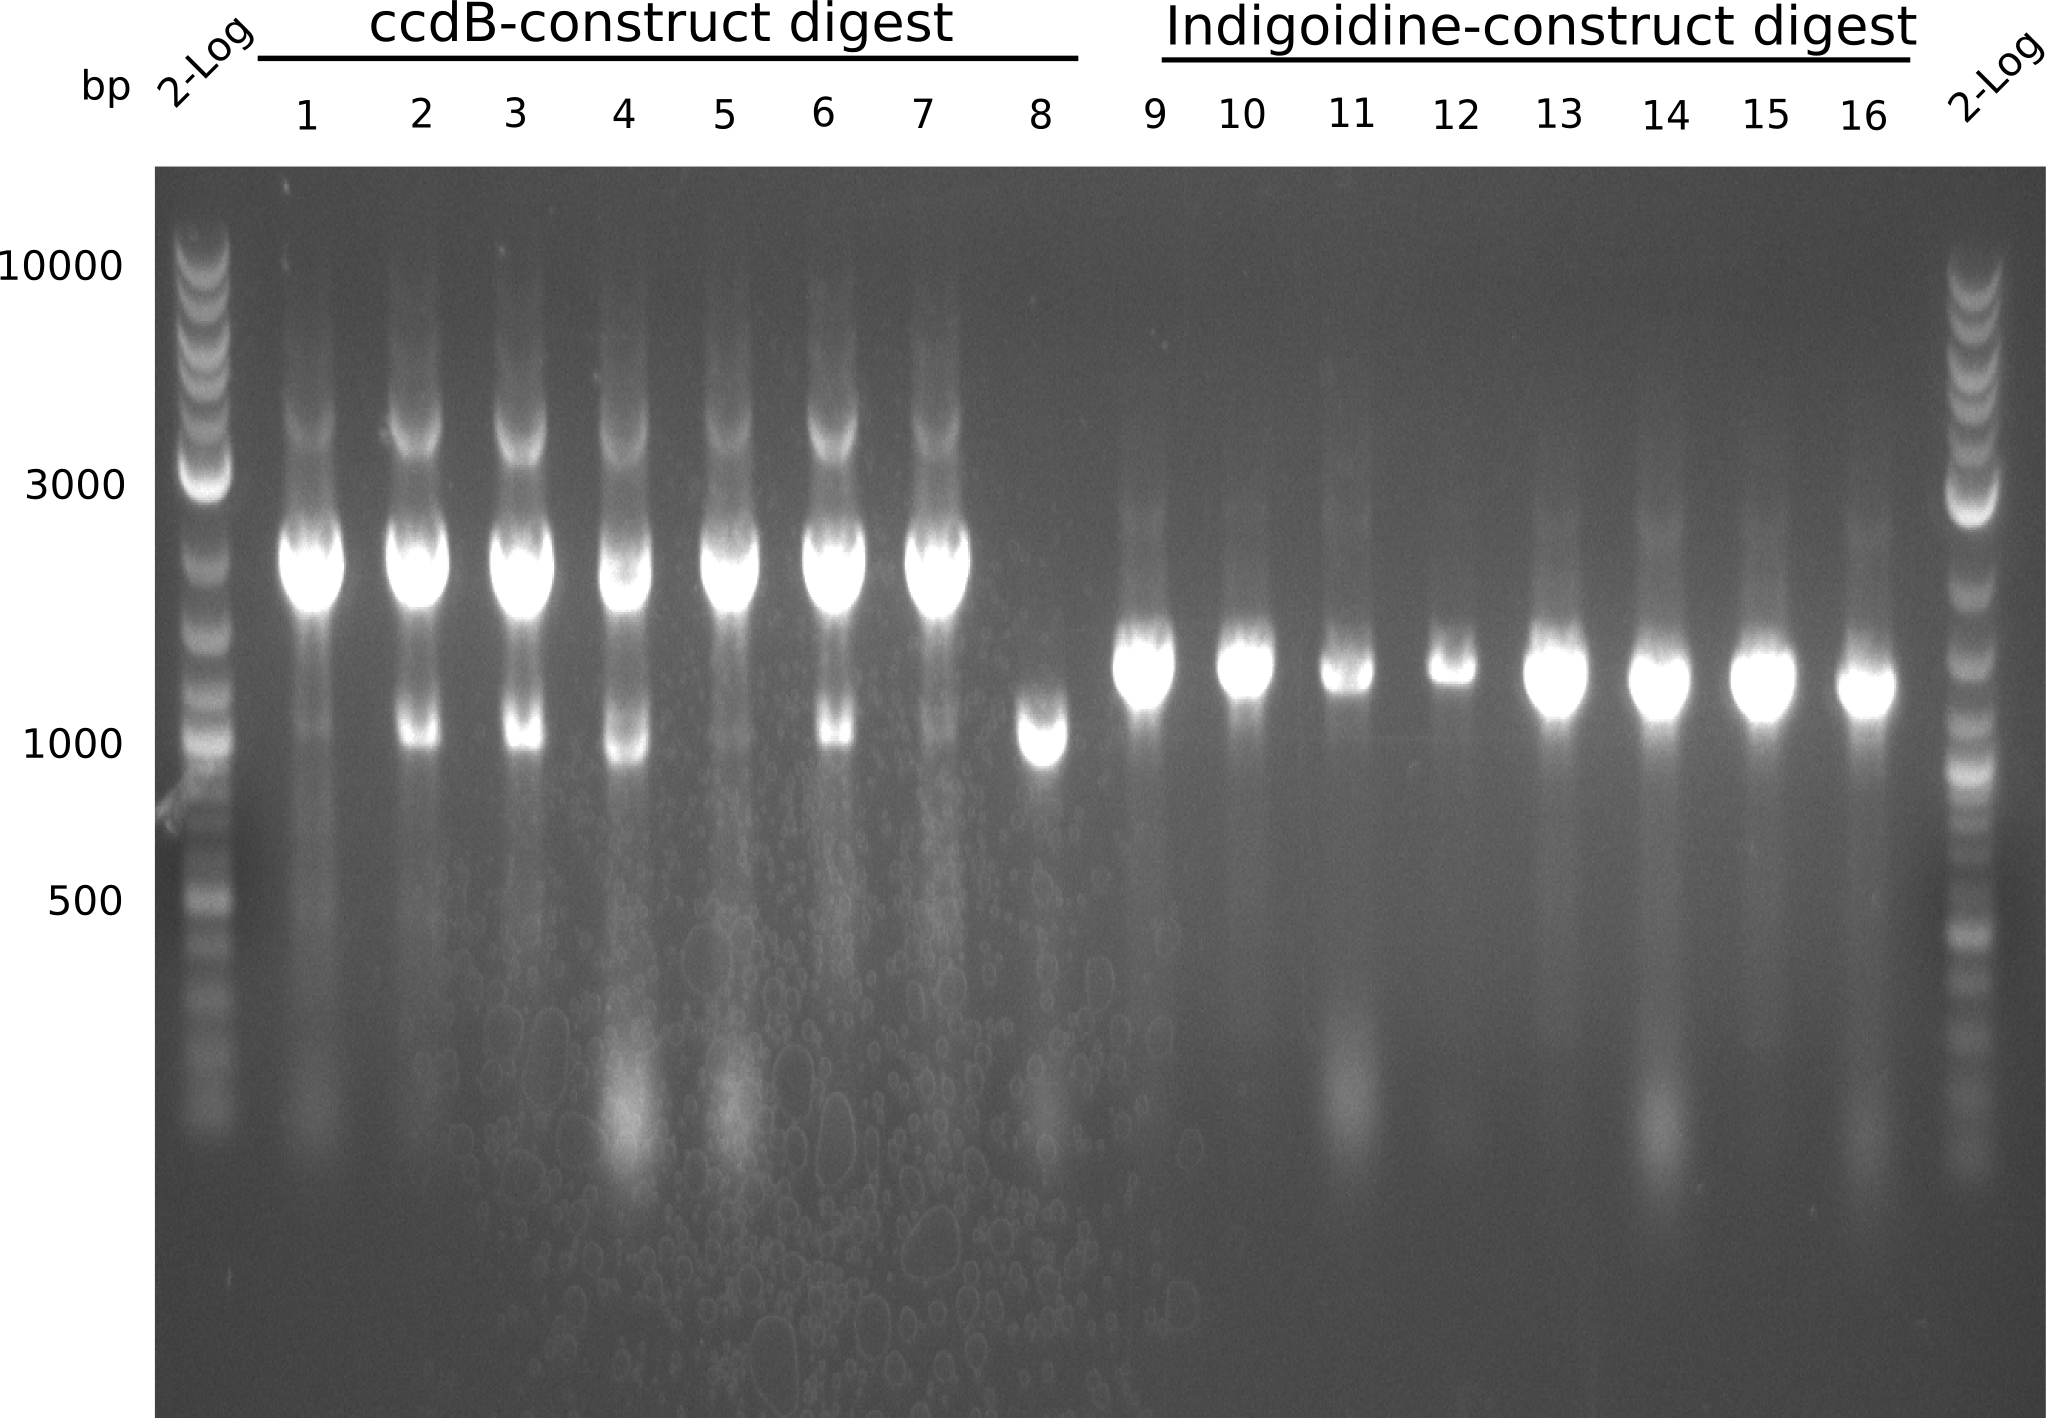
After 10 hours of culture growth, colony PCRs and test digests with Pst1 and EcoRI were conducted. Afterwards, minipreps of cultures containing the plasmids and concentration measurements were performed accompanied by test digests. Finally, positive constructs were transformed again and prepared for sequencing.


- ccdB nanodrop measurements
| Colony | Concentration [ng/µl]
|
| ccdB1 | 863.5
|
| ccdB2 | 436.9
|
| ccdB3 | 1258.5
|
| ccdB4 | 260.5
|
| ccdB5 | 106.6
|
| ccdB6 | 1064.4
|
| ccdB7 | 1213.0
|
| ccdB8 | 1301.4
|
| 3B | 982.3
|
| 3*B | 982.4
|
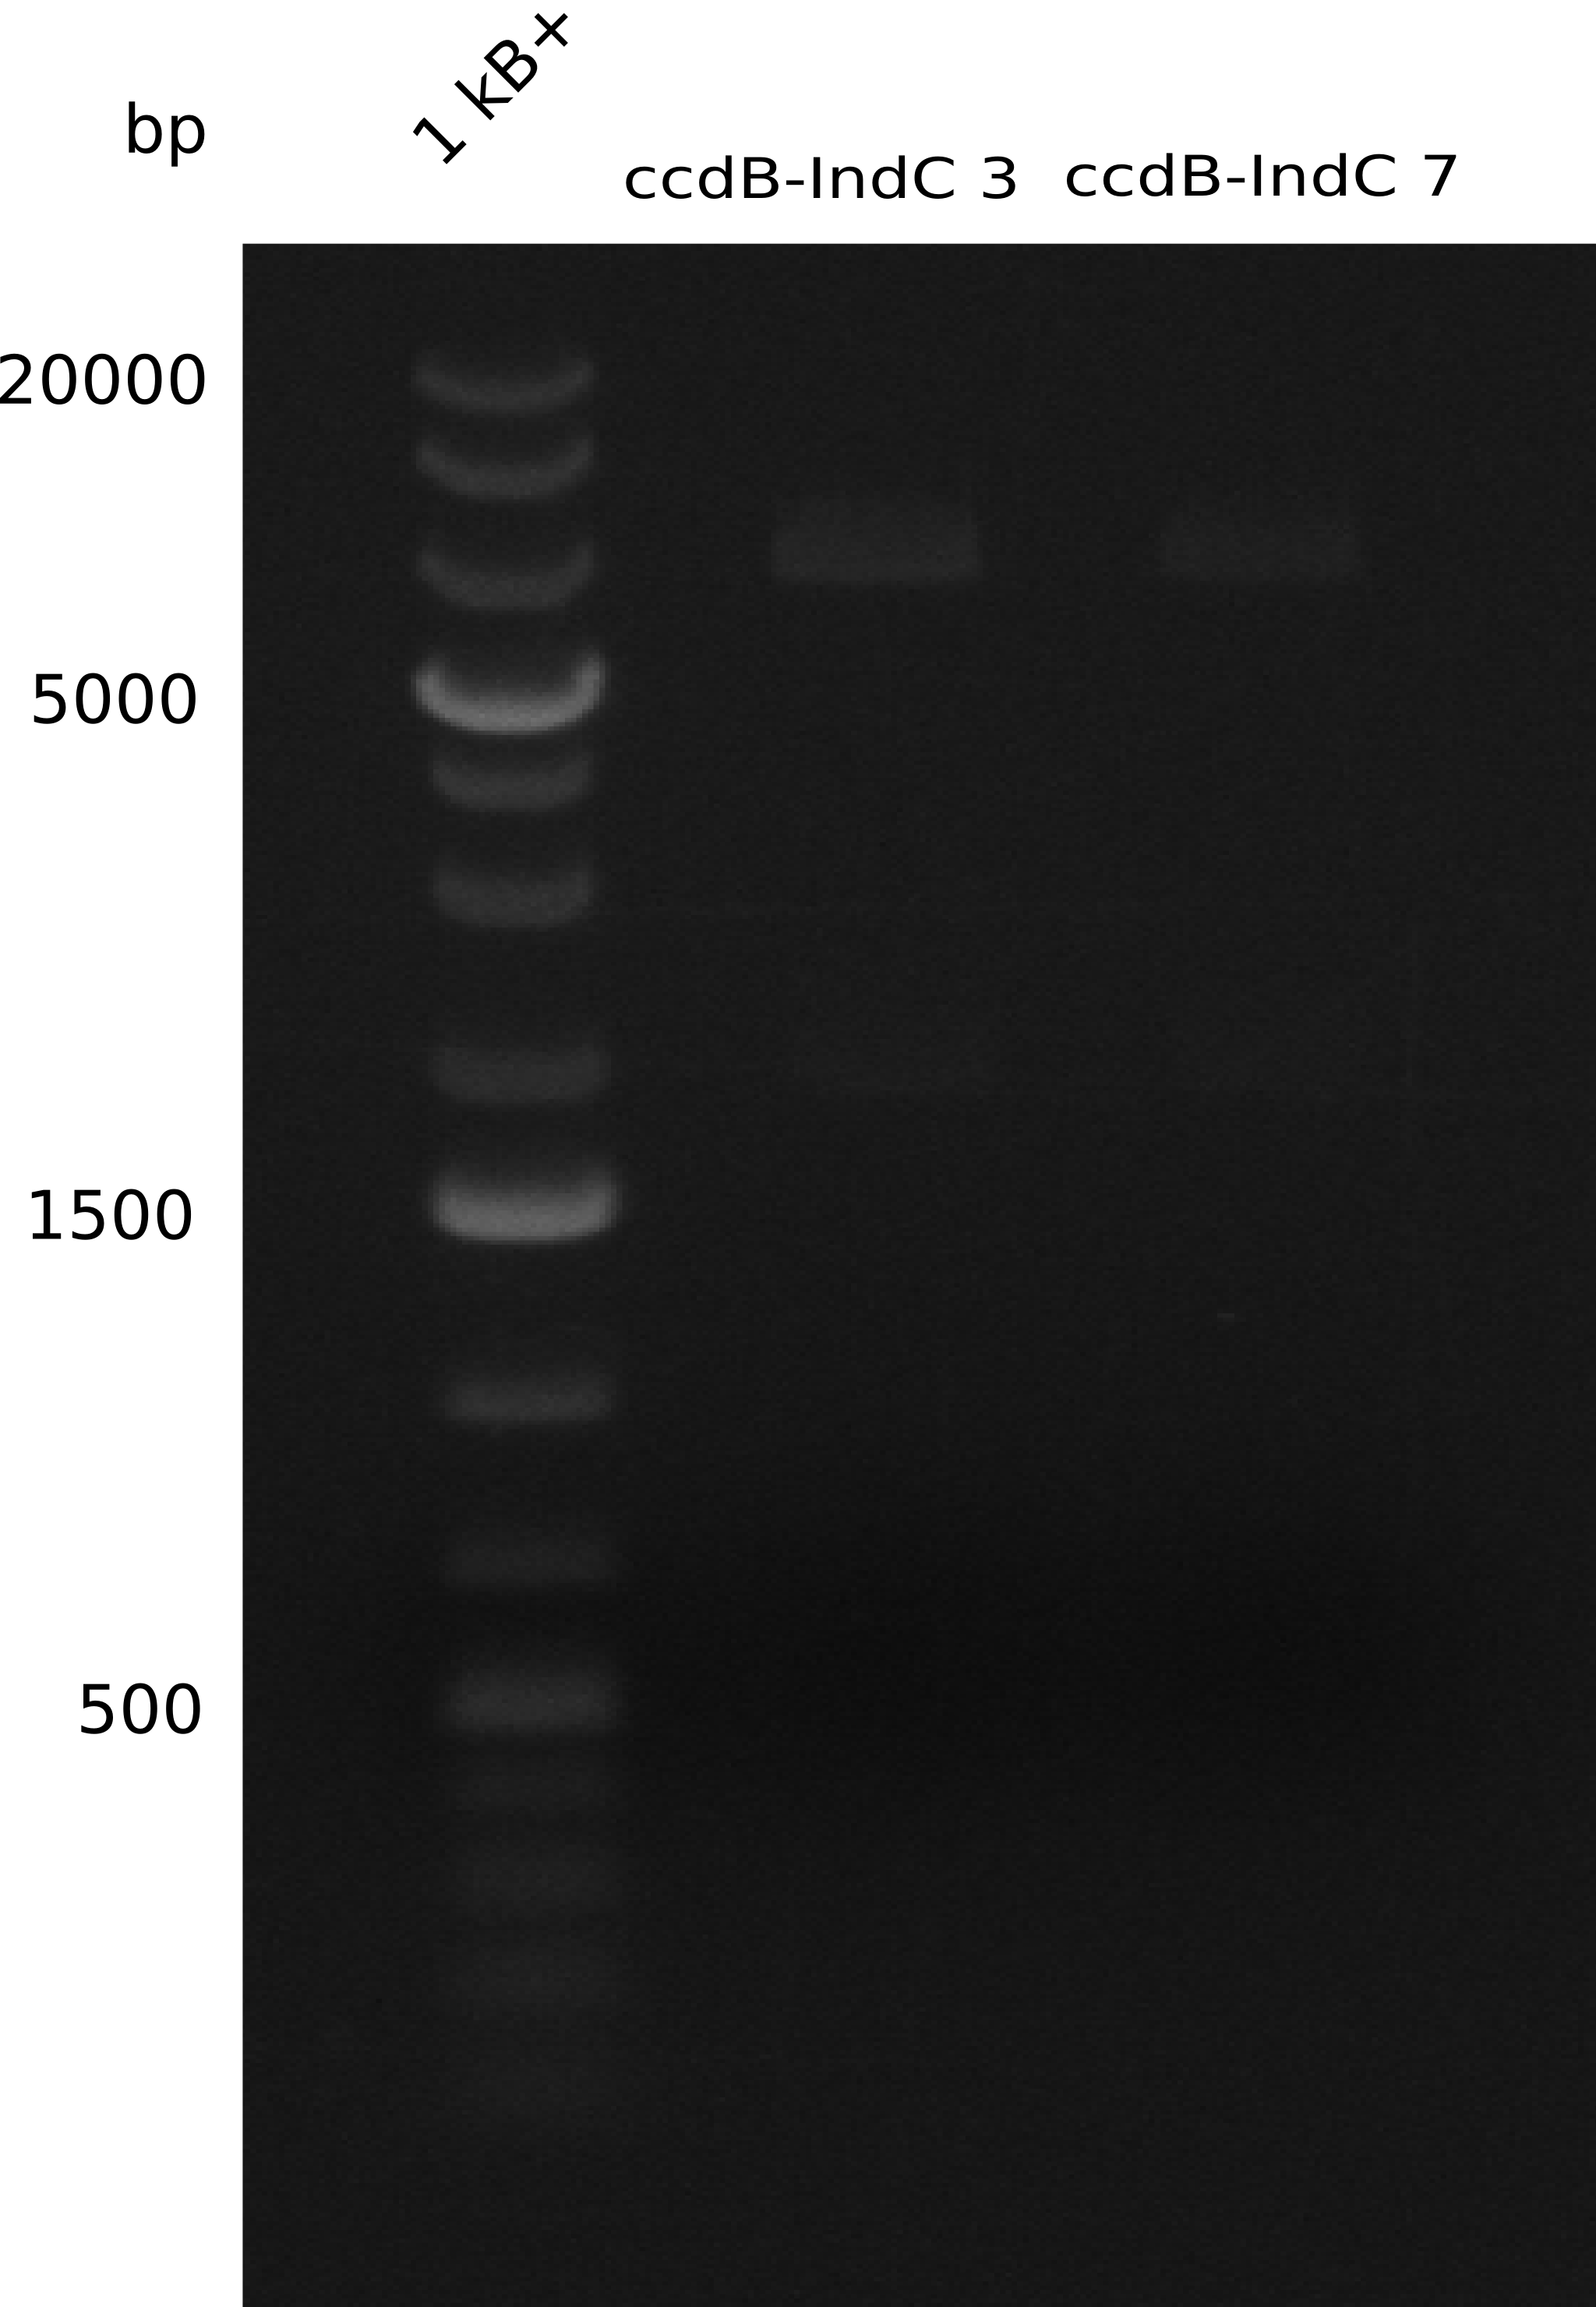
Sequencing results of ccdB3 and ccdB7 (just partwise sequencing) were positive. Biobrick can be submitted.
 "
"


