"
"
Team:Alberta/Overview
From 2013.igem.org
| (13 intermediate revisions not shown) | |||
| Line 55: | Line 55: | ||
} | } | ||
.sidebar { | .sidebar { | ||
| - | position:fixed; | + | position: fixed; |
| - | top: | + | top: 157px; |
| - | float:left; | + | float: left; |
| - | z-index:3; | + | z-index: 3; |
| - | padding: | + | padding: 10px 10px 10px 10px; |
| + | width: 230px; | ||
| + | } | ||
| + | .sidebar_block { | ||
| + | background-color:white; | ||
| + | margin:1px; | ||
| + | border:1px grey solid; | ||
| + | padding:5px 10px 5px 10px; | ||
| + | border-radius:5px; | ||
| + | box-shadow: 0px 0px 20px #444444; | ||
} | } | ||
.main { | .main { | ||
| Line 399: | Line 408: | ||
-o-box-shadow: 2px 2px 6px rgba(0, 0, 0, 0.28); | -o-box-shadow: 2px 2px 6px rgba(0, 0, 0, 0.28); | ||
box-shadow: 2px 2px 6px rgba(0, 0, 0, 0.28); | box-shadow: 2px 2px 6px rgba(0, 0, 0, 0.28); | ||
| + | } | ||
| + | a.anchor{ | ||
| + | display: block; | ||
| + | position: relative; | ||
| + | top: -180px; | ||
| + | visibility: hidden; | ||
} | } | ||
</style> | </style> | ||
| Line 405: | Line 420: | ||
<div class="titlebar"> | <div class="titlebar"> | ||
<br> | <br> | ||
| - | + | <img src="/wiki/images/4/41/Ab_mapmen_title.png" width="600" height="95"></img><img src="/wiki/images/a/a5/2013-igem-logo.png" width="198" height="95"></img> | |
| - | + | ||
| - | + | ||
| - | + | ||
| - | + | ||
</div> | </div> | ||
<div class="bin"> | <div class="bin"> | ||
| Line 422: | Line 433: | ||
<li><a href="/Team:Alberta/Parts">Submitted Parts</a></li> | <li><a href="/Team:Alberta/Parts">Submitted Parts</a></li> | ||
<li><a href="/Team:Alberta/Accomplishments">Accomplishments</a></li> | <li><a href="/Team:Alberta/Accomplishments">Accomplishments</a></li> | ||
| - | |||
</ul> | </ul> | ||
</li> | </li> | ||
| Line 430: | Line 440: | ||
<li><a href="https://igem.org/Team.cgi?year=2013&team_name=Alberta">Official Profile</a></li> | <li><a href="https://igem.org/Team.cgi?year=2013&team_name=Alberta">Official Profile</a></li> | ||
<li><a href="/Team:Alberta/Sponsors">Sponsors</a></li> | <li><a href="/Team:Alberta/Sponsors">Sponsors</a></li> | ||
| + | <li><a href="/Team:Alberta/Attributions">Attributions</a></li> | ||
</ul> | </ul> | ||
</li> | </li> | ||
| Line 448: | Line 459: | ||
</ul> | </ul> | ||
<div class="sidebar"> | <div class="sidebar"> | ||
| - | <div | + | <div class="sidebar_block"> |
| - | < | + | <h5>Places</h5> |
| - | + | <a href="#Top"><p>Top</p></a> | |
| - | < | + | <a href="#Travelling"><p>Travelling Salesman Problem</p></a> |
| - | + | <a href="#Biological-Terms"><p>In Biological Terms</p></a> | |
| - | </ | + | <a href="#Finding-the-Path"><p>Finding the Path</p></a> |
| - | </ | + | <a href="#Mapmakers"><p>MapMakers at Work</p></a> |
| - | + | <a href="#Weight"><p>Calculating Gene Concentration</p></a> | |
| + | <h5>Project Sections</h5> | ||
| + | <a href="/Team:Alberta/Background"><p>Background</p></a> | ||
| + | <a href="/Team:Alberta/Overview" class="active"><p>Overview</p></a> | ||
| + | <a href="/Team:Alberta/Results"><p>Results</p></a> | ||
| + | <a href="/Team:Alberta/Protocols"><p>Protocols</p></a> | ||
| + | <a href="/Team:Alberta/Parts"><p>Submitted Parts</p></a> | ||
| + | <a href="/Team:Alberta/Accomplishments"><p>Accomplishments</p></a> | ||
</div> | </div> | ||
</div> | </div> | ||
<div class="main"> | <div class="main"> | ||
| + | <a class="anchor" id="Top"></a> | ||
<div class="block"> | <div class="block"> | ||
<p class="content-title">Overview</p> | <p class="content-title">Overview</p> | ||
</div> | </div> | ||
| + | <a class="anchor" id="Travelling"></a> | ||
<div class="block"> | <div class="block"> | ||
<h2>The Travelling Salesman Problem</h2> | <h2>The Travelling Salesman Problem</h2> | ||
| - | <p> | + | <p>MapMen is Team Alberta's endeavour to create a biological computer capable of solving |
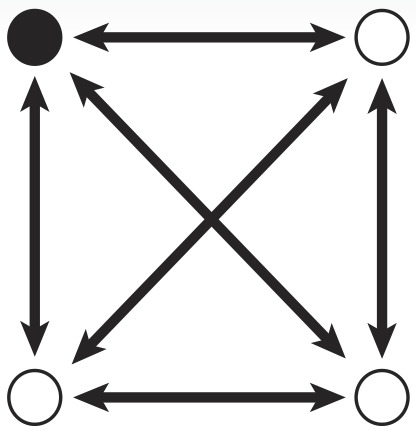
Travelling Salesman Problems (TSP), a general form of problem that asks:</p> | Travelling Salesman Problems (TSP), a general form of problem that asks:</p> | ||
<p class="centered-well">Given a set of cities, and a list of the distances between each pair of those cities, | <p class="centered-well">Given a set of cities, and a list of the distances between each pair of those cities, | ||
what is the shortest possible route that travels to every city exactly once and then returns to the origin | what is the shortest possible route that travels to every city exactly once and then returns to the origin | ||
city?</p> | city?</p> | ||
| - | <img src="/wiki/images/6/6c/TSPexample.png" style="width: | + | <p><center><img src="/wiki/images/6/6c/TSPexample.png" align="middle" style="width:33%;"></center></p> |
</div> | </div> | ||
| + | <a class="anchor" id="Biological-Terms"></a> | ||
<div class="block"> | <div class="block"> | ||
<h2>In Biological Terms</h2> | <h2>In Biological Terms</h2> | ||
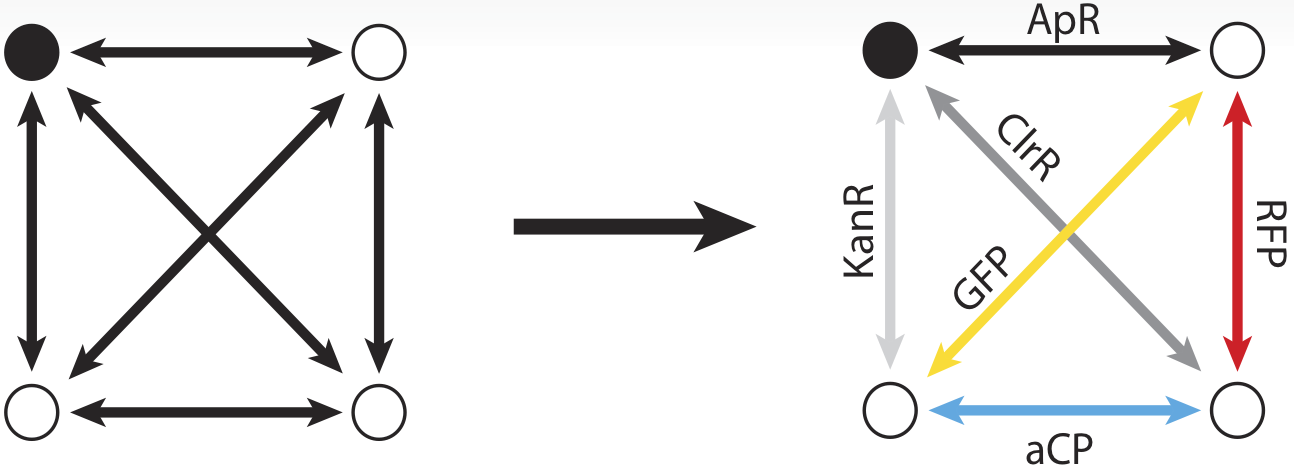
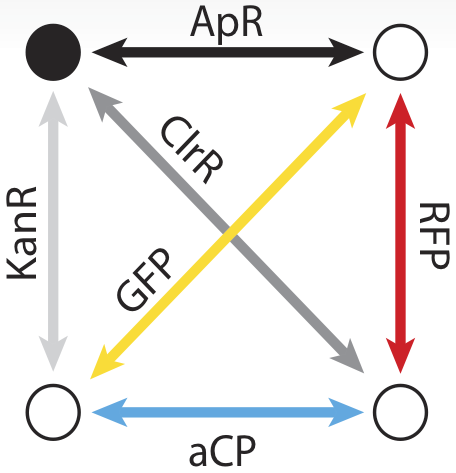
| - | <p>To | + | <p>To take advantage of the considerable information processing power of biology, we must create biochemical analogues for all of the components of the original problem. We begin by assigning a symbolic reporter gene or selectable marker gene to each of the six paths in our example map. The assignment is arbitrary; which gene is used for which path does not matter as long as it creates some kind of observable phenotype. For example, the path connecting the northeast city and the northwest city is symbolized by a gene coding for ampicillin resistance. The path from the northeast to city to the southeast meanwhile, is symbolized by a gene coding for kanamycin resistance.</p> |
| - | + | <img src="/wiki/images/4/4c/Bio_terms.png" style="width:100%;"></img> | |
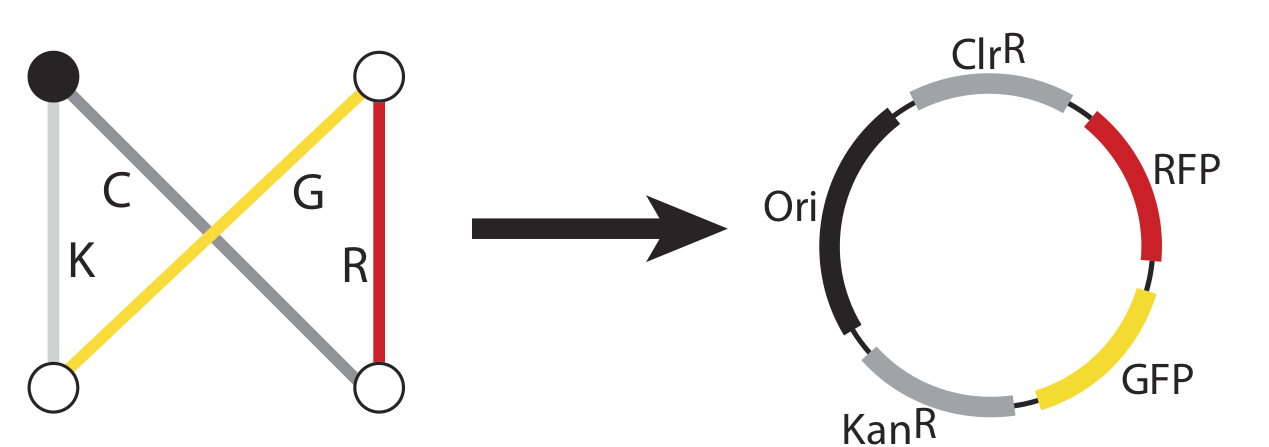
| - | + | <p>Now, just as the travelling salesman might describe taking a particular route to his customers – leaving from the northeast origin city and taking the road to the southwest, then turning up the north road from there, then back down the southeast, before returning northward home from, we can also represent that series of paths as a sequence of genes: ChlorR, RFP, GFP, and KanR.</p> | |
| - | + | <img src="/wiki/images/b/bd/Path_to_gene.png" style="width:100%;"></img> | |
| - | + | ||
| - | + | ||
| - | + | ||
| - | + | ||
| - | + | ||
</div> | </div> | ||
| + | <a class="anchor" id="Finding-the-Path"></a> | ||
<div class="block"> | <div class="block"> | ||
<h2>Finding the Path</h2> | <h2>Finding the Path</h2> | ||
| - | <p> | + | <p>Just as a computer using a brute force approach to the travelling salesman problem would test every route and tally the sum distance of the paths travelled, our biocomputer assembles a multitude of plasmids, representing every possible combination of paths, through a set of ligations that represent the legs of the salesman’s journey. In the first leg, we depart from the origin city along any of the available roads: AmpR, ChlorR, or KanR. In the plasmid production, we begin with a combinatorial ligation – one where all three of the genes are being ligated with origins of replication, but only one of the three is able to ligate onto each Ori, resulting in a collection of incomplete plasmids that each includes just one of the three genes. </p> |
| - | + | <center><img src="/wiki/images/9/95/AB_Genemap.png" style="width:35%;"></img></center> | |
| - | + | <p>Following the first gene ligation, a short linker piece is added, signifying the city that has been reached – all of the linkers are identical, there is no differentiation of routes based on this component. In the second leg of the journey, we perform a ligation with three more genes, representing all of the possible paths the salesman might take next – three colour genes. Again, each growing plasmid can only incorporate one of the new genes, so we obtain a random assortment of incomplete plasmids that each include one antibiotic resistance from the first ligation and one colour gene from the third ligation. </p> | |
| - | + | <img src="/wiki/images/7/7e/AB_Assemblyfull.png" style="width:100%;"></img> | |
| - | + | <p>The third leg of the journey is identical to the second, incorporating an additional colour gene, and the final leg uses the three antibiotic genes once again. At the end of this process, we will have obtained a randomized distribution of 76 different kinds of plasmids representing all of the different possible permutations of the genes, capable of producing 18 unique phenotypes, and representing the six bi-directional solutions to the four-city travelling salesman problem.<p/> | |
| - | + | ||
| - | + | ||
| - | + | ||
</div> | </div> | ||
| + | <a class="anchor" id="Mapmakers"></a> | ||
<div class="block"> | <div class="block"> | ||
<h2>MapMakers at Work</h2> | <h2>MapMakers at Work</h2> | ||
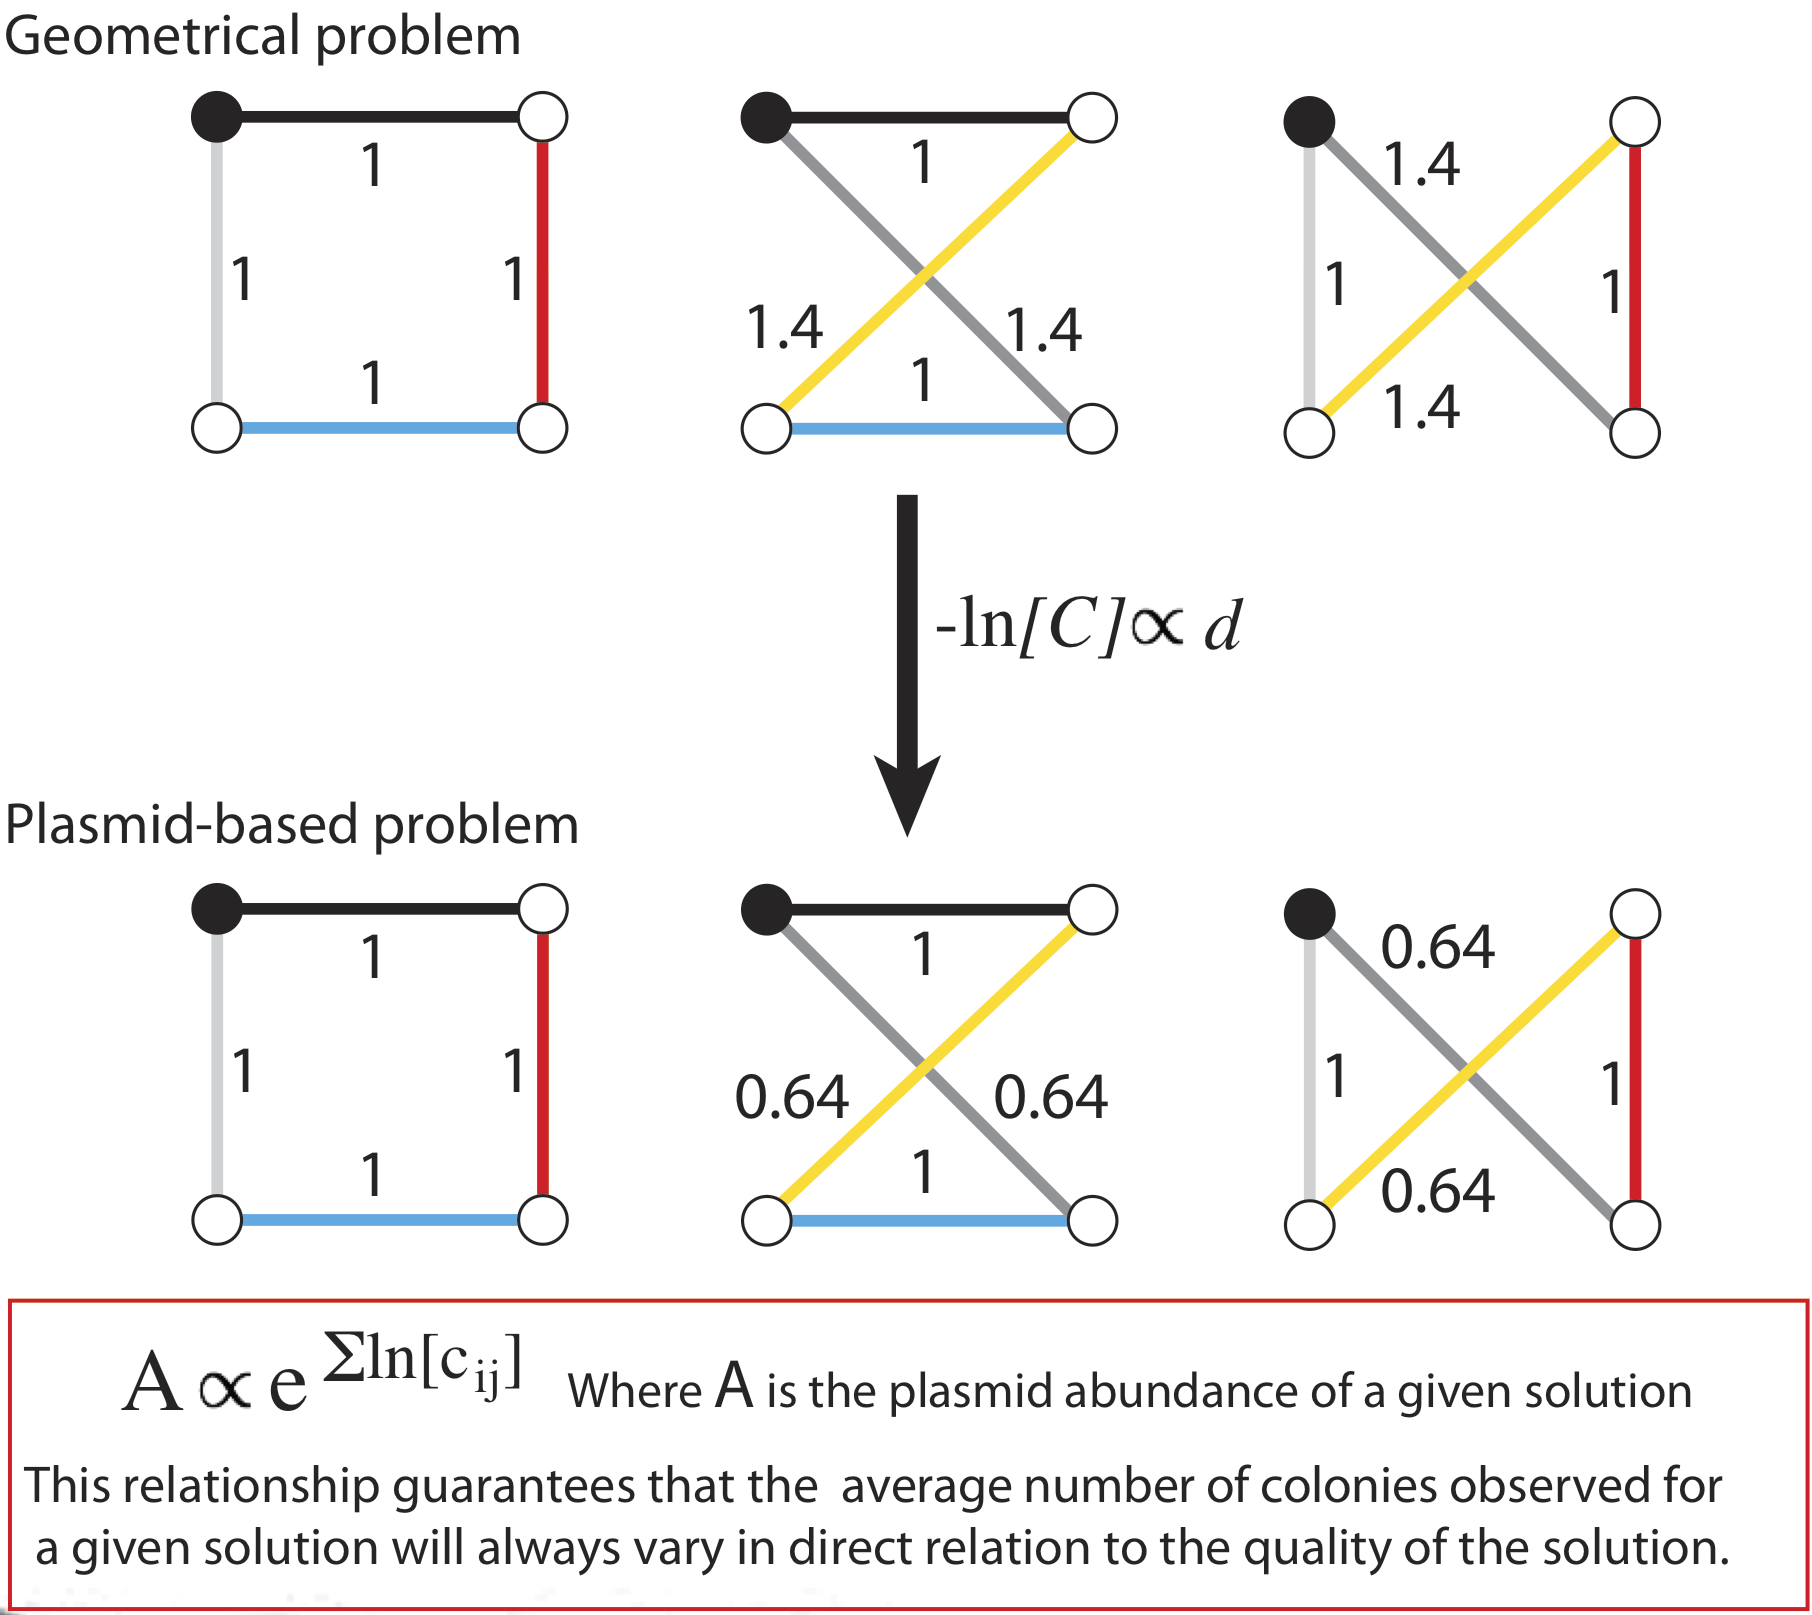
| - | <p> | + | <p>Once the plasmids have been produced, how can we use them to identify the correct solution? The answer is in the frequency with which each plasmid occurs: We create bias in the ligations during assembly so that genes that represent shorter paths are more likely to be incorporated into the plasmids, meaning in turn that the final product plasmids are more likely to be composed of several short-path genes. As a result, although we still expect to see plasmids representing every possible route, those plasmids that represent the shortest routes through the map will be much more common than plasmids representing lengthy routes. By identifying the most abundant plasmid, we identify the shortest route and thus the optimal solution. </p> |
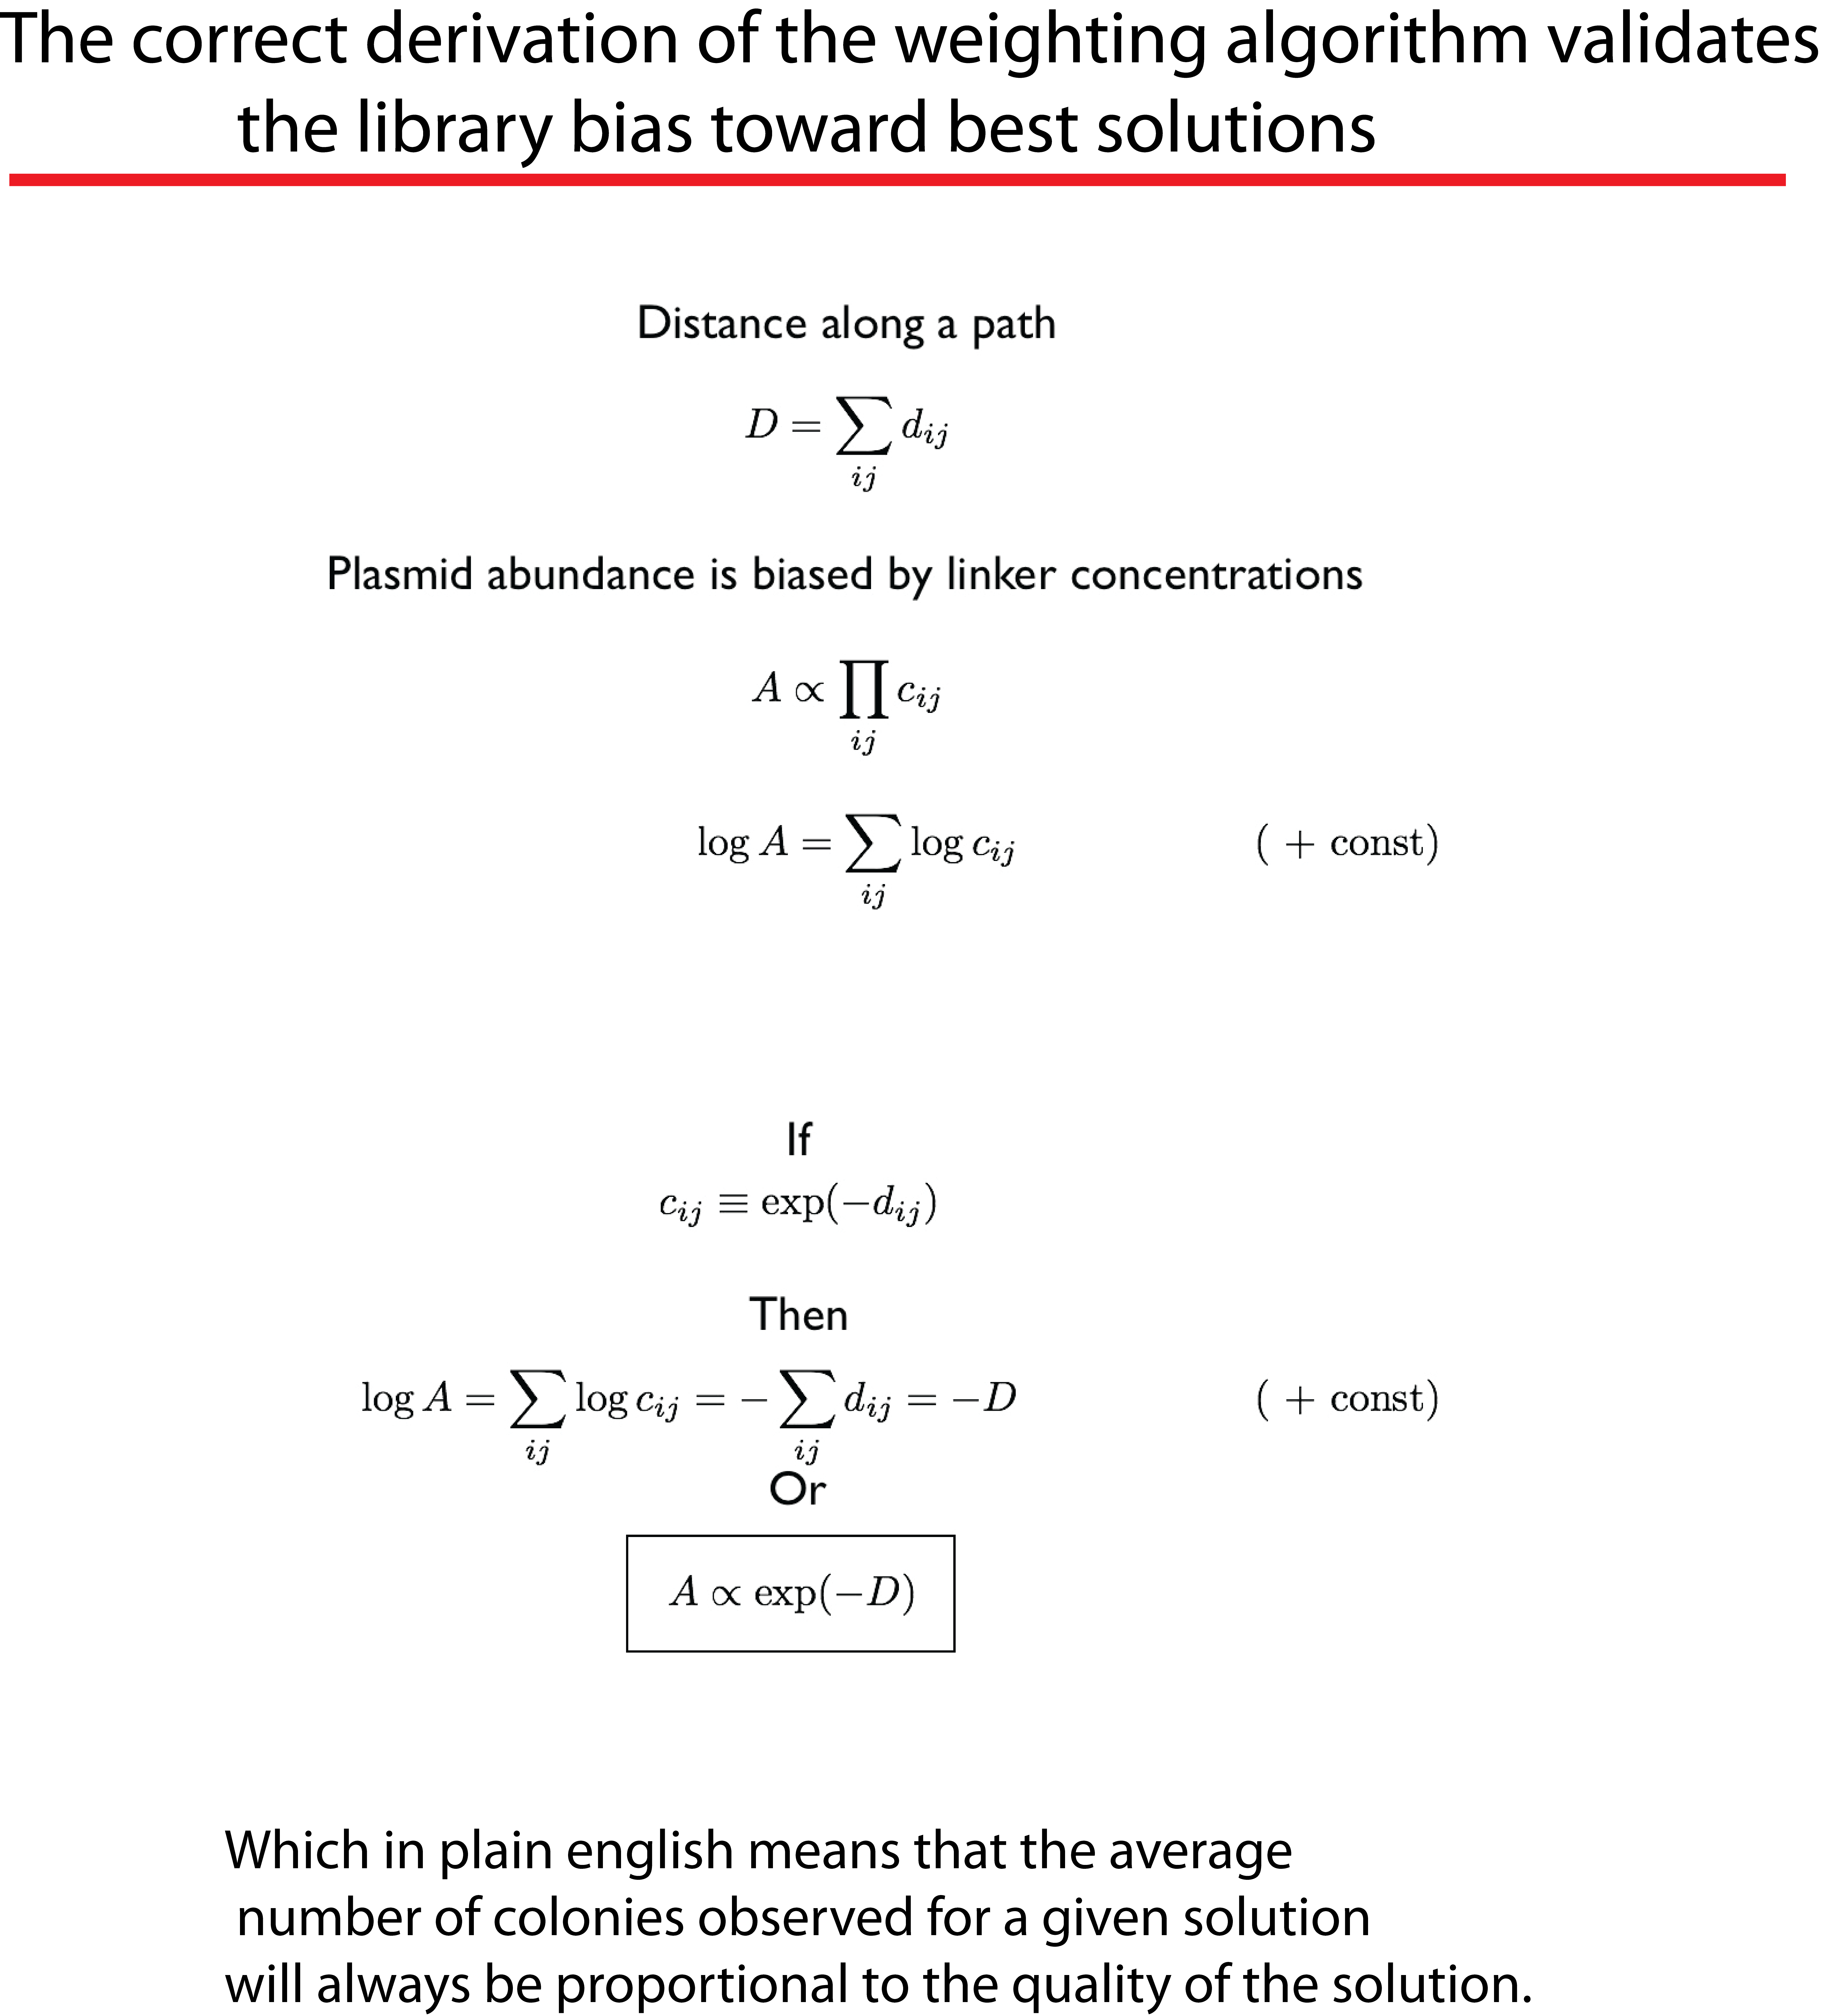
| - | + | <p>The bias is introduced through the concentration of the reactants in each ligation. If a gene is meant to represent a short path, its concentration in the ligation will be higher than the others, and conversely, genes that are meant to represent lengthy paths will be included in lower concentrations than the others. As a result, at any given ligation step, the gene symbolizing the shortest available path is more likely to be incorporated. Among the product plasmids, genes are incorporated at a rate inversely proportional to their length. The concentration used for each gene in the ligation is described by the expression: –ln[Gene]∝(path distance)</p> | |
| - | + | <img src="/wiki/images/9/95/Proportions.png" style="width:100%;"></img> | |
| - | + | <p>To identify which of the plasmids is most frequent, the products are transformed into a bacterial culture. Because each of the genes produces an easily interpreted phenotype, this allows us to infer the most frequently transformed plasmid from the frequency of the colonies produced on agar plates. The plasmid carried by any given colony on the plates below can be readily identified by the combination of the colony colour (purple colonies have RFP and aCP, orange colonies have RFP and GFP, and green colonies have GFP and aCP), and the antibiotic resistances it exhibits, which are inferred from the plate on which it is growing. As an example, a purple colony growing on the kan/amp plate must have the Amp-Red-Blue-Kan-plasmid shown in the first column below.<p/> | |
| - | + | <img src="/wiki/images/6/6d/Ab_Solution_identification.png" style="width:100%;"></img> | |
| - | + | <p>Many of the colonies do not correspond to any valid route. For instance, an orange colony on the kan/amp plate has the plasmid Amp-Red-Green-Kan, which does not describe a valid circuit visiting each city exactly once – but because we can tell that this is an invalid solution, we would not count this colony when assessing the frequency of the valid plasmids. Any four-city travelling salesman problem has just three unique solutions, and so there are only three phenotypes that must be counted: purple kan/amp, orange kan/chlor, and green amp/chlor. The colonies of these three phenotypes are counted and compared, and the most frequently occurring plasmid is the optimal solution! </p> | |
| - | <p> | + | |
| - | + | ||
| - | + | ||
| - | + | ||
| - | + | ||
| - | + | ||
| - | + | ||
| - | + | ||
</div> | </div> | ||
| + | <a class="anchor" id="Weight"></a> | ||
<div class="block"> | <div class="block"> | ||
| - | + | <h2>Calculating Gene Concentration</h2> | |
| - | + | <img src="/wiki/images/5/57/2013Alberta_New_algorithm.png" style="width:100%;"></img> | |
| - | + | ||
| - | + | ||
| - | + | ||
| - | + | ||
| - | + | ||
| - | + | ||
| - | + | ||
| - | + | ||
| - | + | ||
| - | + | ||
| - | + | ||
| - | + | ||
| - | + | ||
| - | + | ||
| - | + | ||
| - | + | ||
| - | + | ||
| - | + | ||
| - | + | ||
| - | + | ||
| - | + | ||
| - | + | ||
| - | + | ||
| - | + | ||
| - | + | ||
| - | + | ||
| - | + | ||
| - | + | ||
| - | + | ||
| - | + | ||
| - | + | ||
| - | + | ||
| - | + | ||
| - | + | ||
| - | + | ||
| - | + | ||
| - | + | ||
</div> | </div> | ||
</div> | </div> | ||
Latest revision as of 03:43, 29 October 2013

Overview
The Travelling Salesman Problem
MapMen is Team Alberta's endeavour to create a biological computer capable of solving Travelling Salesman Problems (TSP), a general form of problem that asks:
Given a set of cities, and a list of the distances between each pair of those cities, what is the shortest possible route that travels to every city exactly once and then returns to the origin city?
In Biological Terms
To take advantage of the considerable information processing power of biology, we must create biochemical analogues for all of the components of the original problem. We begin by assigning a symbolic reporter gene or selectable marker gene to each of the six paths in our example map. The assignment is arbitrary; which gene is used for which path does not matter as long as it creates some kind of observable phenotype. For example, the path connecting the northeast city and the northwest city is symbolized by a gene coding for ampicillin resistance. The path from the northeast to city to the southeast meanwhile, is symbolized by a gene coding for kanamycin resistance.
Now, just as the travelling salesman might describe taking a particular route to his customers – leaving from the northeast origin city and taking the road to the southwest, then turning up the north road from there, then back down the southeast, before returning northward home from, we can also represent that series of paths as a sequence of genes: ChlorR, RFP, GFP, and KanR.
Finding the Path
Just as a computer using a brute force approach to the travelling salesman problem would test every route and tally the sum distance of the paths travelled, our biocomputer assembles a multitude of plasmids, representing every possible combination of paths, through a set of ligations that represent the legs of the salesman’s journey. In the first leg, we depart from the origin city along any of the available roads: AmpR, ChlorR, or KanR. In the plasmid production, we begin with a combinatorial ligation – one where all three of the genes are being ligated with origins of replication, but only one of the three is able to ligate onto each Ori, resulting in a collection of incomplete plasmids that each includes just one of the three genes.
Following the first gene ligation, a short linker piece is added, signifying the city that has been reached – all of the linkers are identical, there is no differentiation of routes based on this component. In the second leg of the journey, we perform a ligation with three more genes, representing all of the possible paths the salesman might take next – three colour genes. Again, each growing plasmid can only incorporate one of the new genes, so we obtain a random assortment of incomplete plasmids that each include one antibiotic resistance from the first ligation and one colour gene from the third ligation.
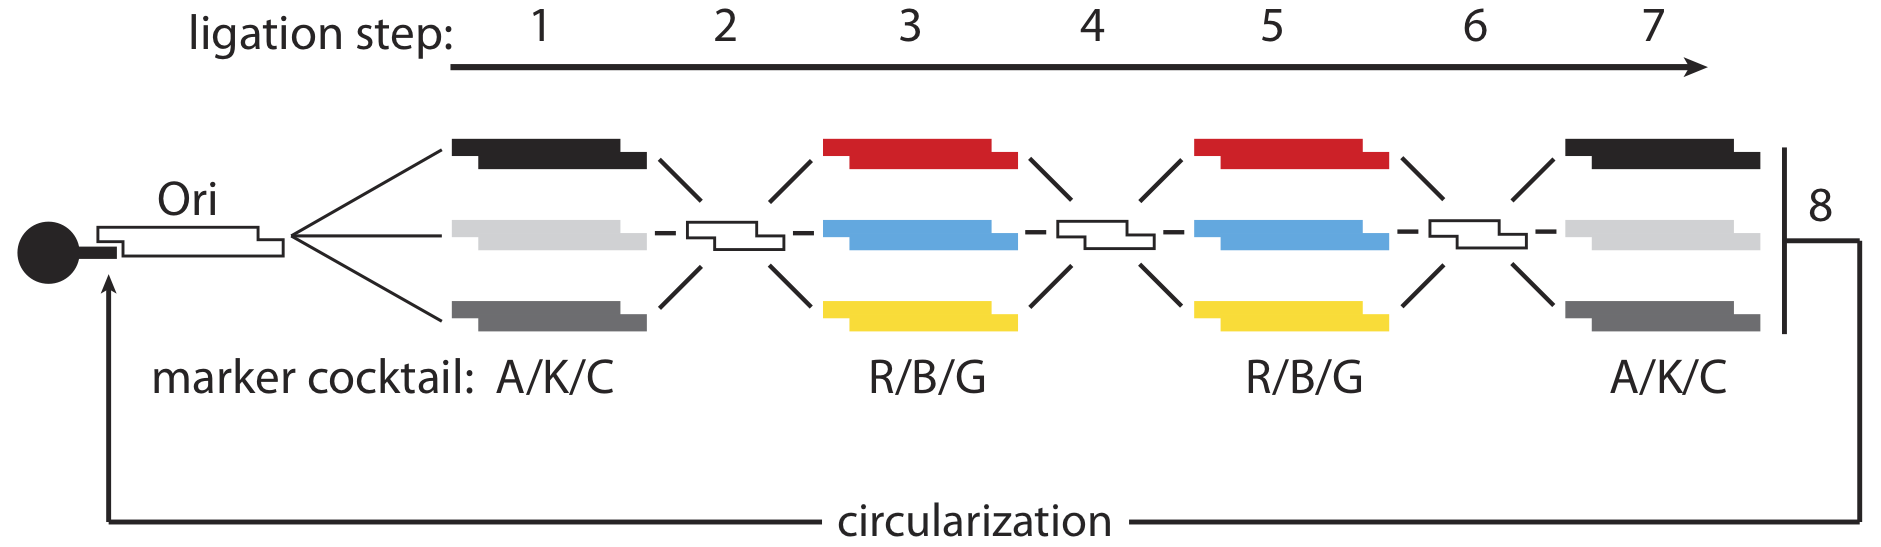
The third leg of the journey is identical to the second, incorporating an additional colour gene, and the final leg uses the three antibiotic genes once again. At the end of this process, we will have obtained a randomized distribution of 76 different kinds of plasmids representing all of the different possible permutations of the genes, capable of producing 18 unique phenotypes, and representing the six bi-directional solutions to the four-city travelling salesman problem.
MapMakers at Work
Once the plasmids have been produced, how can we use them to identify the correct solution? The answer is in the frequency with which each plasmid occurs: We create bias in the ligations during assembly so that genes that represent shorter paths are more likely to be incorporated into the plasmids, meaning in turn that the final product plasmids are more likely to be composed of several short-path genes. As a result, although we still expect to see plasmids representing every possible route, those plasmids that represent the shortest routes through the map will be much more common than plasmids representing lengthy routes. By identifying the most abundant plasmid, we identify the shortest route and thus the optimal solution.
The bias is introduced through the concentration of the reactants in each ligation. If a gene is meant to represent a short path, its concentration in the ligation will be higher than the others, and conversely, genes that are meant to represent lengthy paths will be included in lower concentrations than the others. As a result, at any given ligation step, the gene symbolizing the shortest available path is more likely to be incorporated. Among the product plasmids, genes are incorporated at a rate inversely proportional to their length. The concentration used for each gene in the ligation is described by the expression: –ln[Gene]∝(path distance)
To identify which of the plasmids is most frequent, the products are transformed into a bacterial culture. Because each of the genes produces an easily interpreted phenotype, this allows us to infer the most frequently transformed plasmid from the frequency of the colonies produced on agar plates. The plasmid carried by any given colony on the plates below can be readily identified by the combination of the colony colour (purple colonies have RFP and aCP, orange colonies have RFP and GFP, and green colonies have GFP and aCP), and the antibiotic resistances it exhibits, which are inferred from the plate on which it is growing. As an example, a purple colony growing on the kan/amp plate must have the Amp-Red-Blue-Kan-plasmid shown in the first column below.
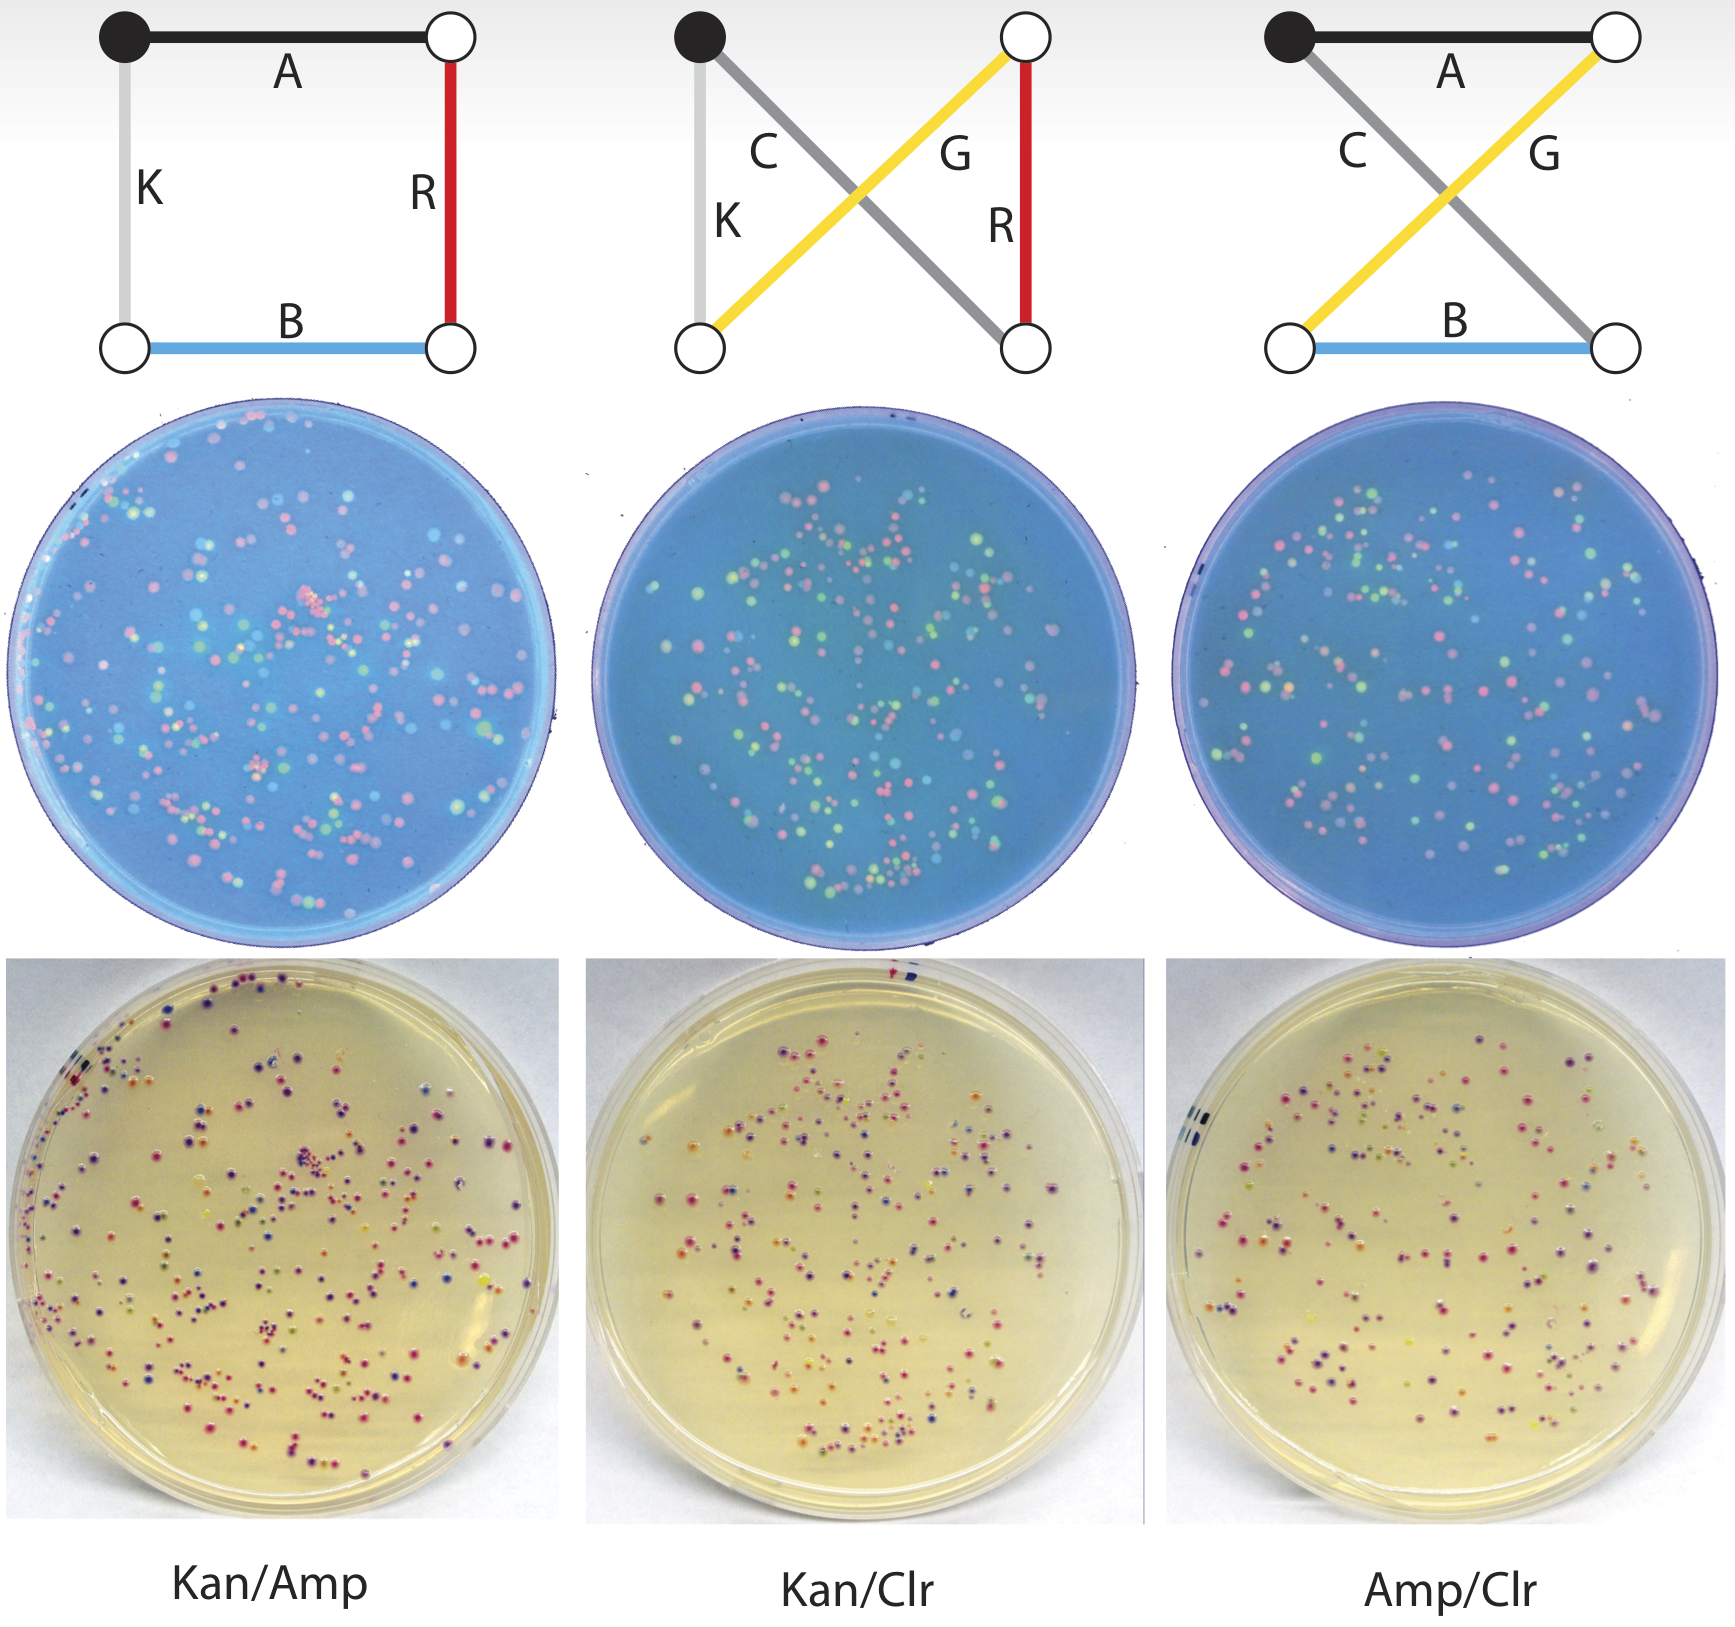
Many of the colonies do not correspond to any valid route. For instance, an orange colony on the kan/amp plate has the plasmid Amp-Red-Green-Kan, which does not describe a valid circuit visiting each city exactly once – but because we can tell that this is an invalid solution, we would not count this colony when assessing the frequency of the valid plasmids. Any four-city travelling salesman problem has just three unique solutions, and so there are only three phenotypes that must be counted: purple kan/amp, orange kan/chlor, and green amp/chlor. The colonies of these three phenotypes are counted and compared, and the most frequently occurring plasmid is the optimal solution!
Calculating Gene Concentration