 "
"
Team:Alberta/Results
From 2013.igem.org
The Littlest Mapmaker
"Exploration into the world of DNA Computing"
Team Alberta: University of Alberta

Results
The Setup
Our project’s modified parts were produced via PCR from existing stocks of BioBricks, then cloned into pSB1C3 plasmids for mass production. The parts were separated from the plasmid by restriction digestion with BsaI enzyme, and then the desired strands were purified by HPLC to ensure there could be no contamination by other DNA strands capable of interacting with our custom sticky ends.
The First Tests
We performed some initial tests to confirm the efficacy of our assembly system. In the gel below, the second lane displays the result of an origin of replication (Ori) sample that was bound to the bead, washed and then re-eluted – the presence of DNA at the desired mass in this lane confirms the successful binding and elution. The third lane demonstrates that we can successfully ligate genes (KanR in this case) directly to the Ori at high efficiency and still safely elute them. In the fourth lane, we have ligated a 13-base-pair linker onto the existing Ori-KanR, followed by a second gene, ChlorR. Although the high-mass band suggests that ligation was successful, the fact that there is still a stronger band at the Ori-KanR mass suggests that the ligation has not proceeded to completion.
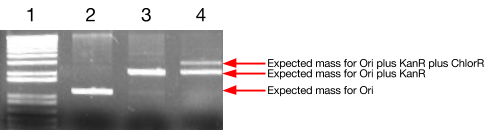
Figure 1: Agarose gel electrophoresis image from initial ligation trials.
Lane 1: DNA Markers
Lane 2: Origin of replication, bound to the magnetic beads and then eluted.
Lane 3: KanR gene ligated to bead-bound Ori.
Lane 4: Existing bead-bound Ori-KanR sample ligated with linker, then ligated with ChlorR
(beads are always washed between ligations).
Perfecting the Linkers
To get a more effective ligation without extending the timeframe of our assembly, we made several adjustments. First, we raised ligation temperature from 4°C to 22°C in the hopes of increasing the enzyme activity. We switched to a larger, 25-base-pair linker – we were able to successfully ligate large pieces in the case of the Ori and KanR ligation, so perhaps size plays a factor. We used better-purified stocks of our genes, to eliminate the possibility that some interfering piece of the original plasmid was competing with our desired reaction. Finally, we attempted to increase the concentration of the linker in the hopes of driving the reaction to completion. Here, we can see that our changes have significantly improved the ligation efficiency, although changing the linker concentration has not created an appreciable benefit.
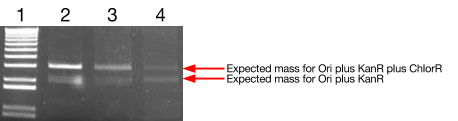
Figure 2: Agarose gel electrophoresis image from linker concentration comparison after
ligation protocol adjustments.
Lane 1: DNA Markers
Lane 2: Ori-KanR ligation to linker, then to ChlorR (as in Figure 1, Lane 4) using 10:1 ratio of
linker to Ori.
Lane 3: As lane 2, with 50:1 ratio.
Lane 4: As lane 3, with 100:1 ratio.
The Full Assembly
With our successful ligation protocol established, we moved on to attempting a full-scale assembly, with four genes (the quantity required for our proof-of-concept travelling salesman problem). In this gel, the four lanes show the successive addition of the four genes, which are, for the most part, successful. In each lane, there is some remainder of the previous products left behind, including (presumably) instances of strands that were incomplete in one reaction continuing to acquire genes in a successive one. Regardless, these incomplete genes represent only a small fraction of the total DNA.
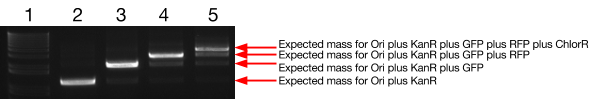
Figure 3: Agarose gel electrophoresis image from full assembly test.
Lane 1: DNA Markers.
Lane 2: Ori to KanR ligation product.
Lane 3: Ori-KanR to linker to GFP ligation product.
Lane 4: Ori-KanR-Linker-GFP to linker to RFP ligation product.
Lane 5: Ori-KanR-Linker-GFP-Linker-RFP to linker to ChlorR ligation product.
The product plasmids from this assembly were transformed into a bacterial culture and grown on a Kan/Chlor plate to examine practical impact of the rate of incomplete ligations. The plate image is shown below – about 90% of the colonies display the desired RFP/GFP (orange colouration) phenotype indicating a perfect successful ligation of the plasmid.

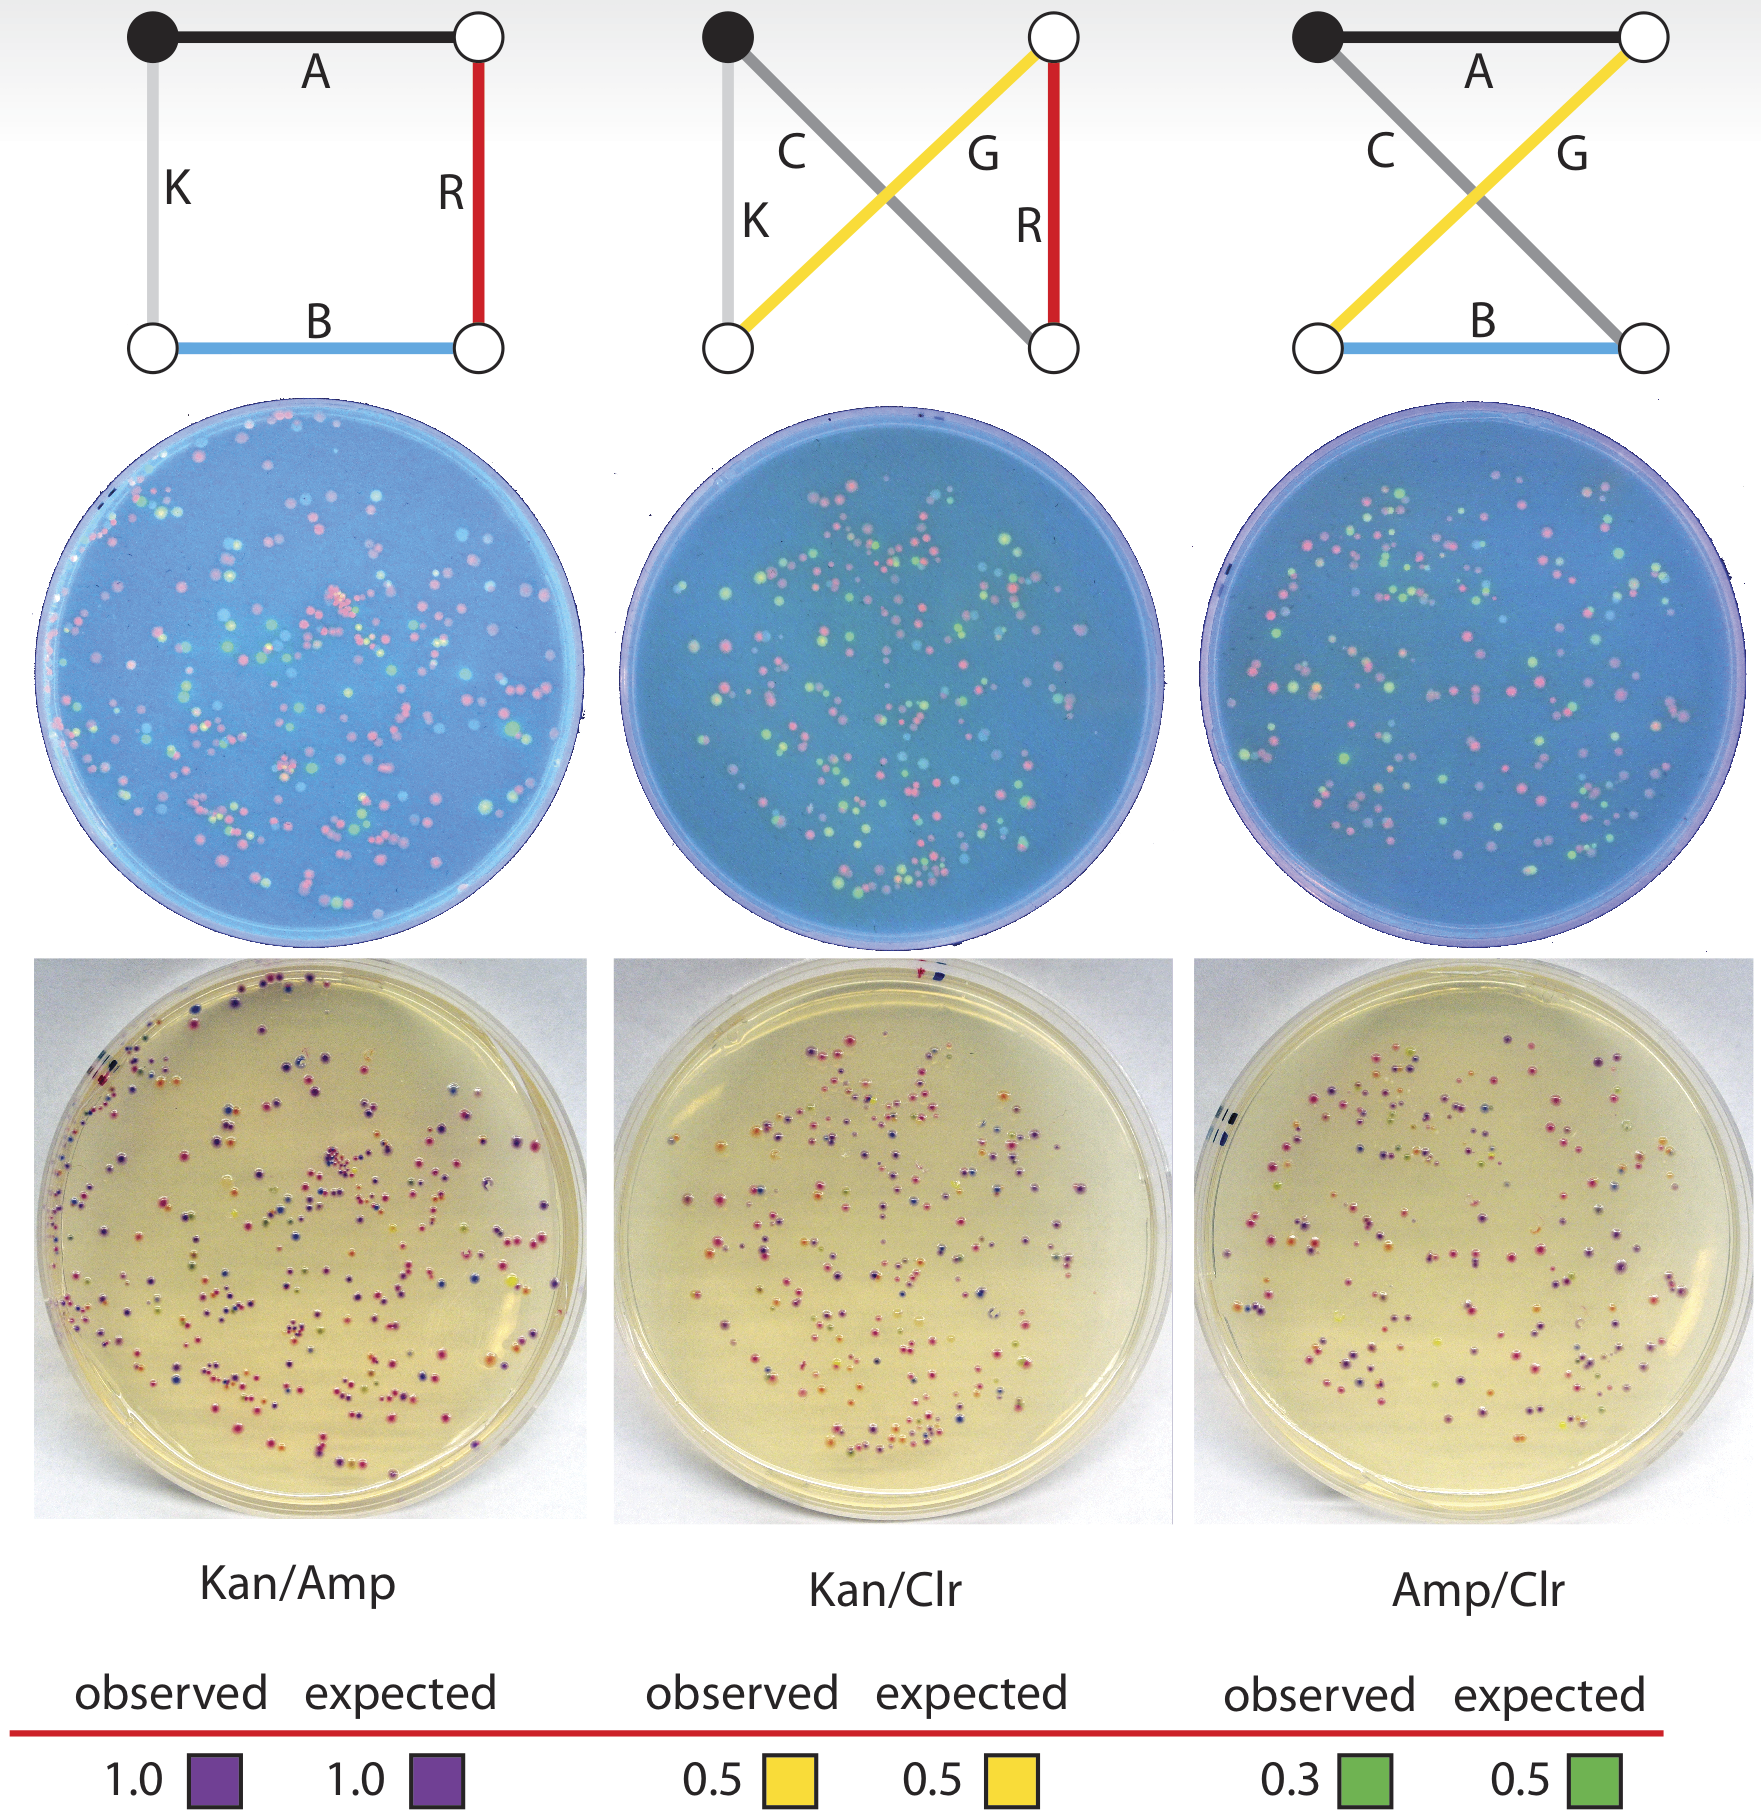
Colour Controls
In our planned, four-city proof-of-concept test (see the map below), there are exactly three possible solutions and three corresponding phenotypes: blue/green (dark green) bacteria with Amp/Chlor resistance, red/green (orange) bacteria with Chlor/Kan resistance, and red/blue (purple) bacteria with Amp/Kan resistance.
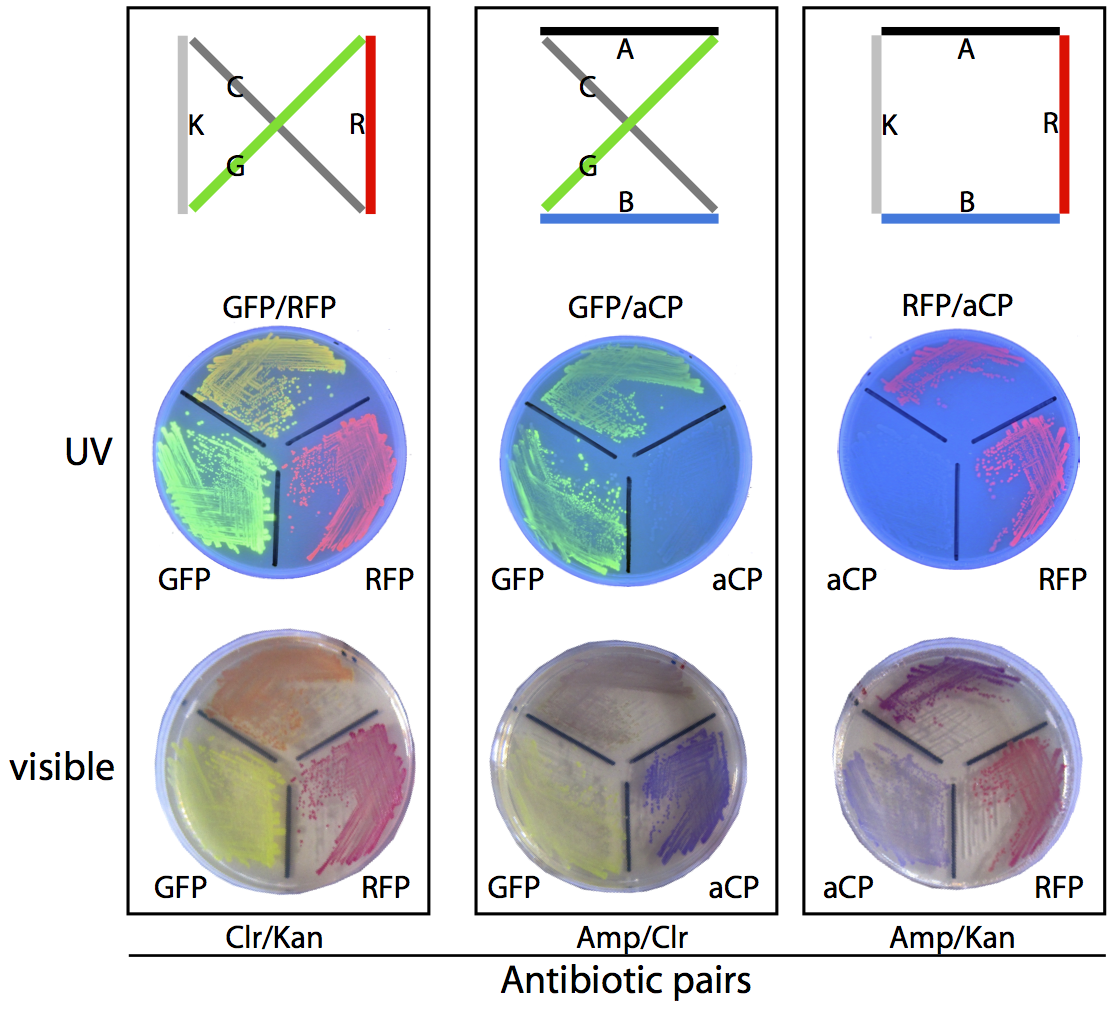
To ensure we would be able to correctly identify plasmids based on phenotype we prepared a set of control plates, where bacteria grown from pure assemblies of the desired “route” plasmid were grown alongside bacteria possessing only one of the two colours from that route, for comparison purposes. The resulting plates can be seen above.
Initial Calibration
In preparation for our initial travelling salesman problems, we attempted to discern the extent to which unexpected or unknown biases might affect the frequency of colonies growing with a particular gene.
In this test, we performed an assembly in which both GFP and aCP were included (in equal molar concentration) in the initial ligation onto the Ori, followed by a ligation of ChlorR, resulting in a mixture of Ori-GFP-ChlorR and Ori-aCP-ChlorR plasmids. We transformed these plasmids into a single bacterial culture, which we then spread on a Chlor-treated plate in order to count the resulting colonies. We repeated this test for each of the other four genes to be used in our proof-of-concept TSP, comparing each against GFP as a standard. This provided us with the following ratios of growth.
Table 1: 1GFP 6aCP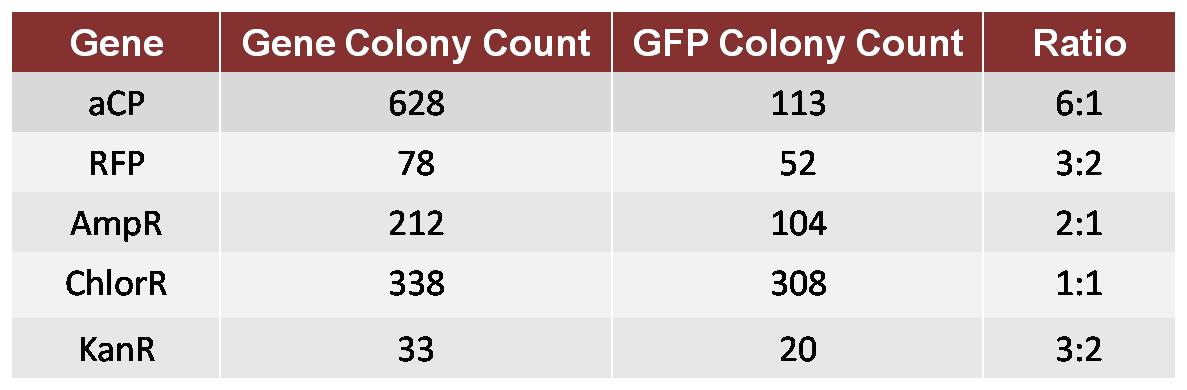
We then attempted another assembly in which we calibrated for the bias. We used a 6:1 molar ratio of GFP to aCP in the new assembly, otherwise performing the experiment as before, and produced a new plate with a ratio of approximately 1:1 GFP colonies to aCP colonies. Although imperfect, this calibration was adequate for our proof-of-concept trial.
The Equidistant Salesman
Our first attempt at any TSP was merely to demonstrate that the system is capable of selecting different routes when given the full range of possibilities. The equidistant travelling salesman problem uses a map of cities in which every city is exactly the same distance away from every other city, such that there is no preference for one path over another, and thus all genes are added to the assembly so as to yield identical colony production (incorporating our initial calibration values). There is no optimal solution for this problem, as all routes are exactly the same length.
The assembly was otherwise as we would treat a real TSP, and the resulting plates can be seen below. The plates in this case have no clear preference for any path, but do display the variety of phenotypes that one can expect from an assembly of this sort, where there are as many as 27 different possible plasmids.
The Travelling Salesman Problem
We have conducted a single successful travelling salesman problem. This problem was based on a map of four cities in which four of the paths have an arbitrary unit distance of 1, and the remaining two paths have a distance of 4. Of the possible routes in this problem, one route has a total sum distance of 4, and the other two have distances of 10, making that route clearly preferable, and a suitable test of our biocomputer. The three possible routes, with correct gene-path assignment and distances listed for this problem, can be seen below.
On the resulting plates, we counted only one colony corresponding to the ChlorR/GFP/aCP/AmpR route, and 11 colonies corresponding to the ChlorR/RFP/GFP/KanR route. For the optimal route, KanR/aCP/RFP/AmpR, we found 61 colonies, clearly identifying this as the solution to the problem.
While technically a success in terms of its ability to correctly solve this TSP, the trial also demonstrated flaws in our mathematics and scale. With colony counts numbering less than 100 for each solution, the system needs to have much better transformation efficiency, and needs much larger quantities of colonies in total if we hope to confirm a solution statistically. Additionally, the ratios that result from using a simple reciprocal of distance, as we do, are not as accurate as they might be.
OOPs! Turns out our weighting algorithm is adequate but not perfect.
Recently, last year’s team supervisor Doug Ridgway, sagely suggested that while the algorithm that we have used to relate linker concentration to path length may seem intuitively correct but that we may want to exam its validity. We therefore tested a text-book example of a five-city TSP that yields 4 best solutions and 8 sub-optimal solutions (illustrated below). We then compared them to the solutions obtained when we mimicked the linker weighting strategy by summing the reciprocal path lengths. The reciprocal method correctly identified 3 of the 4 best paths and showed close agreement with the rank of other solutions. It was therefore adequate for our POP but not strictly accurate and would probably become increasingly useless with increasing problem complexity. Doug developed a formally correct algorithm which we have described below (see revised strategy).

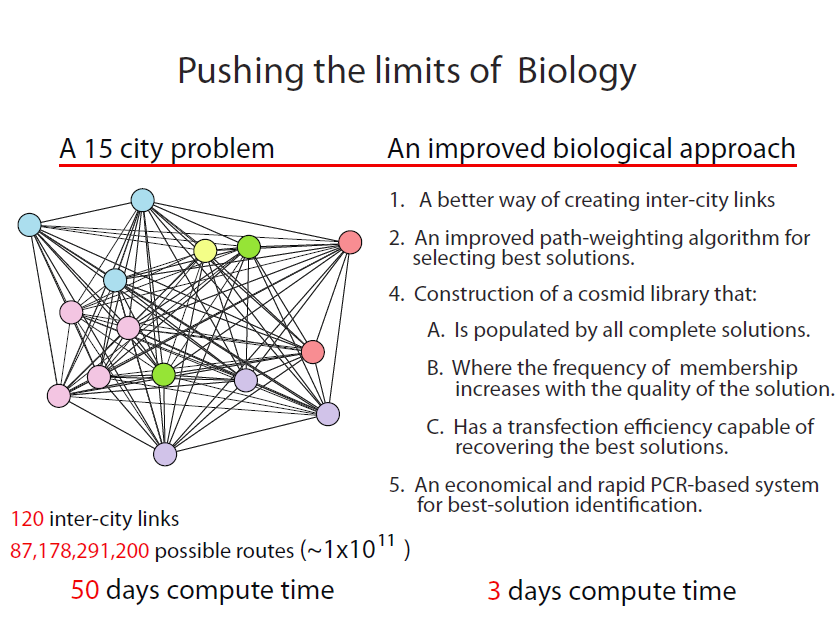
Can we adapt our POP to a much more complex problem?
The ultimate limit of an approach such as this, depends upon the number of complete TSP solutions (plasmids) that can be clonally amplified through cell transformation. We estimate that solving a 15-city problem is within the realm of existing state-of-the-art, but not without major revisions to our POP work presented here. The 15-city problem is not trivial even by conventional computing standards. With 120 intercity links resulting in 87,178,291,200 possible solutions, 50 days would be required to identify the best solutions at a computational rate of 10,000 solutions/second!
The challenges:
- In the POP, solutions are identified by visually determining the frequency of colonies exhibiting the appropriate path combinations represented by the three colour genes and the three drug resistance genes. Extending this approach to the 15-city problem would require the acquisition of 120 markers that are combined 87,178,291,200 ways, well beyond the analytical resolution of standard plating methods.
- A statistically significant sampling of complete solutions is well outside the plasmid transformation efficiencies of even the best competent cells available.
- The precision and efficiency for assembling complete-solution plasmids (38 steps in all) remains to be tested.
A revised strategy
Cities and Paths. In the new approach we invert the role that DNA plays in defining cities and paths. Here, a city corresponds to a gene that complements an amino acid auxotrophy in E. coli (illustrated below). The city is therefore required for growth on defined media that lacks that amino acid. By extension, 15 different cities represented by 15 a.a. auxotrophic markers would be required for survival of E. coli deficient for these genes when grown on media that lacks the corresponding amino acids. Complete plasmid solutions therefore are exclusively selected and amplified from their non-solution counterparts. Creating a 15-gene knockout in E. coli is not trivial but absolutely possible.
The ability to link any two city genes requires that each city has at its 5’ and 3’ ends, overhangs that are nonpalindromic, noncomplementary, and that are distinct in sequence from any of the 14 other city genes.
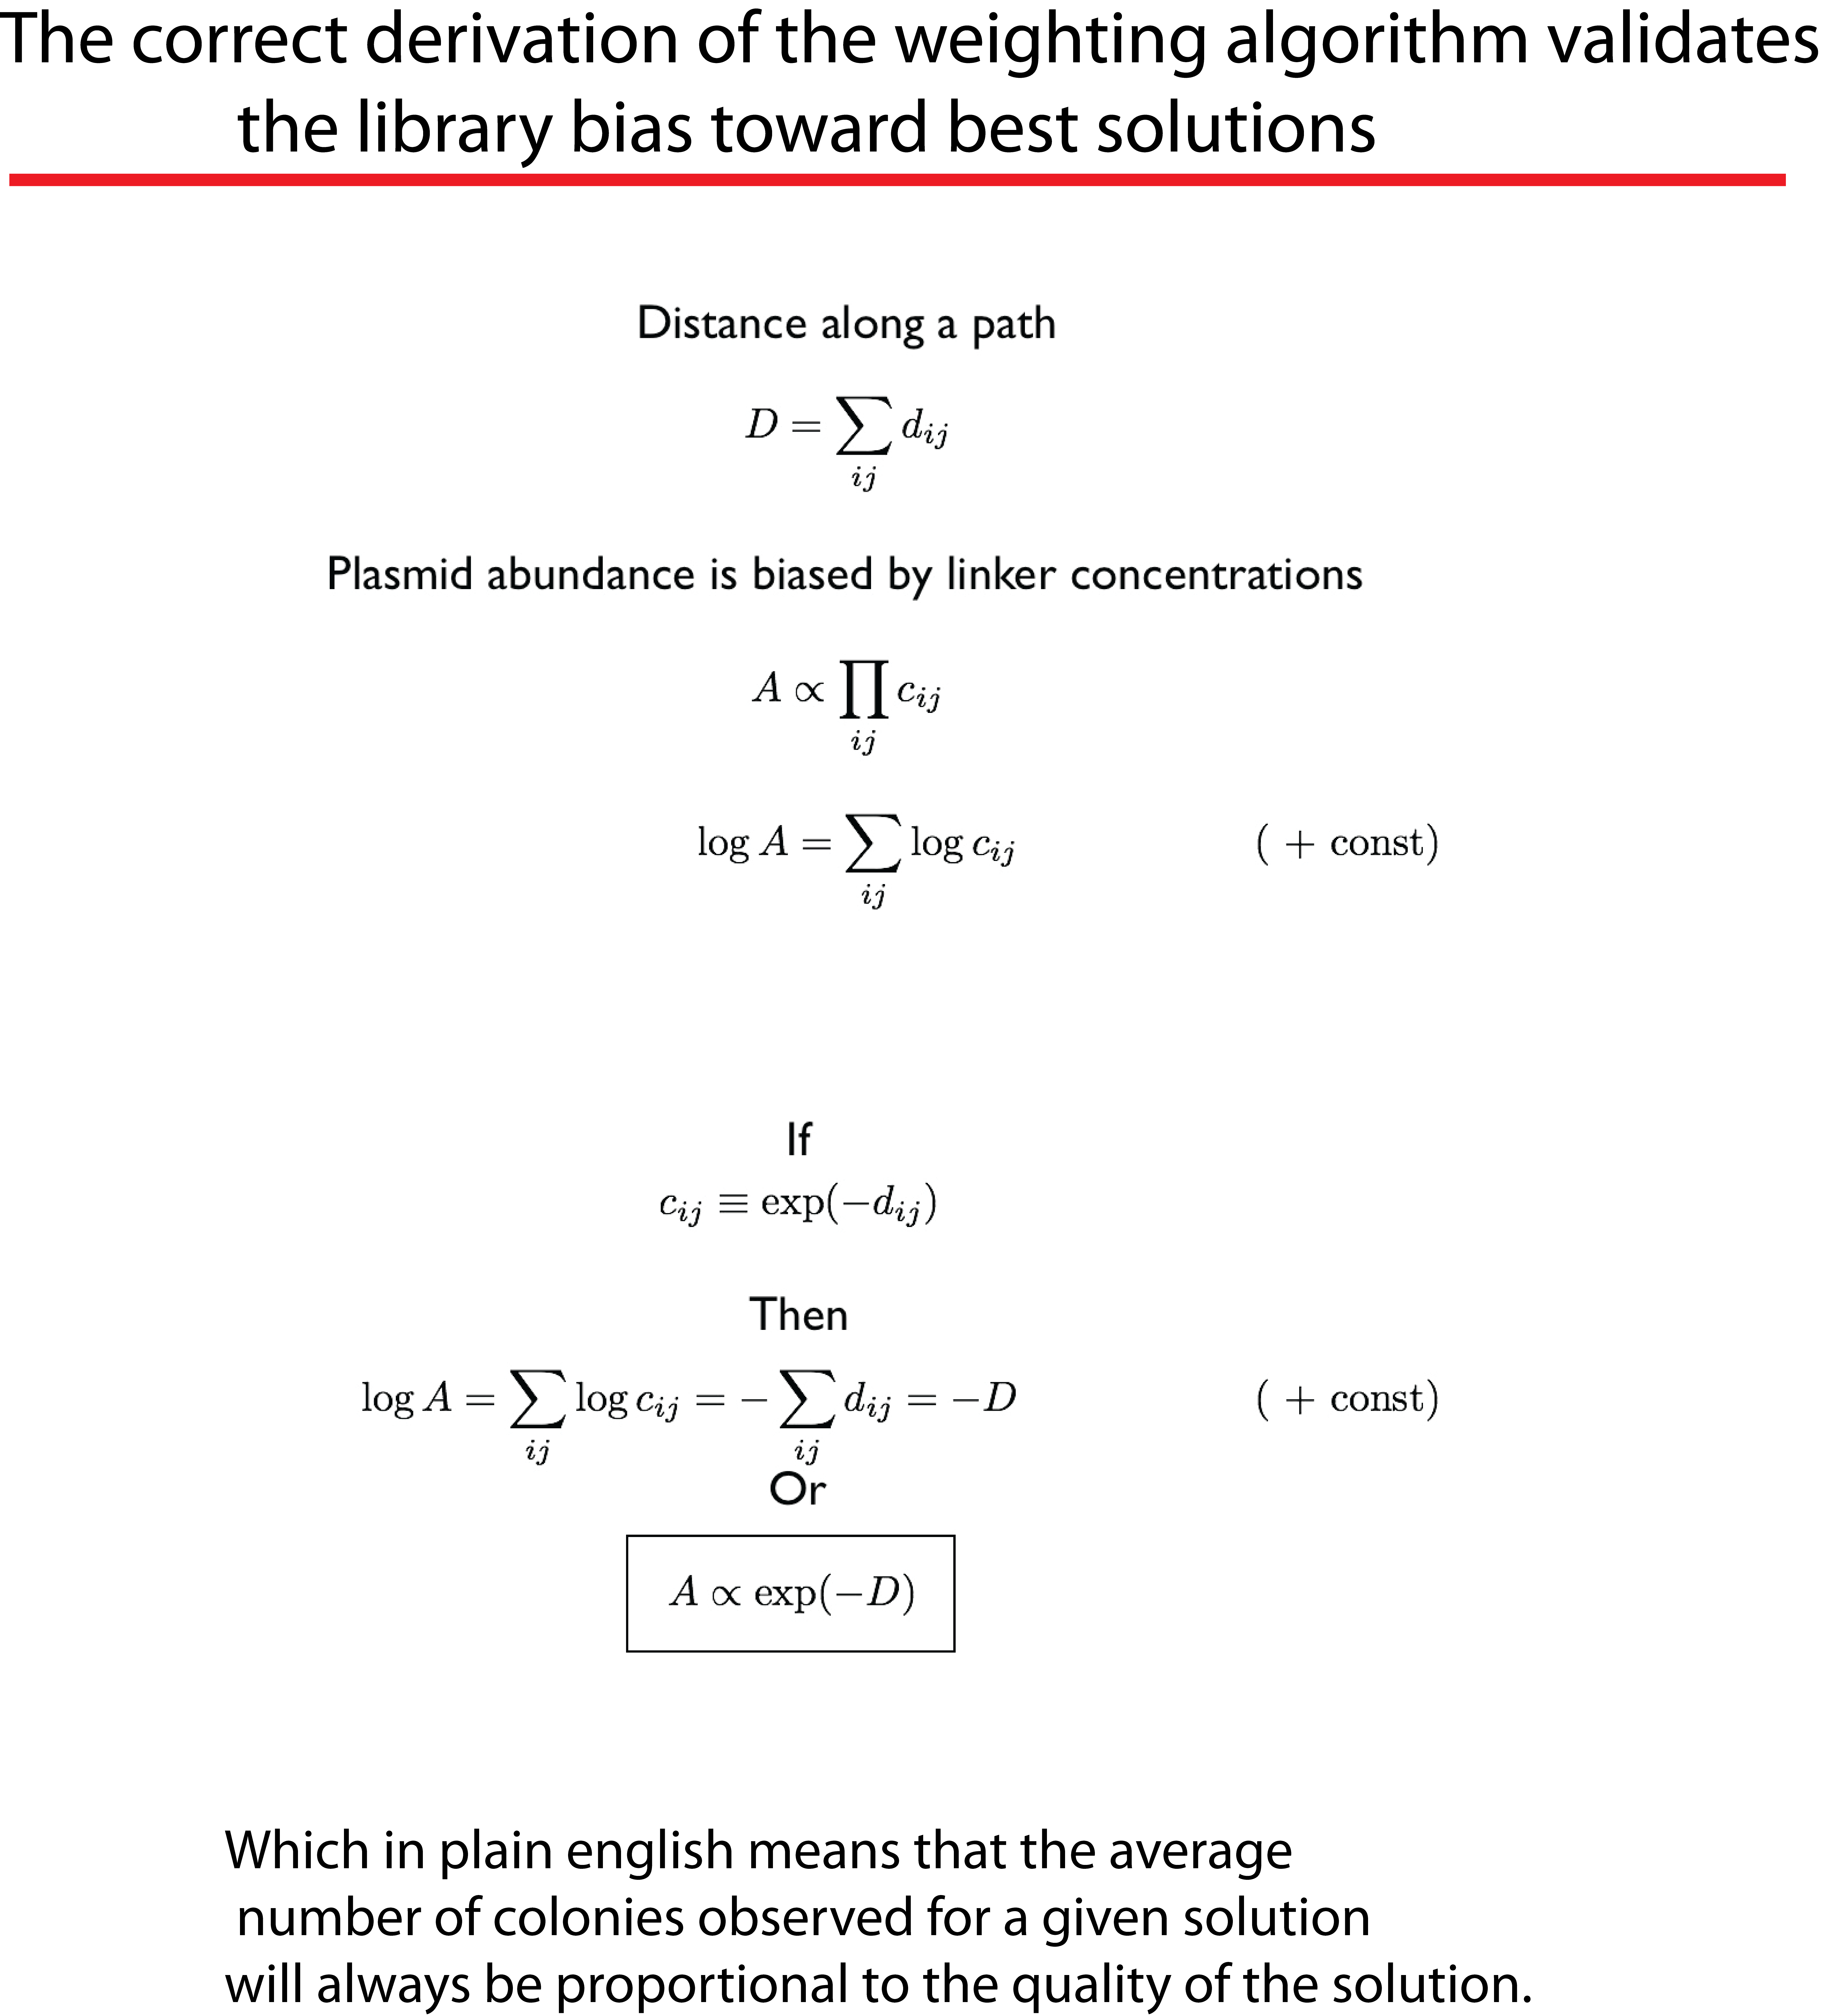
The 120 path possibilities that are needed to link any two cities, are represented by a mixture of 120 synthetic duplex linkers where each linker has two different complementary ends that are capable of linking one of the 120 possible intercity pairs. Shorter intercity distances are favoured by adjusting the concentration of each linker in the mixture according to a new and improved weighting algorithm described below. We point out that in terms of economy, all 120 linkers can be produced from 30 oligos used in pair-wise combinations.
An unavoidable complication of this method is that any given city can occur more than once (at lower frequency) across the 15 available steps during sequential assembly (illustrated above for the three-city example). It should be noted however that any city duplication excludes the possibility of creating the complete set and will therefore be selected against post-transformation.

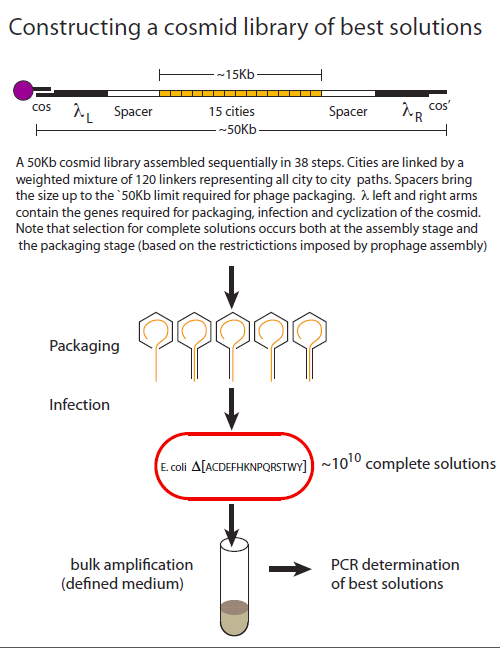
Creating a cosmid DNA library of that is highly biased for best solutions.
To date, λ phage-based recombinant libraries remain unprecedented in terms of the size and diversity of their DNA constituents. In its most advanced form, “cosmid” library kits are commercially available that produce 1010 transformants. Cosmids retain the phage elements that are required for phage packaging and infection but lack the elements required for phage propagation and cell lysis. A plasmid origin allows them to replicate as plasmids.
Cosmids are constructed as linear molecules that begin and end with phage sequences the essential phage sequences(, λL and λR). Complementary 12-base overhangs that constitute the lambda cos and cos’ sites are also required for efficient circularization once the cosmid has entered the cell.
In addition to its favourable tranformation properties, another attractive feature of using a cosmid-based system for TSP is that DNA molecules below a certain length threshold, package poorly, thereby contributing to the selection of full-length solutions.
An overview highlighting the key aspects of library creation is shown below. The assembly procedure uses magnetic beads where the cos’ sequence has been covalently linked. Asssembly begins with a cos- λL synthetic adapter that allows for the subsequent addition of λL. The addition of spacer sequences insure that total size of the construct is optimal for packaging (~50kB). Linker combinations are then added in alternation with city combinations until the city content is complete. Finally the construct is terminated with λR and a cos’ adapter. Following packaging cells are infected in selective liquid medium and the cosmid population is isolated for PCR analysis. The library is heavily biased 1) for complete solutions based on the assembly and packaging considerations already described and 2) for best solutions based on the path weights assigned to each linker addition step.
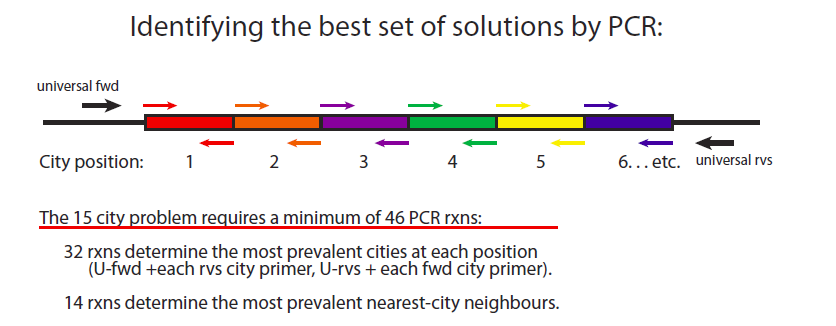
PCR-based identification of best solutions.
The two types of data that is required for piecing best solutions together are 1) determining the cities that most frequently occupy each position from 1 to 15 and 2) determining the most frequently used intercity pairs as outlined below.
Testing the 15-city TSP with a 5-city TSP pilot experiment. We are now set up to test key aspects of the revised strategy (city/path design, algorithm, and PCR strategy) that we expect to have completed before the competition finals. We have created Biobricks for each of the five violacein orfs that when expressed in operon format result in violet colonies. The overhangs required for city specification are added by the addition of terminal BsaI sites via PCR. Furthermore, the oligos required for linker creation have been designed and ready for ordering. The presence of each orf (city) is required for the violet phenotype. Thus complete solutions will be found amongst the population of violet colonies that can pooled into a limited library and analysed by PCR as already described. The weights of the linkers within the linker mix will be adjusted according to our new algorithm to reflect the twelve 5-city solution outcomes in TSB presented above.