"
"
Team:BIT-China/modeling.html
From 2013.igem.org
Singlewindy (Talk | contribs) |
Singlewindy (Talk | contribs) |
||
| Line 25: | Line 25: | ||
<div id="header"> | <div id="header"> | ||
| - | <a href="./index.html"><img src=" | + | <a href="./index.html"><img src="https://static.igem.org/mediawiki/2013/5/57/BIT-China_Logo.jpg" alt="logo"></a> |
</div> | </div> | ||
Revision as of 06:12, 26 September 2013
Overview
Precise and accurate quantitative measurements of biological systems are crucial to improving understanding of biology. Such measurements often help to elucidate how biological systems work and provide the basis for model construction and validation. Differences between predicted and measured system behavior can identify gaps in understanding and explain why synthetic systems don't always behave as intended.
Mathematics in biology aims at the mathematical representation, treatment and modeling of biological processes, using a variety of applied mathematical techniques. It has both theoretical and practical applications in biological research. Usually, a biological system is converted into a system of equations or rules. The model often makes assumptions about the system. The equations may also make assumptions about the nature of what may occur. The solution of the equations or rules, by either analytical or numerical means, describes how the biological system behaves either over time or at equilibrium, which might not be evident to the experimenter.
A gene regulatory network (GRN) is a collection of DNA segments in a cell which interact with each other indirectly (through their RNA and protein expression products) and with other substances in the cell, thereby governing the expression levels of mRNA and proteins.
Some proteins though serve only to activate other genes, and these are the transcription factors that are the main players in regulatory networks or cascades. By binding to the promoter region at the start of other genes they turn them on, initiating the production of another protein, and so on. Some transcription factors are inhibitory.
For one green world, an Intelligent Microbial Heat Regulating Engine (I’M HeRE), as shown in figure 1, was designed to satisfy our needs described in the project. The engine consists of 2 systems namely the heat-resistant system and the quorum-control system as shown in figure 2. When the number of cells increased to a certain extent, the gene regulatory network was started to control the number of live cells.
 Fig.1 the gene regulatory network (GRN) of the intelligent microbial heat regulating heat engine. (a) shows the regulatory relationships of these genes. (b) is the detailed diagram of the GRN of the quorum control system.
The GRN is too complicated to conducted biological experiments. Thus dynamic simulation of the GRN by mathematical modelling is particularly important. Before the wet experiments were conducted, mathematical models were built to predict the behavior of our heat regulating engine. Such bottom-up design of synthetic gene circuit will not only speed up the biology research, but provide us a valuable insight into the system as well. We were able to know in a particular state which genes were expressed? What the expression level was? And what’s the influence of the gene product on cell physiological activities? And by further analysis of the dynamic behavior of gene regulatory networks, we were able to provide a guidance on the design of experiments.
Currently, there are a variety of models, such as the directed graph model, Bayesian network model, Boolean network model, ODE models and stochastic differential equations models, have been successfully applied to the analysis, modeling and simulation of gene regulatory networks. ODE model requires some assumptions which generally cannot be confirmed. One assumption of ODE model is the variables can be continuous values which was not proper for some biological process for the biological objects or molecules are essentially discrete. The variables can be continuous values only on condition that there is a sufficiently large number of molecules. Besides, one important assumption of the ODE model was that the process to be described should be deterministic which cannot be confirmed too. The problem could be solved if a stochastic simulation method was adopted.
For a set of chemical reactions described below:

The number of different kinds of molecules was expressed as 
, thus a state of the system could be described as 
. The system changes to a new state 
if the first reaction occurs.

Noise in the cell
The cellular environment is abuzz with noise. A key source of this “intrinsic” noise is the randomness that characterizes the motion of cellular constituents at the molecular level. Cellular noise not only results in random fluctuations (over time) within individual cells, but it is also a source of phenotypic variability among clonal cellular populations. Researchers are just now beginning to understand that the richness of stochastic phenomena in biology depends directly upon the interactions of dynamics and noise and upon the mechanisms through which these interactions occur.
Heat Resistant system

The heat resistant system was made up by a RNA thermometer and a heat shock protein expression device.That is just what we want, like picture B, E.coli get together to fight with fire, so that they can survive in a hotter
We need to know the shape of the growth curve under normal growth condition? And what the impact if the lethal effect is considered? What is the time to turn on the RNA temperature switch? What happened if the cooling system was removed? We want to give these predictions by the coupled quantity & heat curve model.


(1) is the logistic growth model with the lethal effect considered, and the smooth curve shows relationship of the number of cells via time.
(2) is the model demonstrating the relationship of heat change via time. Thus we could get coupled quantity & heat model.
We need to know the shape of the growth curve under normal growth condition? And what the impact if the lethal effect is considered? What is the time to turn on the RNA temperature switch? What happened if the cooling system was removed? We want to give these predictions by the coupled quantity & heat curve model.


We could get the information that the heat in the fermenter will accumulate over time without a cooling system from the above figure. Once the cooling system was turned on, a steady state could be achieved as shown in the figure below.

Quorum Control system
The quorum control system was composed of 3 device. We want a better understanding of the process of gene regulation by analyzing the dynamical properties of the gene regulatory networks. In this project, the simulation was performed in only a single cell.


Quorum sensing is a system of stimulus and response correlated to population density. Many species of bacteria use quorum sensing to coordinate gene expression according to the density of their local population. Quorum sensing can function as a decision-making process in any decentralized system, as long as individual components have: (a) a means of assessing the number of other components they interact with and (b) a standard response once a threshold number of components is detected.

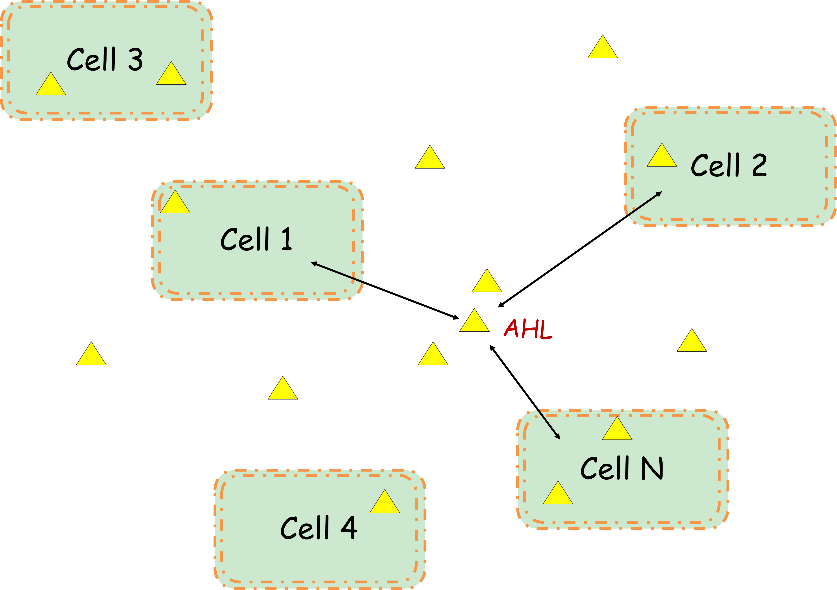
A variety of different molecules can be used as signals. Common classes of signaling molecules are oligopeptides in Gram-positive bacteria, N-Acyl Homoserine Lactones (AHL) in Gram-negative bacteria, and a family of autoinducers known as autoinducer-2 (AI-2) in both Gram-negative and Gram-positive bacteria. There is a linear relationship between the AHL molecule concentration and cell concentration.
It is assumed that AHL was produced and degraded at a certain rate to maintain a certain concentration in a single cell. That is to say the number of AHL molecules within a single cell is constant. Therefore, the total concentration of AHL in the broth has a proportional relationship with the total number of cells. The regulating engine was started when the number of AHL molecules reaches a certain threshold, or when the number of cells reaches a certain threshold.