 "
"
Team:Bielefeld-Germany/Labjournal/September
From 2013.igem.org
September
Milestones
- Successful characterization of glycerol dehydrogenase
- NADH-Assays show an increasing intra- and extracellular NADH concentration for Escherichia coli KRX with overexpression of glycerol dehydrogenase.
- Glycerol dehydrogenase was examined by MALDI-TOF MS/MS with a Mascot Score of 266 against Escherichia coli database.
- Great characterization of outer membrane porine oprF
- Successful Hexadecan Assay for characterization of hydrophobicity of the outer membrane. The hydrophobicity increases continuously with increasing promoter strength up to 221% hydrophobizity in contrast to the wild type.
- ONPG and NPN uptake assays were performed. Membrane permeability is continuously increasing for Escherichia coli with heterologous expression of oprF.
- According to AFM images, E. coli KRX with oprF shows a slightly rougher cell surface morphology in contrast to Escherichia coli KRX wild type, which confirms the results.
- We can see a strong band on SDS-PAGE at the expected oprF size of about 36 kDa which is equated with a strong expression and overproduction of oprF. Furthermore outer membrane porine was examined by MALDI-TOF MS/MS with a Mascot Score of 222 against bacteria database.
- Riboflavin synthesis gene-cluster brought to BioBrick form <bbpart>BBa_K1172303</bbpart> and equipped with three different promoters, resulting in three new devices:
- <bbpart>BBa_K608002</bbpart> + <bbpart>BBa_K1172303</bbpart> = <bbpart>BBa_K1172306</bbpart>
- <bbpart>BBa_K608006</bbpart> + <bbpart>BBa_K1172303</bbpart> = <bbpart>BBa_K1172305</bbpart>
- <bbpart>BBa_K525998</bbpart> + <bbpart>BBa_K1172303</bbpart> = <bbpart>BBa_K1172304</bbpart>
- Characterization of <bbpart>BBa_K1172303</bbpart> starts with absorbance measurement of produced riboflavin.
- Potential riboflavin supplementary genes norM and ribC converted to BioBrick standard:
- <bbpart>BBa_K1172301</bbpart>
- <bbpart>BBa_K1172302</bbpart>
- mtrCAB BioBrick (<bbpart>BBa_K1172401</bbpart>) was succesfully ligated.
- mtrCAB BioBrick Devices with different promoters and RBS of varying strength were constructed:
- <bbpart>BBa_K1172403</bbpart>, <bbpart>BBa_K1172404</bbpart>, <bbpart>BBa_K1172405</bbpart>
- MFC: Completed final design of DIY fuel cell and sent it out for printing. After receiving the print from the faculty of physics we took it to the lab for further testing.
- We supported the CeBiTec student academy with supervising the ‘Synthetic Biology’ experiment and the day of synthetic biology in the city of Bielefeld.
- Our team assigned the Track Food & Energy in this year, with the project title ‘Ecolectricity – currently available’.
- We successfully produced the alanine racemase biobrick <bbpart>BBa_K1172901</bbpart> also with ptac promoter (<bbpart>BBa_K1172902</bbpart>), with double terminator (<bbpart>BBa_K1172903</bbpart>) and the Barnase biobrick <bbpart>BBa_K1172904</bbpart>.
- We successfully produced our biosafety systems araCtive (<bbpart>BBa_K1172909</bbpart>), TetOR alive (<bbpart>BBa_K1172915</bbpart>) and lac of growth (<bbpart>BBa_K1172908</bbpart>).
Week 18
Organization
- This week, we supported the CeBiTec student academy with supervising the ‘Synthetic Biology’ experiment. In addition we had a presentation about iGEM and the Bielefeld iGEM projects.
- Our team assigned the Track Food & Energy in this year, with the project title ‘Ecolectricity – currently available’. Project abstract, safety forms and team roster were added.
MFC
- Came up with new fuel cell desgin, because the second generation fuel cell had severe limitations. Ordered plastic parts for this fuel cell.
- Faculty of physics agreed to help us, but the first print they did for us unfortunately turned out quite bad.
- Carried out anaerobic cultivations of our strains in M9 Medium supplemented with different carbon sources and, in samce cases, soluble or insoluble electron acceptors.
Mediators
- Glycerol dehydrogenase
- Repeating NADH-Assay with three times PBS buffer washing step shows good results with better NADH production for E. coli KRX with pSB1C3 <bbpart>BBa_K1172203</bbpart> and <bbpart>BBa_K1172204</bbpart> compared with E. coli KRX wild type. gldA with T7 promoter (<bbpart>BBa_K1172203</bbpart>) shows 0.5 μM NADH overproduction and gldA with Lac promoter (<bbpart>BBa_K1172204</bbpart>) shows 0.3 μM NADH overproduction. The data refer to a culture with OD600 = 3.0.

Table 1: Results of the NADH-Assay. Comparison between Escherichia coli KRX wild type and Escherichia coli KRX with <bbpart>BBa_K1172204</bbpart> and <bbpart>BBa_K1172203</bbpart>. NADH concentration with standard deviation and concentration in comparison to the wild type is shown.

Figure 1: Column Chart with results of the NADH-Assay. Comparison between Escherichia coli KRX wild type and Escherichia coli KRX with <bbpart>BBa_K1172204</bbpart> and <bbpart>BBa_K1172203</bbpart>. NADH concentration with standard deviation and concentration in comparison to the wild type is shown.
- Second successful optimized NADH-Assay with Escherichia coli KRX wild type strain and E. coli KRX with pSB1C3 and <bbpart>BBa_K1172203</bbpart>, <bbpart>BBa_K1172204</bbpart>, and <bbpart>BBa_K1172205</bbpart>.
- gldA with T7 promotor (<bbpart>BBa_K1172203</bbpart>) shows 1.7 μM NADH overproduction and gldA with Lac promoter (<bbpart>BBa_K1172204</bbpart>) shows 0.2 μM NADH overproduction. The GldA expression by the Anderson promoter (<bbpart>BBa_K1172205</bbpart>) is too weak for an efficient NADH overproduction. The data refer to a culture with OD600 = 5.0.

Table 2: Results of the NADH-Assay. Comparison between Escherichia coli KRX wild type and Escherichia coli KRX with <bbpart>BBa_K1172205</bbpart>, <bbpart>BBa_K1172204</bbpart> and <bbpart>BBa_K1172203</bbpart>. NADH concentration with standard deviation and concentration in comparison to the wild type is shown.

Figure 2: Column Chart with results of the NADH-Assay. Comparison between Escherichia coli KRX wild type and Escherichia coli KRX with <bbpart>BBa_K1172205</bbpart>, <bbpart>BBa_K1172204</bbpart> and <bbpart>BBa_K1172203</bbpart>. NADH concentration with standard deviation and concentration in comparison to the wild type is shown.
- Overexpressed glycerol dehydrogenase should be examined by MALDI-TOF MS/MS.
- Tryptic digest of gel lanes for analysis with MALDI-TOF.
- Glycerol dehydrogenase was examined by MALDI-TOF MS/MS with a Mascot Score of 266 against Escherichia coli database.
- Overexpressed glycerol dehydrogenase should be examined by MALDI-TOF MS/MS.
- Riboflavin
- We tried to ligate our four DNA-Sequences in pSB1C3 using Gibson Assembly.
- To further minimize the risk of false positive clones just carrying pSB1C3, we digested the pSB1C3-PCR-products with DpnI, prior to Gibson.
- We assembled every fragment with its specific vector six times. For each fragment, we used two different approaches: The “Standard-protocol” where you take 100 ng insert in 3:1 molar excess compared to the vector and an “over the top-protocol” (OTTP). The OTTP uses the same molar excess, but a much higher amount of DNA.

Table 3: Amounts of vector and insert used for Gibson Assembly
- After picking colonies on ¼ plates we processed the plasmid isolation and test-digested the samples to confirm that the DNA-sequences, still with the illegal sites, were integrated in pSB1C3. Digestions were performed with 250 ng of plasmid-DNA + 2.5 µl of Cut-Smart-Buffer (NEB) + 0.5 µl of enzyme each.

Figure 3: Test-digest of the plasmid isolations with EcoR1 and Spe1 from NEB. Positive results gave lanes 1, 5 and 6 for ribC; 1 - 5 for norM
- Due to the illegal restriction site EcoR1, we repeated the digestion of rib and rib-nusB only with XbaI.

Figure 4: Test-digest of the plasmidisolations for rib and rib-nusB (same as rib-nus) with Xba1 from NEB. Positive results gave lanes 1, 3 and 5 for rib.
- We were succesful in cloning rib, ribC and norM (with illegal sites) in pSB1C3.
- From this point on, we disclaimed rib-nusB (also rib-nus). It was the only DNA sequence we were not able to obtain right away and further research indicated that it lacks significance for our project. So we decided to not waste our precious time on it.
- After the succesful integration of the three most important sequences in pSB1C3, and the insofar completion of our first BioBrick BBa_K1172302 (ribC), we started with the elimination of the illegal restriction sites in rib and norM</p>.
- Therefore we diluted one rib and one norM sample to 10 ng/µl and used it as PCR template.
- At the beginning of the week, we had started to design primers for this purpose:
- pst1-234 fwd (38 bp)
TGTCACCTTAGAACCCTGTAGCCATTATGGTCGTACGC - pst1-234 rev (32 bp)
CGACCATAATGGCTACAGGGTTCTAAGGTGAC - pst1-1644 fwd (30 bp)
GTGCCCCATACTGTAGGTGAAACCACGTTG - pst1-1644 rev (34 bp)
AACGTGGTTTCACCTACAGTATGGGGCACAATCG - EcoR1 fwd (43 bp)
GGCACTCAGTTCACTTAGGTATAGAATTTATAACAACAGTCAC - EcoR1 rev (43 bp)
GTGACTGTTGTTATAAATTCTATACCTAAGTGAACTGAGTGCC - pst1 norM fwd (38 bp)
GCGATCGTGCTGATATTTCTGCGGTGGTCGCCAAAGTC - pst1 norM rev (41 bp)
CAATAAGCCGACTTTGGCGACCACCGCAGAAATATCAGCAC
- pst1-234 fwd (38 bp)
- our initial phusion-gradient-pcr´s gave good results. The amplification of the fragments at fitting PCR conditions could start:
- Fragment 1 had a length of 1410 bp (+overlaps); Primers used: pst1-234 fwd + pst1-1644 rev; Annealing temp.: 69°C; Elongation time: 22 s.
Fragment 3 had a length of 4061 bp (+overlaps); Primers used: EcoR1 fwd + pst1-234 rev; Annealing temp.: 68°C; Elongation time: 61 s.
Fragment 2 had a length of 196 bp (+overlaps -> 225!); Primers used: pst1-1644 fwd + EcoR1 rev; Annealing temp.: 65.7°C; Elongation time: 3 s (worked well in a modern "Eppendorf Thermocycler").
- Fragment 1 had a length of 1410 bp (+overlaps); Primers used: pst1-234 fwd + pst1-1644 rev; Annealing temp.: 69°C; Elongation time: 22 s.

Figure 5: Successful amplification of fragment 1, 2 and 3 at appropiate annealing temperatures and elongation times. Ladder´s used: GeneRuler™ 1 kb DNA Ladder from Thermo Scientific and Roth 100 bp DNA-Ladder equimolar.
- Fragment X had a length of 2515 bp (+overlaps); Primers used: pst1 norM fwd (see week 17) + pSB1C3_rev_norM; Annealing temp.: 72°C; Elongation time: 30 + 38 s. (this PCR was run as two-step PCR. The annealing and elongation were run at the same Temperature of 72°C)
Fragment Y had a length of 935 bp (+overlaps); Primers used: norM_fwd (see week 17) + pst1 norM rev; Annealing temp.: 69°C; Elongation time: 22 s.
- Fragment X had a length of 2515 bp (+overlaps); Primers used: pst1 norM fwd (see week 17) + pSB1C3_rev_norM; Annealing temp.: 72°C; Elongation time: 30 + 38 s. (this PCR was run as two-step PCR. The annealing and elongation were run at the same Temperature of 72°C)

Figure 6: Successful amplification of fragment X and Y at appropiate annealing temperatures and elongation times. Ladder used: GeneRuler™ 1 kb DNA Ladder from Thermo Scientific.
Cytochromes
- New primers were ordered. pSB1C3 Gibson primer for the ccmAH cluster and a new reverse pSB1C3 primer for the mtrCAB cluster, which has a larger overlap and should therefore improve assembly efficiency.
- psB1C3_rev_ccm....(40nt) CTGGCTTCAAGCATACCCACCTAGAAGCGGCCGCGAATTC
- psB1C3_fwd_ccm....(41nt) CGCCGCAGGAGAGTAAATAATACTAGTAGCGGCCGCTGCAG
- psB1C3_rev_mtrCAB.(40nt) GATTTTTGTGCGTTCATCATCTAGAAGCGGCCGCGAATTC
- Repeated Amplification of psB1C3 with these new primers with corresponding Gibson-overlaps for mtrCAB and ccmAH.
- Phusion PCR
- Template: Plasmid pSB1C3::RFP (J04500) [5ng]
- Annealing: 60°C
- Elongation: 45 s
- The PCR reaction was subsequently digested with DpnI to eliminate any remaining plasmid DNA.
- pSB1C3......4-0609-301......110 ng/µl
- Repeated Amplification of fragment3 of the mtrCAB cluster.
- Frag3_fwd (30 nt) :GTCTGCAATTATGGCATTAGTCGTCACACC
- mtrB_rev (41 nt) :CTGCAGCGGCCGCTACTAGTATTAGAGTTTGTAACTCATGC
- Phusion PCR
- Template: S.oneidensis genomic DNA [5ng]
- Annealing: Gradient [60-70°C]
- Elongation: 50 s
- A Gradient was applied to figure out the annealing temperature with the minimal false bands, so that a PCR clean up with higher yields instead of a gel extraction could be used for isolation. As Figure 7 shows the optimal annealing temperature is around 62-66°C.

Figure 7: Results of a PAGE of a Phusion-PCR with a gradient for the fragment3 of the mtrCAB gene cluster; Expected Size: 3.0 kb; Gradient: 60-70°C; Ladder:Thermo Scientific GeneRuler™ 1 kb DNA Ladder.
- PCR clean up
- Fragment3.......4-0509-305......285 ng/µl
- Repeated amplification of the ccmAH cluster with Gibson primers.
- ccm_fwd (40 nt) :GAATTCGCGGCCGCTTCTAGGTGGGTATGCTTGAAGCCAG
- ccm_rev (41 nt) :CTGCAGCGGCCGCTACTAGTATTATTTACTCTCCTGCGGCG
- Phusion PCR
- Template: E.coli genomic DNA [5ng]
- Annealing: 68°C
- Elongation: 1:35 min
- The PCR was cleaned up and lyophilisated with the SpeedVac
- ccmAH......4-0509-301......157.0 ng/ul
Biosafety
- One day before we pre cultured our bacteria in 5 mM D-alanine and 80 mM glycerin medium. After growing we took 10 mL of each pre culture and centrifuged the cells for 3 minutes by 6000xg, discarded the supernatant and resuspended the cells in 4 mL distilled water. We washed the cells three times. We executed the characterization of araC by cultivation (200 rpm) in shaking flasks with different carbon sources. We used the M9 minimal medium with glucose/arabinose/glycin to measure the growth and the fluorescence of our biosafety system. The fluorescence is caused by the protein GFP which is a replacement for Barnase which is applied for the characterization to draw conclusions from the theoretical expression of the RNase. In continuous intervals samples were taken, the growth of the cells were measured by absorbance and the fluorescence by a plate reader.
Porines
- Successful Hexadecan Assay for characterization of hydrophobicity of the outer membrane. Using Escherichia coli KRX wild type and comparing it with:
- <bbpart>BBa_K1172502</bbpart>: <bbpart>BBa_K1172501</bbpart> + <bbpart>BBa_K525998</bbpart>
- <bbpart>BBa_K1172503</bbpart>: <bbpart>BBa_K1172501</bbpart> + <bbpart>BBa_J04500</bbpart>
- <bbpart>BBa_K1172504</bbpart>: <bbpart>BBa_K1172501</bbpart> + <bbpart>BBa_K608007</bbpart>
- <bbpart>BBa_K1172505</bbpart>: <bbpart>BBa_K1172501</bbpart> + <bbpart>BBa_K608006</bbpart>
- <bbpart>BBa_K1172507</bbpart>: <bbpart>BBa_K1172501</bbpart> + <bbpart>BBa_K608002</bbpart>

Table 4: Results of the Hexadecane Hydrophobicity Assay. Comparison of protein hydrophobicity between Escherichia coli KRX wild type and Escherichia coli KRX with <bbpart>BBa_K1172502</bbpart>, <bbpart>BBa_K1172503</bbpart>, <bbpart>BBa_K1172504</bbpart>, <bbpart>BBa_K1172505</bbpart> and <bbpart>BBa_K1172507</bbpart>. Affinity to hexadecane (hydrophobicity) with standard deviation and enhancement in comparison to the wild type is shown.

Figure 8: Results of the Hexadecane Hydrophobicity Assay. Comparison of protein hydrophobicity between Escherichia coli KRX wild type and Escherichia coli KRX with <bbpart>BBa_K1172502</bbpart>, <bbpart>BBa_K1172503</bbpart>, <bbpart>BBa_K1172504</bbpart>, <bbpart>BBa_K1172505</bbpart> and <bbpart>BBa_K1172507</bbpart>. Affinity to hexadecane (hydrophobicity) with standard deviation and enhancement in comparison to the wild type is shown.
- The hydrophobicity increases continuously with increasing promoter strength up to 221% hydrophobizity in contrast to the wild type.
- Successful ONPG and NPN uptake assays were performed. Membrane permeability is continuously increasing from weak to strong promoter strength.

Figure 9: Results of the NPN-uptake-assay. Comparison of fluorescence emission between Escherichia coli KRX wild type and Escherichia coli KRX with <bbpart>BBa_K1172502</bbpart>, <bbpart>BBa_K1172503</bbpart>, <bbpart>BBa_K1172504</bbpart>, <bbpart>BBa_K1172505</bbpart> and <bbpart>BBa_K1172507</bbpart>. Fluorescence emission scan from 320 up to 390 nm wavelength with standard deviation is shown.

Figure 10: Results of the ONPG-uptake-assay. Comparison of ONPG hydrolysis between Escherichia coli KRX wild type and Escherichia coli KRX with <bbpart>BBa_K1172502</bbpart>, <bbpart>BBa_K1172503</bbpart>, <bbpart>BBa_K1172504</bbpart>, <bbpart>BBa_K1172505</bbpart> and <bbpart>BBa_K1172507</bbpart>. Absorbance at 405 nm wavelength with standard deviation is shown.
- Beside testing oprF BioBrick (<bbpart>BBa_K1172501</bbpart>) with different assays and SDS-PAGE, the membrane should be visually displayed. The technique of choice is atomic force microscopy.
- The glass slides were coated with Escherichia coli KRX wild type and Escherichia coli KRX with <bbpart>BBa_K1172502</bbpart> in order to compare the membrane differences. The AFM itself was performed with the help of the working group of Prof. Dr. Dario Anselmetti, with special help from Dr. Volker Walhorn.
- AFM was carried out using the MultiMode® 8 AFM from Bruker. The measurements were performed on air with ‘Tapping Mode’ and in water with ‘Peak Force Mode’.

Figure 11: AFM images of the cell surface for Escherichia coli KRX wild type and Escherichia coli KRX with heterologous expression of porin OprF (<bbpart>BBa_K1172502</bbpart>). Images are shown in Topography and Contrast mode.
- According to AFM images, Escherichia coli KRX with oprF and T7 promotor (<bbpart>BBa_K1172502</bbpart>) shows a slightly rougher cell surface morphology in contrast to Escherichia coli KRX wild type.
Week 19
Organization
- Our WDR TV contribution could be seen in the ‘OWL local time’ and in the WDR library.
- We have successfully performed the day of synthetic biology in the city of Bielefeld. With the help of our poster we were able to explain our project to many people. The kids had a lot of fun with performing different experiments, which introduced them into scientific work. DNA isolation from fruit and vegetables, pipetting of bright colors, chromatography with markers, a potato battery and microscopy were on the program. All in all a very successful day.
MFC
- Modified the .stl-files of the 3D-Model to receive better results when 3D-printing
- Carried out anaerobic cultivations of our strains in M9 Medium supplemented with different carbon sources and, in samce cases, soluble or insoluble electron acceptors.
Mediators
- Riboflavin
- Due to false bands we were forced to extract Fragment 3 from a gel. We were able to generate a concentration of 2.1 ng/µl and 3.0 ng/µl respectively. So evaporation of the probes in a SpeedVac was necessary. Afterwards, we had practical concentrations of 40 ng/µl and 30 ng/µl.
- For fragments 1 and 2, as well as X and Y, a simple DpnI digest was sufficient.
- 45 µl + 5 µl FD-Buffer + 1 µl FD DpnI -> 80 min/37°C; 20 min/80°C
- By now we had successfully generated multiple fragments that would not carry any illegal restriction sites.
- Subsequently, we could now start the decisive Gibson assemblies:

Table 5: Preparation of the Gibson assembly mixes for BioBrick fabrication.
- We transformed the eletrocompetent E.coli KRX with 0.8 µl of the assembly mix. Each mix was transformed three times and then transferred to 450 µl SOC-Media. After one hour in a 37°C water bath, we plated our cells on LB-plates supplemented with chloramphenicol.
- The next day, we found that a staggering amount of cells had been growing on our plates. We were a bit sceptical, but picked eight to sixteen colonies per plate anyway. We diluted the colonies in 20 µl of H20 and plated them on ¼ Cm-Plates.
- Twenty-four hours later we did several miniPreps and executed a test-digestion with XbaI and PstI. The test rendered very good results: BIOBRICKS! <bbpart>BBa_K1172303</bbpart> and <bbpart>BBa_K1172301</bbpart>.

Figure 12: Digestion of multiple plasmid minipreps using Xba1 and Pst1 by NEB.
- As you can see above, in Figure 12, both Gibson approaches gave viable results. In the upper part of the gel we can see bands at approx. 2000 bp that belong to linear pSB1C3. The rib-gene-cluster (further rib) has a length of 3597 bp. The negative bands occurred only when a flash could be seen during electroporation. In the lower part of the gel, we see bands at approx. 1300 bp in every lane but two. 1330bp is the length of norM.
- We were able to eliminate the illegal restriction sites from norm and most importantly the rib-cluster and had them already available in pSB1C3.
- We followed up our positive digestion results with a precautionary sequencing, which proofed the correct form of the BioBricks norM (<bbpart>BBa_K1172301</bbpart>), rib (<bbpart>BBa_K1172303</bbpart>)and although ribC (<bbpart>BBa_K1172302</bbpart>).
- Once again we abandoned parts on our way to riboflavin overexpression in E. coli. The first was norM. The sodium antiporter has enough homologues in E. coli. The second part left on the side was ribC. We resigned on equipping it with promoters. When ribC was taken in by microbial ancestors through horizontal gene transfer, it overtook the job of SO_3468 (which is located in the rib-cluster). Nevertheless, SO_3468 and ribC still share the same function, encode for the same protein and, as SO_3468 lies in the middle of an active operon, we assumed that we might be able to restore its functionality.
- The most promising BioBrick <bbpart>BBa_K1172303</bbpart> (rib) was then provided with a set of three different promoters:
- <bbpart>BBa_K608002</bbpart> (strong Andersen promoter and strong RBS) aka And77
- <bbpart>BBa_K608006</bbpart> (medium Anderson promoter and weak RBS) aka And33
- <bbpart>BBa_K525998</bbpart> (T7 Promoter and strong RBS)
- These promoters can be found in the Distribution Kit and are already located in pSB1C3. Therefore they are perfectly suitable for suffix insertion. Isolation of Anderson Promoters
- The rib BioBrick (<bbpart>BBa_K1172303</bbpart>) was digested with XbaI and PstI for 1.5 h at 37°C followed up by an inactivation step at 80°C for 20 min. Naturally, we than had to extract the insert from a gel and to clean it up.
- The ligation mix looked like the following:

Figure 13: Digestion of multiple plasmid minipreps using Xba1 and Pst1 by NEB.
- We transformed the mix three times according to our standard protocol. Two days later we could execute a plasmid isolation and a test-digestion with PstI. Figure 13 confirms the creation of three new devices:
- <bbpart>BBa_K608002</bbpart> + <bbpart>BBa_K1172303</bbpart> = <bbpart>BBa_K1172306</bbpart>
- <bbpart>BBa_K608006</bbpart> + <bbpart>BBa_K1172303</bbpart> = <bbpart>BBa_K1172305</bbpart>
- <bbpart>BBa_K525998</bbpart> + <bbpart>BBa_K1172303</bbpart> = <bbpart>BBa_K1172304</bbpart>

Figure 14: Test-digestion with Pst1 from NEB, to confirm that we have equipped the rib-cluster with three different promoters.
Cytochromes
- Attempted another Gibson assembly with psB1C3 and the three mtrCAB fragments. The inserts were added equimolar and in a 3-fold excess to the vector.
| psB1C3 | 4-0609-301 | 110 ng/ul | 0.6 µl | 66 ng |
| Fragment1 | 4-2608-302 | 48.8 ng/µl | 3.1 µl | 151 ng |
| Fragment2 | 4-2008-304 | 68.3 ng/µl | 0.4 µl | 27 ng |
| Fragment3 | 4-0509-301 | 285 ng/µl | 0.9 µl | 256 ng |
- Various cells of the transformation were transferred to new plates and incubated again.
- Subsequently plasmids were isolated from this cultures and a restriction analysis with the enzymes EcoRI and PstI and a total amount of 500 ng isolated plasmid DNA was performed.
- The resulting fragment should be the respective insert mtrCAB with a size of approx. 5.1 kb. The Results are shown in Figure 15 below. The correct sample is located in lane 12.

Figure 15: Results of a PAGE of the restriction on the alleged BioBrick psB1C3::mtrCAB; Expected Size: 5.1 kb; Enzymes: EcoRI, PstI; Ladder:Thermo Scientific GeneRuler™ 1 kb DNA Ladder.
- An aliquot of the plasmid DNA was used for sequencing.
- The corresponding results verify the correct insertion of the mtrCAB cluster into the psB1C3 backbone.
- Another Gibson assembly was attempted with the ccmAH cluster. The insert was added in a 3-old excess to the vector.
- The transformation was initially analyzed via c-lysis to get a rough idea of the sizes of the plasmids and rule out re-ligated vectors. Interesting colony would be further analyzed via colony PCR or enzyme digest.
- One c-lysis is shown in Figure 16. Only lane 18 shows a plasmid, which is unfortunately significantly shorter than the reference pSB1C3::mtrCAB and is therefore not correct.

Figure 16: Results of a PAGE of a c-lysis on the colonies possibly transformed with pSB1C3::mtrCAB; Expected Size:8.4 kb; Referenz: pSB1C3::mtrCAB, 7.2 kb
Biosafety
- We isolated the plasmids which we have transformed into KRX cells days before. We also transformed the BioBricks <bbpart>BBa_R0010</bbpart> (lacI regulated promoter) and <bbpart>BBa_K741002</bbpart> (plac with RBS+GFP+terminators) and measured their DNA concentration:
- Alr_1: 214.2 ng/µL
- Alr_2: 203.6 ng/µL
- Alr_3: 301.3 ng/µL
- BBa_R0010: 121.7 ng/µL
- BBa_R0010: 136.0 ng/µL
- BBa_K741002: 145.9 ng/µL
- BBa_K741002: 175.1 ng/µL
- We deleted GFP out of the pBAD device for preparing to replace the RNase by cutting and insertion with the correlated restriction enzymes.
- PCR, purification and transformation in KRX:
- RNase Ba fwd_rev 1: 79.2 ng/µL
- RNase Ba fwd_rev 2: 85.9 ng/µL
- Ptac fwd_rev 1: 74.4 ng/µL
- Ptac fwd_rev 2: 69.8 ng/µL
- RNase_pBAD (GFP_del) 68.4 ng/µL
- Ptac_alr_pre_suf 1: 33.4 ng/µL
- Ptac_alr_pre_suf 2: 41.0 ng/µL
- We isolated more plasmids out of KRX competente cells. The new BBa were previously transformed into competent cells.
- Ptac_alr (9-89-451) 190.8 ng/µL
- Ptac_alr (9-89-452) 212.8 ng/µL
- Ptac_alr (9-89-453) 117.9 ng/µL
- Ptac_alr (9-89-454) 107.3 ng/µL
- RNase Ba (9-89-455) 101.0 ng/µL
- RNase Ba (9-89-456) 82.5 ng/µL
- pBAD_RNase Ba (9-89-4567 177.9 ng/µL
- pBAD_RNase Ba (9-89-458) 151.9 ng/µL
- pBAD_RNase Ba (9-89-459) 89.2 ng/µL
- pBAD_RNase Ba (9-89-460) 83.5 ng/µL
- BBa_I13504 (9-89-461) 152.3 ng/µL
- BBa_I13504 (9-89-462) 159.4 ng/µL
- BBa_R0040 (9-89-463) 125.7 ng/µL
- BBa_R0040 (9-89-464) 129.6 ng/µL
- BBa_R0040 (9-89-465) 105.5 ng/µL
- K1172001 alr (9-89-466) 169.8 ng/µL
- K1172001 alr (9-89-467) 156.0 ng/µL
- K1172001 alr (9-89-468) 163.7 ng/µL
- K1172001 alr (9-89-468) 135.8 ng/µL
- BBa_C0040_3 250.2 ng/µL (9-108-451)
- BBa_C0040_4 124.5 ng/µL (9-108-452)
- Ptac_alr1 115.8 ng/µL (9-108-453)
- Ptac_alr5 68.1 ng/µL (9-108-454)
- Ptac_alr6 163.6 ng/µL (9-108-455)
- RNase Ba3 86.6 ng/µL (9-108-456)
After the isolation and measuring we checked if the right insert is in the vector, so we did restriction analysis with EcoR1+ Pst1 and Barnase+pSB1C3 only with EcoR1. The results are listened below:


Porines
- SDS-PAGE with improved protein isolation of outer membrane porin oprF by release of periplasmic protein fraction from E. coli by cold osmotic shock using Cell fractionating buffer 2.2. There is a slight overexpression band for E.coli with T7 promoter (<bbpart>BBa_K1172502</bbpart>) at the expected size of OprF (36 kDa). But the gel is a little bit overloaded with protein. Maybe the SDS concentration in Cell fractionating buffer 2.2 was elected with 2 % too high, which has led to partial cell lysis and total protein extraction.

Figure 17: SDS-PAGE with Prestained Protein Ladder from Thermo Scientific as marker. Comparison of protein expression between Escherichia coli KRX wild type and Escherichia coli KRX with <bbpart>BBa_K1172502</bbpart>, <bbpart>BBa_K1172503</bbpart> and <bbpart>BBa_K1172507</bbpart> after periplasmic protein fractioning with Cell fractioning buffer 2.2.
- Further improving of cell fractioning for protein isolation of outer membrane porin oprF by release of periplasmic protein fraction from E. coli by cold osmotic shock using Cell fractionating buffer 2.3.

Figure 18: SDS-PAGE with Prestained Protein Ladder from Thermo Scientific as marker. Comparison of protein expression between Escherichia coli KRX wild type and Escherichia coli KRX with <bbpart>BBa_K1172502</bbpart>, <bbpart>BBa_K1172503</bbpart> and <bbpart>BBa_K1172507</bbpart> after periplasmic protein fractioning with Cell fractioning buffer 2.3.
- The SDS-PAGE shows a significantly higher protein concentration for E.coli with oprF and T7 promoter (<bbpart>BBa_K1172502</bbpart>). It seems to be that the higher membrane permeability allows a better release of membrane proteins by 0.2 % SDS. Nevertheless, we can see a strong band at the expected OprF size of about 36 kDa for <bbpart>BBa_K1172502</bbpart>, which is equated with a strong expression and overproduction of OprF.
- Overexpressed outer membrane porin (Figure. 18) should be examined by MALDI-TOF MS/MS.
- Tryptic digest of gel lanes for analysis with MALDI-TOF.
- Outer membrane porine was examined by MALDI-TOF MS/MS with a Mascot Score of 222 against bacteria database.
Week 20
Organization
- iGEM-Team Bielefeld 2013 T-shirts and hoodies were designed and are in production. Orange shirts with a great Ecolectricity logo. We are pleased to wear them in Lyon.
- As announced, we have participated at the conference '60 Years of DNA’ in Berlin at 14. September and received good reviews for our project.
- We carried out the characterization measurements for the collaboration with the UC-Davis iGEM team
- as a part of this, we cultivated E. coli DH5α for 18 hours, while measuring absorbance and fluorescence
MFC
- Replaced copper wiring in the fuel cell with platinum, because copper tended to corrode very fast.
- Received the print of the final DIY 3D-print fuel cell from the faculty of physics.
- Conducted experiments to assess which kinds of plastic and Polysiloxane are compatible to our e. coli
Mediators
- Glycerol dehydrogenase
- Glycerol dependent NADH-Assay with Escherichia coli KRX wild type strain and E. coli KRX with pSB1C3 and <bbpart>BBa_K1172203</bbpart> by testing supplementation of different glycerol concentrations to the LB-medium.

Table 6: Experimental design of the glycerol dependent NADH-Assay. Supplementation of different amounts of glycerol to LB-medium should show the effect of glycerol on NADH overproduction.

Table 7: Results of the NADH-Assay. Comparison between Escherichia coli KRX wild type and Escherichia coli KRX with <bbpart>BBa_K1172203</bbpart> supplemented with different amounts of glycerol to LB-medium. NADH concentration with standard deviation and concentration in comparison to the wild type is shown.
- NADH-Assay shows a quiet good NADH overproduction for <bbpart>BBa_K1172203</bbpart> with increasing glycerol concentration.

Figure 19: Column Chart with results of the NADH-Assay. Comparison between Escherichia coli KRX wild type and Escherichia coli KRX with <bbpart>BBa_K1172203</bbpart> supplemented with different amounts of glycerol to LB-medium. NADH concentration with standard deviation and concentration in comparison to the wild type is shown.
- Riboflavin
- After we had turned the rib-cluster into a BioBrick and equipped it with different Promoters we could now start with the characterization of BBa_K1172304 BBa_K1172305 BBa_K1172306.
We started with several overnight cultures. We wanted to cultivate our three devices in E. coli growing in LB-medium and M9-medium. The next day we inoculated our cultures. After three hours the T7-strain had reached an OD600 of 0,9 and we induced the T7 promoter with rhamnose 200g/ml. We wanted to determine the amount of riboflavin produced at the endpoint. After harvesting our cells we centrifugated them 5 min at 5000 rpm and decanted the supernatant in a fresh eppendorf tube. The pellet was then resuspended in 1 ml 1xPBS buffer and transferred to an 2 ml savelock tube with glass beads. We ribolyzed the cells three times for thirty seconds. Between the ribolyzing intervals we put the samples on ice. Afterwards the disrupted cell were centrifuged at 4 C° for 20 min at the highest possible speed. - Unfortunately, the following attempt to verify riboflavin in our samples through measurement of absorbance failed. Despite the slight yellowish colour that could already been seen in the non-wild type cultures.
- After we had turned the rib-cluster into a BioBrick and equipped it with different Promoters we could now start with the characterization of BBa_K1172304 BBa_K1172305 BBa_K1172306.
- We were given the chance to measure some of our samples in a LC/MS. We made fresh cultures and prepared the samples a we were told.
- We sterile filtrated the supernatant samples.
- The cell interior probes had to be handled carefully. Directly after centrifugation (5000 rpm, 5 min) we freezed the pellets in liquid N2. The next step had to be carried out very fast. Into the tube with the pelleted cells we gave some glass beads and 1 ml of 80% methanol. The cells were then disrupted in a ribolyzer (3 x 60 sec at 6,5). About 700 µl were transferred to another tube which were then gassed with N2 until the Methanol has evaporated. The remaining oily lag was resuspended in dH2O and transferred to a HPLC-vial.
- Nevertheless, the results were negative.
- We performed two SDS-PAGE´s according to our standard protocol to verify if any protein from the rib-cluster had been overexpressed. Therefore we harvested 2 ml and 4 ml respectively of six different cultures.
The diversification of the bands, especially in the lower part of the gel, where we expected to see the most overexpressed protein was not good enough in an 12% separating gel.
- We performed two SDS-PAGE´s according to our standard protocol to verify if any protein from the rib-cluster had been overexpressed. Therefore we harvested 2 ml and 4 ml respectively of six different cultures.
Cytochromes
- The mtrCAB cluster was cut out the psB1C3 backbone and ligated into three existing Biobricks via suffix insertion. The corresponding parts are promoters and ribosome binding sites of varying strength.
- <bbpart>BBa_K608006</bbpart> Anderson 0.33 + weak RBS
- <bbpart>BBa_K608002</bbpart> Anderson 0.77 + strong RBS
- <bbpart>BBa_K525998</bbpart> T7 + strong RBS
- The digestion with the featured the enzymes XbaI and PstI
- A total of 640ng DNA was used.
- Usage of CutSmart Buffer, XbaI and PstI HF to ensure 100% activity
- The vectors were digested accordingly and dephosphorylated on 31.08. They were once again checked by PAGE, which is shown in Figure 20 and yields a positiv result. All three match the expected size.

Figure 20: Results of a PAGE of the digested and dephosphorylated expression vectors <bbpart>BBa_K608006</bbpart>, <bbpart>BBa_K608002</bbpart> and <bbpart>BBa_K525998</bbpart>; Expected Size: 2.1kb; Enzymes: EcoRI, SpeI; Ladder:Thermo Scientific GeneRuler™ 1 kb DNA Ladder.
- The correct insert was later extracted from the gel and concentrated via lyophilisation.
- 4-1209-304....44ng/ul
- 4-1209-305....32ng/ul
- 4-1209-306....26ng/ul
- The following ligation was performed with two different protocols. One suggesting the usage of 50ng vector and a 3-fold excess of the insert in a total reaction volume of 20ul, the other the usage of 10ng vector and a 6-fold excess of the insert in a total reaction volume of 10ul.
- K608006::mtrCAB 20ul
- K608002::mtrCAB 20ul
- K525998::mtrCAB 20ul
- K608006::mtrCAB 10ul
- K608002::mtrCAB 10ul
- K525998::mtrCAB 10ul
| Part | Vector | Insert | Volume |
|---|---|---|---|
| K608006::mtrCAB | 50ng | 374ng | 20ul |
| K608002::mtrCAB | 50ng | 374ng | 20ul |
| K525998::mtrCAB | 50ng | 374ng | 20ul |
| K608006::mtrCAB | 10ng | 150ng | 10ul |
| K608002::mtrCAB | 10ng | 150ng | 10ul |
| K525998::mtrCAB | 10ng | 150ng | 10ul |
- Notes: Interestingly the ligations with only 10ng vector and 6-fold excess of the insert seemed to be more effecient, since they yield significantly more colonies.
- The succesfull ligation was confirmed via restriction analysis. The isolated plasmids from the aforementioned transformations were digested with the enzyme EcoRI, which should linearised them and generate a 7.2kb fragment. The Results are shown in Figure 21 and verify the correct ligation, leading to the following succesfully constructed devices:
- <bbpart>BBa_K1172403</bbpart>: mtrCAB cluster with Anderson 0.33 and weak rbs
- <bbpart>BBa_K1172404</bbpart>: mtrCAB cluster with Anderson 0.77 and strong rbs
- <bbpart>BBa_K1172405</bbpart>: mtrCAB cluster with T7 and strong rbs

Figure 21: Results of a PAGE of the digested <bbpart>BBa_K1172403</bbpart>, <bbpart>BBa_K1172404</bbpart> and <bbpart>BBa_K1172405</bbpart>; Expected Size: 7.2kb; Enzymes: EcoRI; Ladder:Thermo Scientific GeneRuler™ 1 kb DNA Ladder.
- Subsequently glycerol stocks were made from the ligations and the further characterisation was started.
Biosafety
- We transformed the tetracyclin repressor into KRX via electroporation for plasmid isolation. After this we isolated the plasmids and other plasmids which are listend below.
- BBa_C0040_3 250,2 ng/µL (9-108-451)
- BBa_C0040_4 124,5 ng/µL (9-108-452)
- Ptac_alr1 115,8 ng/µL (9-108-453)
- Ptac_alr5 68,1 ng/µL (9-108-454)
- Ptac_alr6 163,6 ng/µL (9-108-455)
- DNase Ba3 86,6 ng/µL (9-108-456)

- We did purification of the restriction and measured the dna concentration via nanodrop:
- BBa_C0040 TetO: 35,0 ng/µL
- B0015 Terminator 22,1 ng/µL
- GFP 4,4 ng/µL
- Alr 8,7 ng/µL
- After we isolated the different plasmids we assembled the alanine racemase with the terminator (<bbpart>BBa_K1172003</bbpart>), TetO with GFP (<bbpart>BBa_K1172014</bbpart>) lacI+terminator. We transformed them into competent cells and did plasmid isolation.
- LacI (C0012) 86,5 ng/µL (9-129-451)
- Terminator (B0015) 95,4 ng/µL (9-129-452)
- Terminator (B0015) 46,1 ng/µL (9-129-453)
- Alr_Terminator 84,6 ng/µL (9-129-454)
- Alr_Terminator 65,5 ng/µL (9-129-455)
- Alr_Terminator 33,4 ng/µL (9-129-456)
- Alr_Terminator 98,2 ng/µL (9-129-457)
- TetO_GFP 102,6 ng/µL (9-129-458)
- TetO_GFP 77,1 ng/µL (9-129-459)
- TetO_GFP 91,8 ng/µL (9-129-460)
- After the plasmid isolation we checked with a restriction analysis with EcoR1 and Pst1 if the correct inserts are in the vectors. The results are schown below.

- We send them for sequence analysis to the sequencing service. The results confirmed our constructs.
- We did a PCR to get araC. It was done by executing the phusion protocoll and recipe. The results are listened below:

- After cheking the PCR result we purified the samples with the PCR clean up Kit and measured the DNA concentration.:
- araC 12a 58,8 ng/µL (9-129-463)
- araC 12b 84,1 ng/µL (9-129-464)
- We did PCR with Tetracylin repressor purificated the samples and did gelelectrophoresis:

- We assembled the three front constructs of our biosafety system via Gibson Assembly:
- BSVaraC
- 1,5 µL pRha (BBa_K914003)
- 2,3 µL alr_terminator (BBa_K1172003)
- 1,5 µL araC
- BSVTetR
- 1,5 µL pRha (BBa_K914003)
- 2,3 µL alr_terminator (BBa_K1172003)
- 1,5 µL TetR (BBa_C0040)
- BSVlacI
- 1,0 µL pRha (BBa_K914003)
- 7,0 µL lacI (BBa_C0012)
- 0,7 µL alr_terminator
- We had assembled TetO with GFP before. pBAD with GFP and plac with GFP were already in the parts registry.
- Back constructs:
- BSVaraC
- pBAD+GFP
- BSVaraC
- BSVTetR
- TetO+GFP
- BSVTetR
- BSVlacI
- plac+GFP
- BSVlacI
Week 21
Organization
- Final spurt before european jamboree 2013
- Finishing the last experiments and starting with hard work on our wiki.
MFC
- Received the plastic parts for our 3rd generation fuel cell and put it together.
- Conducted more experiments to assess which kinds of plastic and Polysiloxane are compatible to our e. coli
- Used third generation MFC to record power output of e. coli strains modified with our different biobricks.
Mediators
- Glycerol dehydrogenase
- Glycerol dependent NADH-Assay with Escherichia coli KRX wild type strain and E. coli KRX with pSB1C3 and <bbpart>BBa_K1172203</bbpart> by testing different glycerol concentrations of M9-medium.

Table 8: Experimental design of the glycerol dependent NADH-Assay. Different concentrations of glycerol in M9-medium should show the effect of glycerol on NADH overproduction.

Table 9: Results of the NADH-Assay. Comparison between Escherichia coli KRX wild type and Escherichia coli KRX with <bbpart>BBa_K1172203</bbpart> grown in M9-medium with different concentrations of glycerol. NADH concentration with standard deviation and concentration in comparison to the wild type is shown for cell disruption and supernatant fraction.
- NADH-Assay shows an increasing intra- and extracellular NADH concentration for <bbpart>BBa_K1172203</bbpart> with increasing glycerol concentration in M9-medium.

Figure 22: Column Chart with results of the NADH-Assay. Comparison between Escherichia coli KRX wild type and Escherichia coli KRX with <bbpart>BBa_K1172203</bbpart> grown in M9-medium with different concentrations of glycerol. NADH concentration with standard deviation and concentration in comparison to the wild type is shown for cell disruption (Intracellular) and supernatant (Extracellular) fraction.
- Riboflavin
- We performed a third, fourth and fifth SDS-PAGE. This time we used a 20% separating gel. We aimed at the separation of proteins with a low molecular weight because the rib-cluster consists of four genes that code for five proteins of which four lay in the range of 16 kDa till 23 kDa.

Table 10: Composition of SDS-PAGE separating gels used for the verification of proteins from the rib-cluster.
- It is obvious that a protein with a molecular weight of approximately 15 kDa was overexpressed by our riboflavin strains (see Figure 23). We cut out the band of the T7-induced strain and handed it out to Vera. She is allowed to perform MALDI´s and was friendly enough to help us out.

Figure 23: SDS-PAGE with 20% separating gel for the verification of proteins from the rib-cluster. From left to right: Thermo PageRuler 150 kDa prestained ladder; E. coli KRX wild type 1; E.coli KRX wild type 2; rib-T7 uninduced; rib-T7 induced; rib-medium-Anderson33; rib-strong-Anderson77
- In the middle of the week, it became clear that the M9 medium we had used the last one and a half week had a negative effect on riboflavin production in our recombinant strain. While working on the MFC subproject Matthias produced another M9 medium with different trace solutions (e.g.: a different iron-salt). In this medium, our riboflavin strain produced high amounts of riboflavin that were clearly visible as yellow colour.
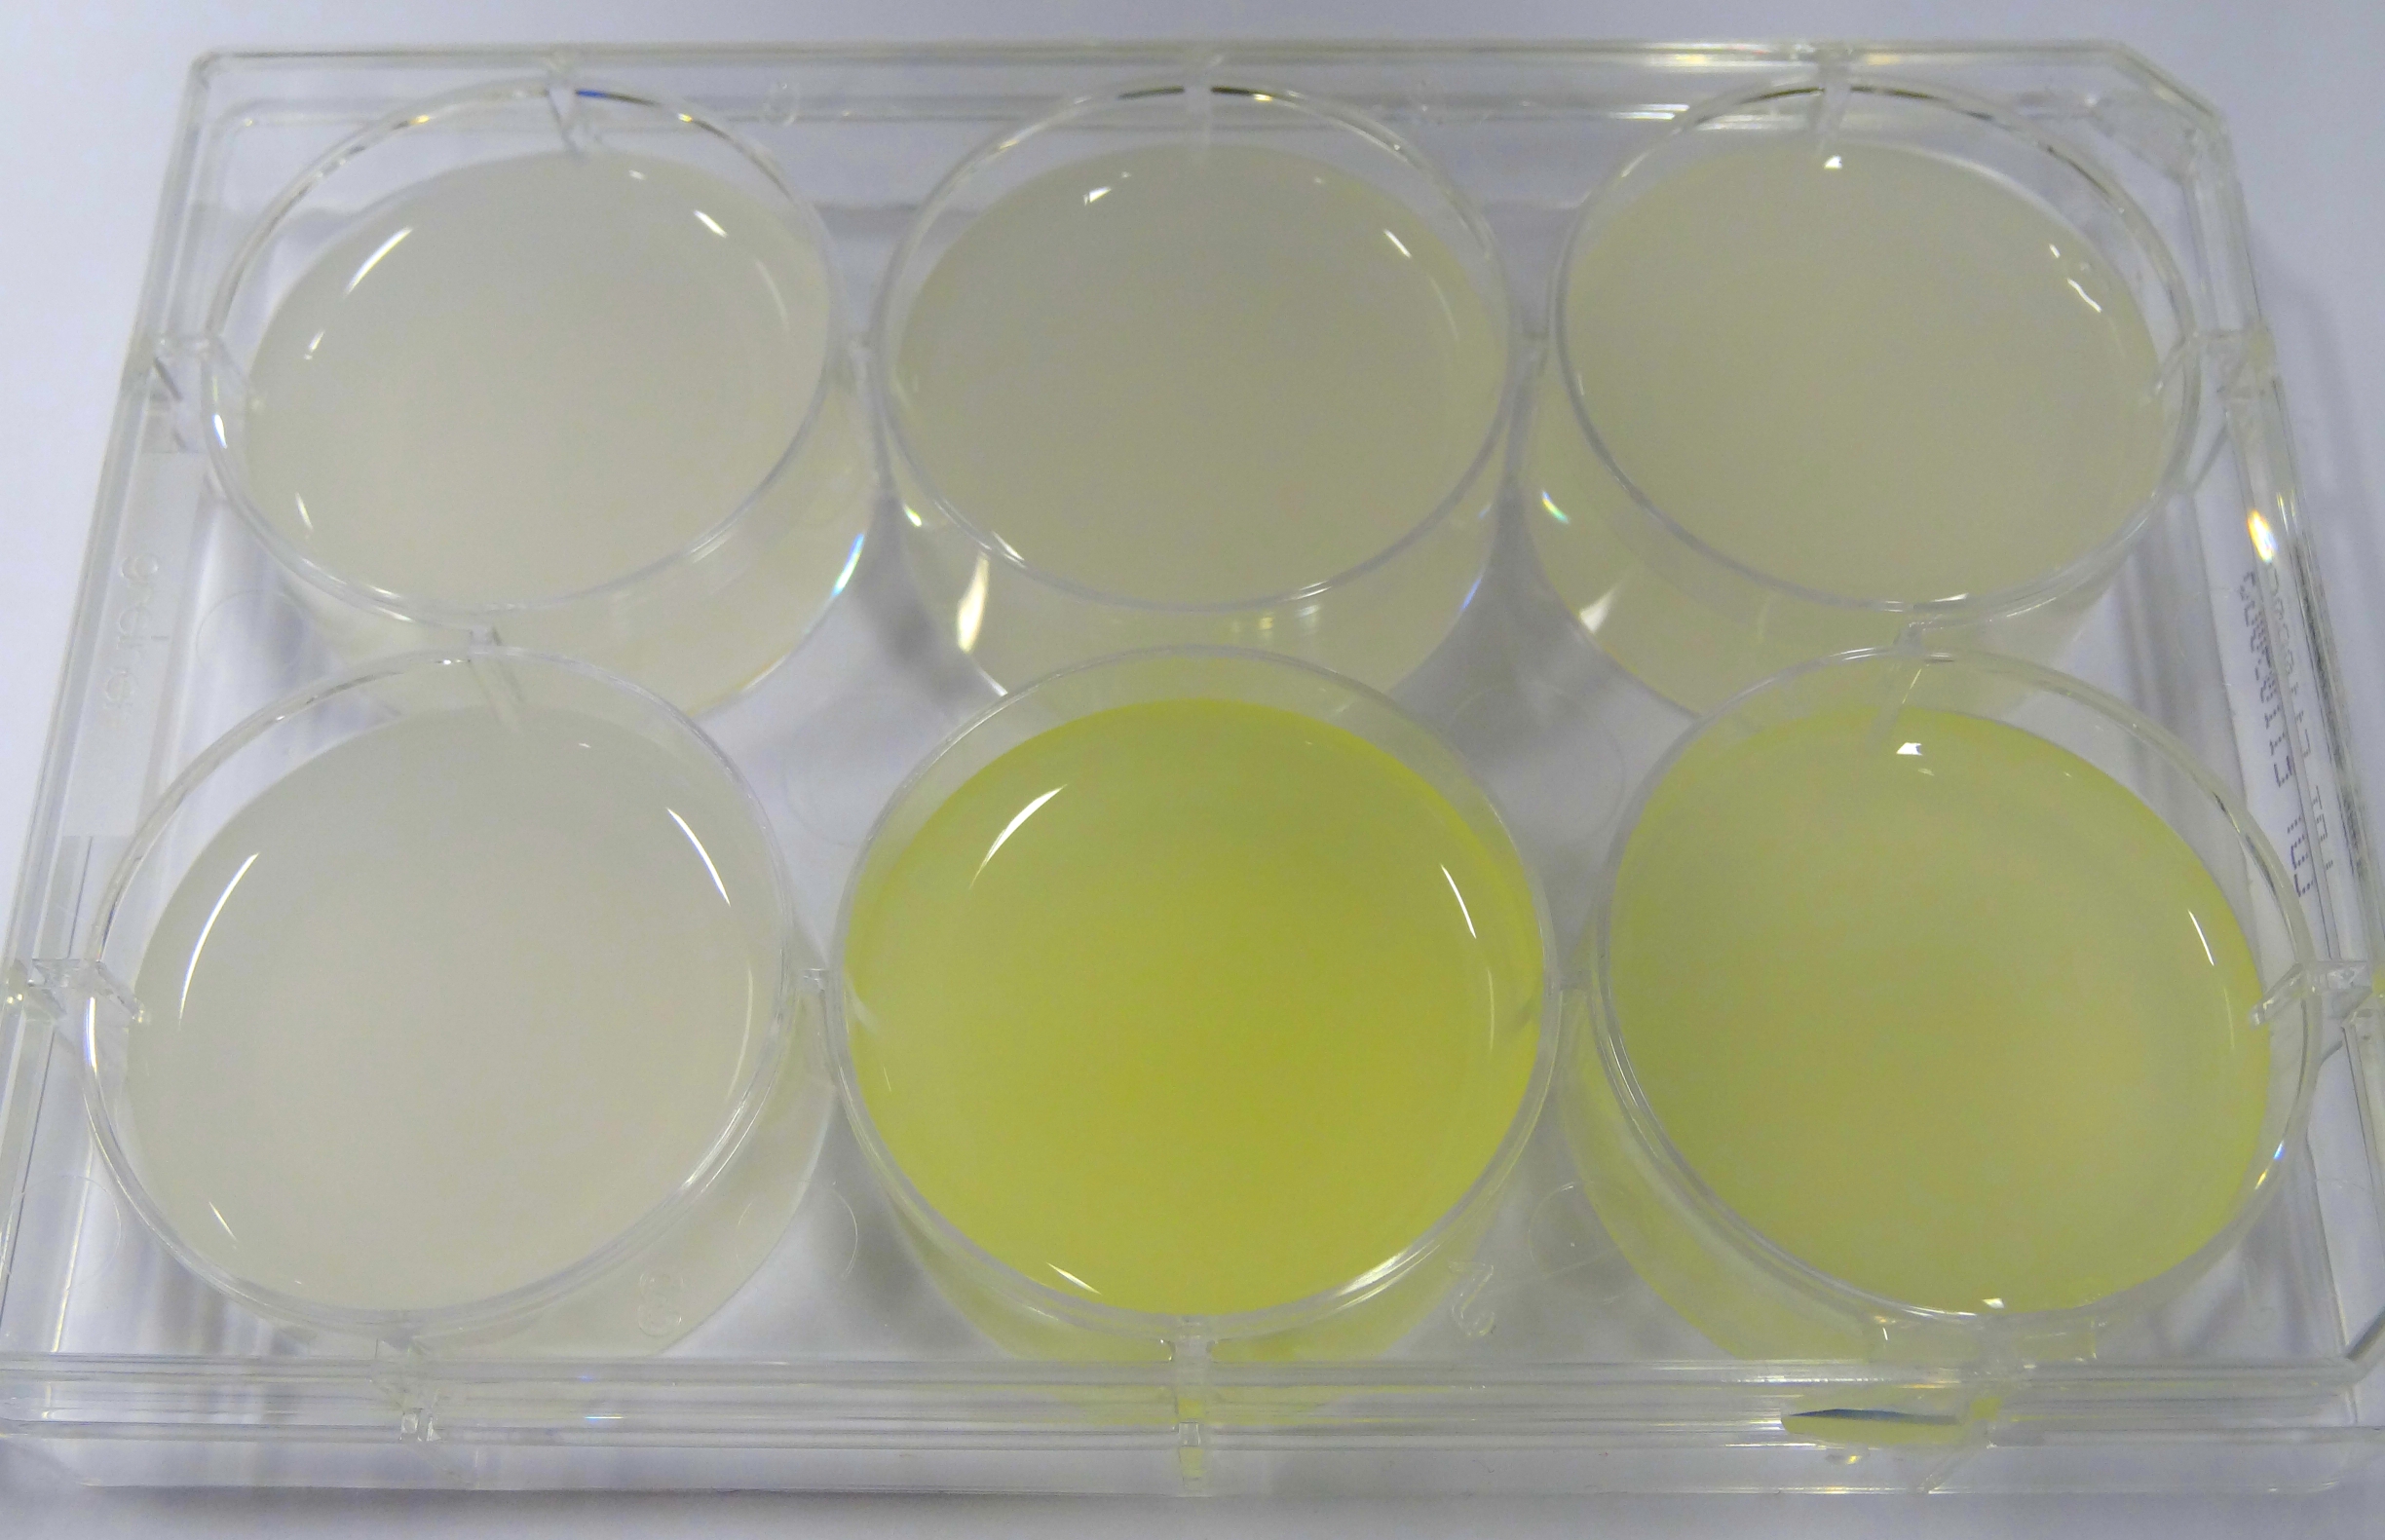

Figure 24: Comparison of colour change in riboflavin strains. Left: E. coli KRX wild type; Middle top: Ribo-strain with strong Anderson-promoter (And77) in wrong M9-medium; Middle below: same strain in good M9; Right top: Ribo-strain with medium Anderson-promoter (And33) in wrong M9; Right below: same strain in good M9
We are calling this good M9 medium, which is favorable for riboflavin production: M9-D5. - We used a culture of E.coli KRX grown in M9-D5, which carried pSB1C3 with the rib-cluster and a strong Anderson Promoter (And 77) with strong RBS (<bbpart>BBa_K1172306</bbpart>) to qualitative proof the appearance of riboflavin in supernatant.
- In the middle of the week, it became clear that the M9 medium we had used the last one and a half week had a negative effect on riboflavin production in our recombinant strain. While working on the MFC subproject Matthias produced another M9 medium with different trace solutions (e.g.: a different iron-salt). In this medium, our riboflavin strain produced high amounts of riboflavin that were clearly visible as yellow colour.

- We measured the absorbance at 446 nm of the M9-D5 supernatant in which E. coli KRX with BBa_K1172306 had grown for 72 hours and cell disruption samples of these cultures against wild type supernatant and cell disruptions who had also grown for 72 hours. We also measured a dilution series of riboflavin in known concentrations.

Table 11: Pipetting scheme and measurement results of riboflavin standards and cell samples for absorbance measurement at 446 nm in the Tecan Infinite® M200 platereader. WT = wild type, And77 = E. coli equipped with BBa_K1172306, sn = supernatant, cd = cell disruption.
- First of all, this clearly showed that the amount of riboflavin produced by our riboflavin production strain was significantly higher than in the wild type. Furthermore, on the basis of the known riboflavin concentrations we were able to generate a calibration line:
- Y = 4839.6*X – 0,0462
- This allowed us to evaluate the amount of riboflavin in the supernatant and the cell disruption samples (engineered riboflavin-producing srtain).
- Supernatant: 5773.3 µg / L
- Cell disruption: 6112.63 µg /L
- Compared to these values, the amount of riboflavin in E.coli KRX wild type was not detectable.
Cytochromes
- For characterisation of the mtrCAB cluster in with the three different promoters <bbpart>BBa_K1172403</bbpart>, <bbpart>BBa_K1172404</bbpart> and <bbpart>BBa_K1172405</bbpart>,the latter induced and uninduced were cultivated anaerob to ensure the the expression of the ccmAH cluster.
- Subsequently the periplasmic and membrane protein fraction from E. coli was released by cold osmotic shock
- Samples from each fraction were analyzed by SDS-PAGE.
- The resulting gel did not show a significant difference between the samples and the control
- Furthermore a cytochrome type c redox activity assay for the different fractionations was carried out.
- The absorbance was measured at wavelength between 350 and 650nm.
- The oxidized cytochromes were expected to have peaks at 410nm and 530nm.
- The 410nm peak could be measured around 400nm
- The reduced ones should show a shift to 420nm and 552 nm, respectively.
- No significant peak could be measured in this area.
Biosafety
- One day before we pre cultured our bacteria in 5mM D-alanine and 80mM glycerin medium. After growing we took 10mL of each pre culture and centrifuged the cells for 3 minutes by 6000xg, discarded the supernatant and resuspended the cells in 4mL distilled water. We washed the cells three times. We executed the characterization of araC by cultivation (200rpm) in shaking flasks with different carbon sources. We cultivated the different biosafety systems for measuring how the specific product building rate looks like in M9 mediumwith different carbon sources. As mentioned before, we used GFP instead of Barnase for characterisation. We sampled in regulary intervals to measure the absorbance and the fluorescence.


