"
"
Team:Grenoble-EMSE-LSU/Project/Modelling/Building
From 2013.igem.org
(Difference between revisions)
| (32 intermediate revisions not shown) | |||
| Line 31: | Line 31: | ||
<br> | <br> | ||
| - | <p>The construction of our model was not | + | <p>The construction of our model was not a linear process: quite a few models were built, tried then abandoned. The aim was to find an explanation as simple as possible of the results of our experiments. This meant designing equations describing the behaviour of our bacterial cells with as few parameters as possible. Thus our equations consider the <a href=#MatTime>maturation of fluorescent proteins</a> and the <a href=#AccDam>ability of the bacteria to repair themselves</a>.</p> |
</li> | </li> | ||
<li> | <li> | ||
<h2>Initial Model</h2> | <h2>Initial Model</h2> | ||
| - | <h3>The equation</h3> | + | <h3 id="equation1">The equation</h3> |
| - | <p> Our system is made of bacterial cells and ‘KillerRed’ proteins. Bacteria divide and produce KillerRed proteins, and KillerRed proteins respond to light: they fluoresce, degrade (photobleaching) and produce Radical Oxygen Species or ROS (phototoxicity). These reactions are exhibited by all fluorescent proteins, but <a href="/Team:Grenoble-EMSE-LSU/Project/Biology">the 3D structure of KillerRed</a> | + | <p> Our system is made of bacterial cells and ‘KillerRed’ proteins. Bacteria divide and produce KillerRed proteins, and KillerRed proteins respond to light: they fluoresce, degrade (photobleaching) and produce Radical Oxygen Species or ROS (phototoxicity). These reactions are exhibited by all fluorescent proteins, but <a href="/Team:Grenoble-EMSE-LSU/Project/Biology">the 3D structure of KillerRed</a> is responsible for a ROS production 1000-fold greater than that of other fluorescent proteins.</p> |
<br> | <br> | ||
| Line 44: | Line 44: | ||
<p>$\bullet$ $I$ the amount of incident (white) light.</p> | <p>$\bullet$ $I$ the amount of incident (white) light.</p> | ||
<br> | <br> | ||
| - | <p>The evolution of C and K is linked to I by the set of equations : </p> | + | <p>The evolution of C and K is linked to I by the set of equations :<br></p> |
<center style="font-size:150%;"> | <center style="font-size:150%;"> | ||
| Line 59: | Line 59: | ||
</center> | </center> | ||
| - | <p>$\diamond$ $rC$ describes bacterial growth.</p> | + | <p><br>$\diamond$ $rC$ describes bacterial growth.</p> |
<p>$\diamond$ $kIK=kI\frac{K}{C}C$ the amount of bacteria killed by KillerRed and light.</p> | <p>$\diamond$ $kIK=kI\frac{K}{C}C$ the amount of bacteria killed by KillerRed and light.</p> | ||
<p>$\diamond$ $aC$ the production of KillerRed.</p> | <p>$\diamond$ $aC$ the production of KillerRed.</p> | ||
<p>$\diamond$ $bIK$ the amount of KillerRed photobleached.</p> | <p>$\diamond$ $bIK$ the amount of KillerRed photobleached.</p> | ||
<p>$\diamond$ $kIK\frac{K}{C}$ the amount of KillerRed in the bacteria killed in the final time step.</p> | <p>$\diamond$ $kIK\frac{K}{C}$ the amount of KillerRed in the bacteria killed in the final time step.</p> | ||
| - | <p>$r$, $a$, $k$ and $b$ are constants that | + | <p>$r$, $a$, $k$ and $b$ are constants that are described <a href=#param1>a bit lower</a>.</p> |
<br> | <br> | ||
<p> Unfortunately, $C$ and $K$ are not measurable variables. The only quantities we can quickly and easily measure are the optical density (OD) associated the amount of dead AND living bacteria, and the global fluoresence associated with the amount of KillerRed in the dead AND living bacteria. In order to compare our model with experimental results, we need two additional variables : </p> | <p> Unfortunately, $C$ and $K$ are not measurable variables. The only quantities we can quickly and easily measure are the optical density (OD) associated the amount of dead AND living bacteria, and the global fluoresence associated with the amount of KillerRed in the dead AND living bacteria. In order to compare our model with experimental results, we need two additional variables : </p> | ||
<br> | <br> | ||
| - | <p>$\bullet$ $D$ the amount of <b>dead</b> bacteria per | + | <p>$\bullet$ $D$ the amount of <b>dead</b> bacteria per milliliter of cell suspension. We consider that dead bacteria have the same Optical Density as living ones, because ROS damage does not lyse the cell. </p> |
| - | <p>$\bullet$ $K_D$ the amount of KillerRed inside the <b>dead</b> bacteria per | + | <p>$\bullet$ $K_D$ the amount of KillerRed inside the <b>dead</b> bacteria per milliliter of cell suspension.</p> |
| Line 86: | Line 86: | ||
<br> | <br> | ||
| - | <p> $D$ and $K_D$ are necessary for the model, because they appear in the measurement | + | <p> $D$ and $K_D$ are necessary for the model, because they appear in the measurement of $OD_{600}$ and fluorescence, but dead bacteria don't grow anymore, and a KillerRed protein that is in a dead bacteria has no more effect on the $OD_{600}$ evolution. </p> |
<br> | <br> | ||
| - | <p> The simplest possible units were used, | + | <p> The simplest possible units were used, corresponding to the measurable quantities : </p> |
| - | <p> $C$ and $D$ are in '$ | + | <p> $C$ and $D$ are in '$OD_{600}nm$' units.</p> |
| - | <p> $K$ and $K_D$ are in | + | <p> $K$ and $K_D$ are in Relative Fluorescent Unit (RFU). Bacterial auto-fluorescence is considered negligible compared to KillerRed fluorescence. </p> |
| + | <br> | ||
| + | <p id="param1"> 4 parameters appear in those equations:</p> | ||
| + | <p> $r$: the rate of growth of bacteria in $min^{-1}$</p> | ||
| + | <p> $a$: the production of KillerRed per bacteria in $RFU.OD^{-1}.min^{-1}$</p> | ||
| + | <p> $b$: the efficiency of photobleaching in $RFU.UL^{-1}.min^{-1}$</p> | ||
| + | <p> $k$: the toxicity of KillerRed in $OD.RFU^{-1}.UL^{-1}.min^{-1}$</p> | ||
| + | <br id="linGrowth"> | ||
| + | <br> | ||
| + | <p > The evolution of the absorbance ($C+D$) and the global fluorescence ($K+K_D$) can also be written:</p> | ||
| + | <center style="font-size:150%;"> | ||
| + | |||
| + | $ | ||
| + | \left\{ | ||
| + | \begin{array}{l l} | ||
| + | \frac{d(C+D)}{dt}=rC \\ | ||
| + | \frac{d(K+K_D)}{dt}=aC-bI(K+K_D)\\ | ||
| + | \end{array} | ||
| + | \right. | ||
| + | $ | ||
| + | </center> | ||
| + | <br> | ||
| + | <p> The derivative of absorbance is proportional to the amount of living bacteria, therefore, a linear growth of the absorbance is characteristic of a constant population of bacteria, and this will stay true even with the more complete models. The evolution of fluorescence is simply the combination of the production and the photobleaching terms.</p> | ||
| + | |||
<br> | <br> | ||
| - | <h3>Analytical Solution</h3> | + | <h3 id="AnaSol">Analytical Solution</h3> |
| - | <p> This simple model can be partially solved, for $C(t)$ or $I(t)$ | + | <p> This simple model can be partially solved, for $C(t)$ or $I(t)$ for example constant : </p> |
<br> | <br> | ||
| - | <p>If | + | <p>If $C$ is constant, i.e. $\forall t, C(t)=C_0$, we have :</p> |
<p> | <p> | ||
$ | $ | ||
| Line 109: | Line 132: | ||
</p> | </p> | ||
<br> | <br> | ||
| - | <p> and | + | <p> and therefore : $\frac{dK}{dt}=\left(a-\frac{br}{k}\right)C_0-rK$</p> |
| - | <p> which gives : $K=\left(\frac{a}{r}-\frac{b}{k}\right)C_0+Be^{-rt}$</p> | + | <p> which gives : $K(t)=\left(\frac{a}{r}-\frac{b}{k}\right)C_0+Be^{-rt}$</p> |
<br> | <br> | ||
| - | <p> | + | <p> Then $I(t)=\frac{rC_0}{kK(t)}$ should give a constant concentration of living cells.</p> |
| - | <p> | + | <p> Asymptotically, the light intensity that stabilizes the concentration of living cells is $I_0=\frac{r^2}{ak-rb}$.</p> |
<br> | <br> | ||
<br> | <br> | ||
| - | <p> But if we assume that $I$ is constant, $\forall t, I(t)=I_0$, we need another variable to | + | <p> But if we assume that $I$ is constant, i.e. $\forall t, I(t)=I_0$, we need another variable to be able to easily solve our equation : </p> |
| - | <p> We define | + | <p> We define $Y=\frac{K}{C}$ as the amount of KillerRed per bacteria.</p> |
<p> $\frac{dY}{dt}=\frac{d}{dt}\left(\frac{K}{C}\right)=a-(bI_0+r)Y$</p> | <p> $\frac{dY}{dt}=\frac{d}{dt}\left(\frac{K}{C}\right)=a-(bI_0+r)Y$</p> | ||
| - | <p> which gives | + | <p> which gives $Y=\frac{a}{bI_0+r}+Be{-(bI_0+r)t} $</p> |
<br> | <br> | ||
| - | <p> $Y$ tends toward a steady state value, $\frac{a}{bI_0+r}$. Let's see how C </p> | + | <p> $Y$ tends toward a steady-state value, $\frac{a}{bI_0+r}$. Let's see how C evolves :</p> |
<p>$\frac{dC}{dt}=C(r-kI_0Y)$</p> | <p>$\frac{dC}{dt}=C(r-kI_0Y)$</p> | ||
<p>$\frac{dC}{dt}=C\left(r-\frac{kI_0a}{bI_0+r}+Be^{-(bI_0+r)t}\right)$</p> | <p>$\frac{dC}{dt}=C\left(r-\frac{kI_0a}{bI_0+r}+Be^{-(bI_0+r)t}\right)$</p> | ||
| - | <p> Thus, in the specific case | + | <p> Thus, in the specific case that $I_0=\frac{r^2}{ak-rb}$, we have $\lim_{t\to\infty}\frac{dC}{dt}(t)=0$.</p> |
<br> | <br> | ||
| - | <p> The resolution of this equation | + | <p> The resolution of this equation shows the possibility of stabilizing the system.</p> |
<br> | <br> | ||
| - | <p>The | + | <p>The resolution of the latter equation shows that it is possible to stabilize the system by means of a suitable (constant) light intensity.</p> |
<h3>Comparison with experiments</h3> | <h3>Comparison with experiments</h3> | ||
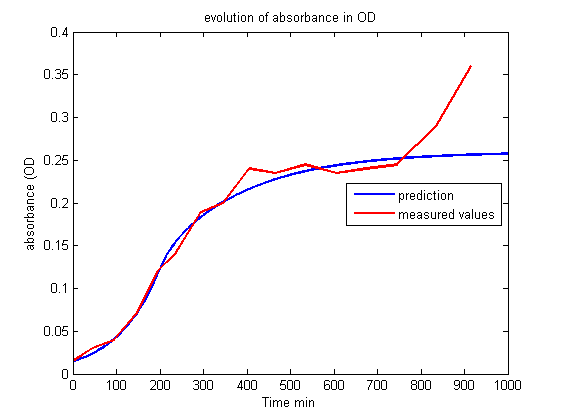
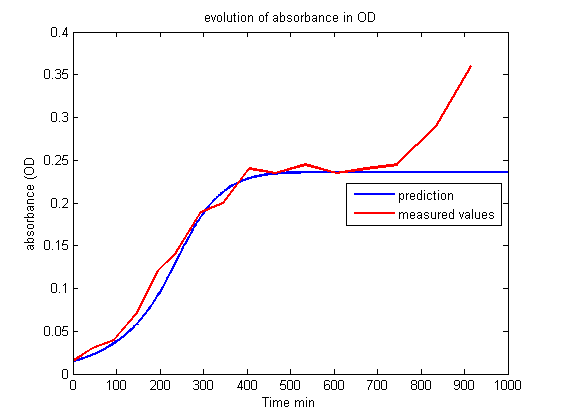
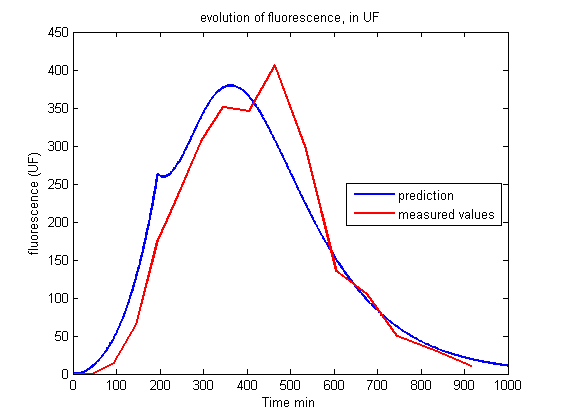
| - | <p> This first model is very interesting | + | <p> This first model is very interesting for understanding which parameters govern the evolution of the living cell population and to show that conditions exist to stabilize it. But unfortunately this set of equations is insufficient to account for the results of the experiments.<br><br></p> |
| + | <p align="center"><img src="https://static.igem.org/mediawiki/2013/7/76/Build_Exp1_OD.png"></p> | ||
| + | <p id="legend">Figure 1.<br>Evolution of absorbance in OD.<br><br></p> | ||
| + | |||
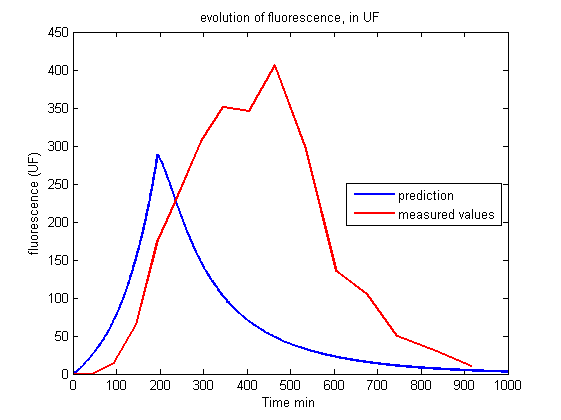
| + | <p align="center"><img src="https://static.igem.org/mediawiki/2013/6/61/Build_Exp1_fluo.png"></p> | ||
| + | <p id="legend">Figure 2.<br>Evolution of fluorescence in UF.<br><br></p> | ||
| Line 141: | Line 169: | ||
<br> | <br> | ||
<br> | <br> | ||
| - | <p> Whereas we observe a lag between the onset of light and the decrease of fluorescence, the first model predicts an immediate decrease. This discrepancy requires | + | <p> Whereas we observe a lag between the onset of light and the decrease of fluorescence, the first model predicts an immediate decrease. This discrepancy requires the introduction of other phenomena to explain the lag between the stimulus (the light) and the reaction (the decrease of fluorescence and the OD stabilization). Of course this explanation should be supported by biological facts. </p> |
</li> | </li> | ||
| Line 148: | Line 176: | ||
<h2 id="MatTime">Maturation Time</h2> | <h2 id="MatTime">Maturation Time</h2> | ||
<h3>The maturation of fluorescent proteins</h3> | <h3>The maturation of fluorescent proteins</h3> | ||
| - | <p>After | + | <p>After translation and spontaneous polypeptide folding, a fluorescent protein still has to maturate before becoming fluorescent. Fluorescent proteins mature after an oxidation reaction where three amino acids rearrange to form the fluorophore. For GFP, this time is typically 30 minutes [1]. The maturation time of KillerRed is significant for our experiments. </p> |
<br> | <br> | ||
| - | + | ||
<h3>Second model </h3> | <h3>Second model </h3> | ||
| - | <p> We consider maturation to be a simple chemical reaction, and the conversion of immature Killer Red to the mature form to be adequately described by first order reaction kinetics. A new variable is needed : </p> | + | <p> We consider maturation to be a simple chemical reaction, and the conversion of immature Killer Red to the mature form to be adequately described by first-order reaction kinetics. A new variable is needed: </p> |
<br> | <br> | ||
| - | <p>$\bullet$ $K_m$ the amount of mature KillerRed inside the living bacteria</p> | + | <p>$\bullet$ $K_m$ the amount of mature KillerRed inside the living bacteria per milliliter of cell suspension.</p> |
| - | <p>$\bullet$ $K_i$ the amount of immature KillerRed inside the living bacteria</p> | + | <p>$\bullet$ $K_i$ the amount of immature KillerRed inside the living bacteria per milliliter of cell suspension. As an immature fluorescent protein does not have a chromophore, it does not degrade with light, and so is not affected by photobleaching.</p> |
<center style="font-size:150%;"> | <center style="font-size:150%;"> | ||
| Line 172: | Line 200: | ||
| - | <p>$\diamond$ $mK_i$ is the term expressing the maturation of KillerRed </p> | + | <p>$\diamond$ $mK_i$ is the term expressing the maturation of KillerRed. We have a new parameter:</p> |
| + | <p> $m$: the maturation rate of KillerRed in $min^{-1}$</p> | ||
| + | |||
<br> | <br> | ||
| - | <p> Similarly, immature | + | <p> Similarly, immature KillerRed is also found in dead cells and its evolution is described by the following set of equations : </p> |
<center style="font-size:150%;"> | <center style="font-size:150%;"> | ||
| Line 189: | Line 219: | ||
</center> | </center> | ||
<p>Where :</p> | <p>Where :</p> | ||
| - | <p> $\diamond K_{Dm}$ the amount of immature KillerRed inside dead bacteria.</p> | + | <p> $\diamond K_{Dm}$ the amount of immature KillerRed inside dead bacteria per milliter of cell suspension.</p> |
| - | <p> $\diamond K_{Dm}$ the amount of mature KillerRed inside dead bacteria.</p> | + | <p> $\diamond K_{Dm}$ the amount of mature KillerRed inside dead bacteria per milliter of cell suspension.</p> |
<br> | <br> | ||
<h3> Comparison with experiments</h3> | <h3> Comparison with experiments</h3> | ||
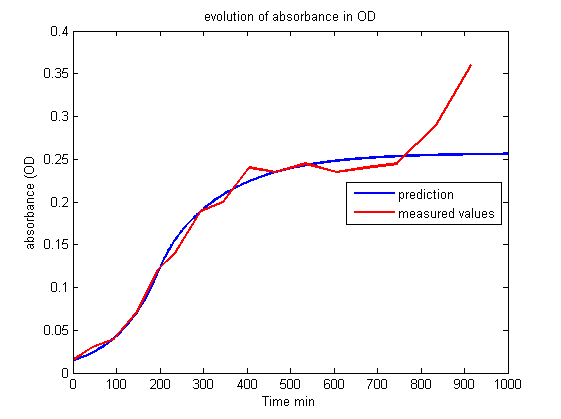
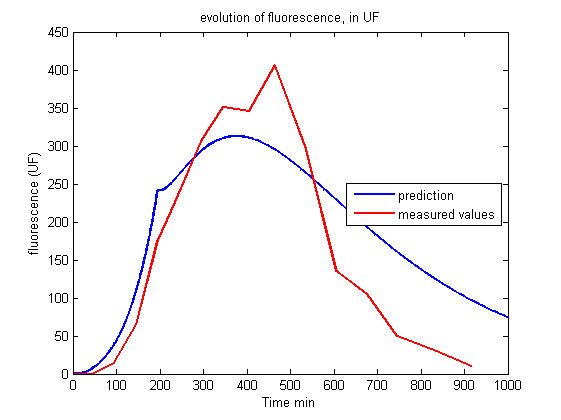
| - | <p> The curves drawn from the model | + | <p> The curves drawn from the model give the right trend, observed in the experiments: the lag of the reaction, the peak of fluorescence short after light is switched on and then the swift decrease of fluorescence in the long term are qualitatively described.<br><br></p> |
| + | |||
| + | |||
| + | |||
| + | <p align="center"><img src="https://static.igem.org/mediawiki/2013/4/41/Build_Exp2_OD.png"></p> | ||
| + | <p id="legend">Figure 3.<br>Evolution of absorbance in OD.<br><br></p> | ||
| + | |||
| + | |||
| + | <p align="center"><img src="https://static.igem.org/mediawiki/2013/1/11/Build_Exp2_fluo.png"></p> | ||
| + | <p id="legend">Figure 4.<br>Evolution of fluorescence in UF.<br><br></p> | ||
| + | |||
| + | |||
<br> | <br> | ||
| - | + | <p>Nonetheless, it is impossible to get a good fit between the prediction of the model and the experiment. The maturation step alone does not explain why the production of KillerRed is so high two hours after the beginning of the illumination and the decrease of fluorescence is so rapid four hours after the illumination.</p> | |
| - | <p>Nonetheless, it is impossible to get a good fit between the prediction of the model and the experiment. The maturation step alone | + | |
| - | + | ||
</li> | </li> | ||
| Line 205: | Line 246: | ||
<h3> Third Model</h3> | <h3> Third Model</h3> | ||
| - | <p> Until now, our equations describe the phototoxic effect of KillerRed as instantaneous : in the presence of light Killer Red produces ROS, which | + | <p> Until now, our equations describe the phototoxic effect of KillerRed as instantaneous: in the presence of light Killer Red produces ROS, which immediately kills a certain proportion of the bacteria but has no lasting effect. It is well-known, however, that cells can repair damages due to ROS, up to a certain level. We can thus consider that bacteria are unable to instantly repair all the damages caused by ROS, and with damages accumulating, they are more and more fragile and close to death.In other words, the effect of a certain amount of KillerRed at a certain time $u$, $K(u)$, illuminated by a light intensity $I(u)$, will affect cell growth at time $t$ later than $u$, weighted by a factor $e^{-p(t-u)}$ that vanishes as $t$ increases. The effect of this ROS production at time $u$ will thus exponentially decrease with time. The term $– kI.K$ (photokilling) was thus replaced by the integral:</p> |
| + | |||
| + | <center style="font-size:150%"> | ||
| + | $-\int_{u=0}^t k'I(u)K(u)e^{-p(t-u)}du$ | ||
| + | </center> | ||
| + | |||
| + | <p> And the equation of bacterial growth:</p> | ||
| + | |||
| + | <center style="font-size:150%;"> | ||
| + | $ | ||
| + | \frac{dC}{dt}(t)=rC(t)-\int_{u=0}^t k'I(u)K(u)e^{-p(t-u)}du | ||
| + | $ | ||
| + | </center> | ||
| + | <p> $p$: the ability of the cell to repair in one minute, in $min^{-1}$.</p> | ||
| + | |||
| + | <br> | ||
| + | <p> There is no analytical solution for this equation. But it is simple to treat it in its discrete-time form.</p> | ||
| + | |||
| + | |||
<br> | <br> | ||
| - | <p> Written in its | + | <p> Written in its discrete-time form, the evolution of $C$ was described by </p> |
<center style="font-size:150%;"> | <center style="font-size:150%;"> | ||
| + | $\tau$ the value of a step of time: | ||
$ | $ | ||
| - | C(t+ | + | C(t+\tau)-C(t)=rC(t)-kI(t)K(t) |
$ | $ | ||
</center> | </center> | ||
| - | <p> We now write | + | <p> We now write </p> |
<center style="font-size:150%;"> | <center style="font-size:150%;"> | ||
$ | $ | ||
\left\{ | \left\{ | ||
\begin{array}{l l} | \begin{array}{l l} | ||
| - | C(t+ | + | C(t+\tau)-C(t)=rC(t)-\mbox{tox}(t) \\ |
| - | \mbox{tox}(t+ | + | \mbox{tox}(t+\tau)=l.\mbox{tox}(t)+k'I(t)K(t)\\ |
\end{array} | \end{array} | ||
\right. | \right. | ||
| Line 227: | Line 287: | ||
with $l\in[0,1]$ | with $l\in[0,1]$ | ||
</center> | </center> | ||
| + | <br> | ||
| + | |||
<p> | <p> | ||
| - | The variable 'tox' is representative of the amount of damages inflicted to bacteria, and so of their probability | + | The variable 'tox' is representative of the amount of damages inflicted to bacteria, and so of their probability of dying. During a time step (for us, a minute), bacteria heal part of their injuries ($l<1$) and suffer new damages ($k'I(t)K(t)$). At first, few bacteria die : $\mbox{tox}(t)\cong k'I(t)K(t)$, then, 'tox' increases until it reach $\mbox{tox}(t)\cong\frac{k'}{1-l}I(t)K(t)$. $k'$ is the same in the continuous-time and the discrete-time forms, it will from now be named simply $k$. $p$ and $l$ are directly related : $p=-\frac{\ln(l)}{\tau}$. |
</p> | </p> | ||
<br> | <br> | ||
| - | <p> | + | <p>We have our last variable:</p> |
| - | < | + | <p> $l$: the rate of healing of the bacteria by step of time. unit less</p> |
| - | $ | + | |
| - | + | ||
| - | $ | + | |
| - | </ | + | <p>Considering this accumulation allows us to shift the effect of illumination, and so to have a more accurate model.</p> |
| - | <p> | + | |
<br> | <br> | ||
| Line 244: | Line 305: | ||
<h3> Comparison with experiments</h3> | <h3> Comparison with experiments</h3> | ||
| - | <p> With this model, we can now properly describe our data : </p> | + | <p> With this model, we can now properly describe our data:<br><br></p> |
| + | <p align="center"><img src="https://static.igem.org/mediawiki/2013/e/e6/Build_Exp3_OD.png"></p> | ||
| + | <p id="legend">Figure 5.<br>Evolution of absorbance in OD.<br><br></p> | ||
| + | <p align="center"><img src="https://static.igem.org/mediawiki/2013/c/c9/Build_Exp3_fluo.png"></p> | ||
| + | <p id="legend">Figure 6.<br>Evolution of fluorescence in UF.<br><br></p> | ||
| + | |||
| + | <p> As this fit seems to decribe well the kinetics observed, we will use this model to predict all our systems. But we still have parameters to adjust to find the best fit possible.</p> | ||
</li> | </li> | ||
| + | <li> | ||
| + | <h2>Reference</h2> | ||
| + | <br> | ||
| + | <p>[1]<a ref=http://www.chem.ufl.edu/~fanucci/courses/BiochemistryJournalClub/Spring2007/ChromophoreFormationinGFP_biochemistry_1997.pdf">REID Brian G., FLYNN Gregiry C. Chromophore Formation in Green Fluorescent Protein. Biochemistry, 1997, 36, p 6786-6791</a>.</p> | ||
| + | <br> | ||
| + | </li> | ||
<li id="next"><a href="/Team:Grenoble-EMSE-LSU/Project/Modelling/Parameters">Next Page</a></li> | <li id="next"><a href="/Team:Grenoble-EMSE-LSU/Project/Modelling/Parameters">Next Page</a></li> | ||
Latest revision as of 03:09, 5 October 2013