"
"
Team:Grenoble-EMSE-LSU/Project/Monitoring/Cell2Machine
From 2013.igem.org
(Difference between revisions)
| Line 52: | Line 52: | ||
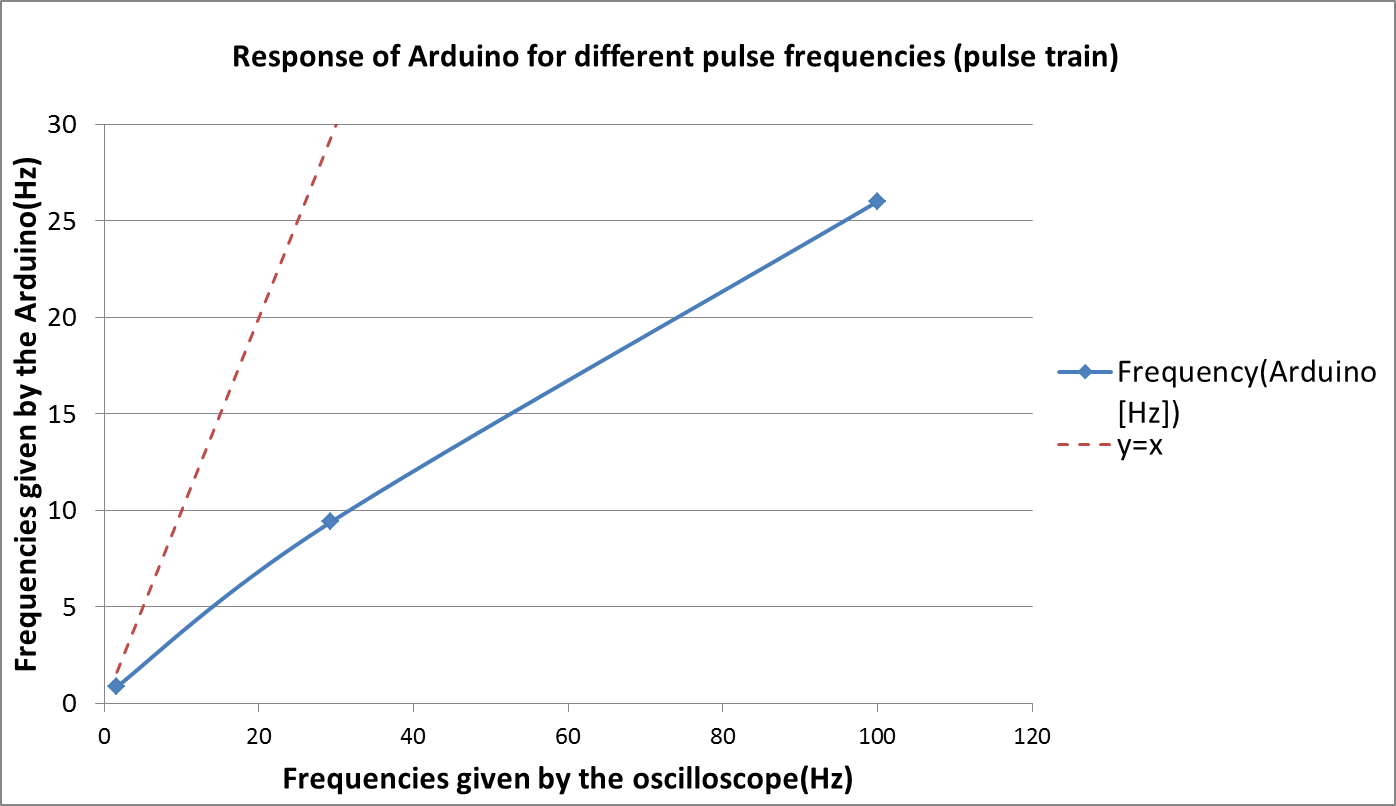
To know if this program works, a function generator was plug in one of the digital input of Arduino instead of the photodiode. By changing the frequency of the square signal sent by the generator and measuring several times the frequency with Arduino and compare the measures to the frequency given by an oscilloscope, we can calculate the accuracy of the program.</br> | To know if this program works, a function generator was plug in one of the digital input of Arduino instead of the photodiode. By changing the frequency of the square signal sent by the generator and measuring several times the frequency with Arduino and compare the measures to the frequency given by an oscilloscope, we can calculate the accuracy of the program.</br> | ||
| - | If the algorithm is right, the curve should follow the equation x=y, which means that Arduino and the oscilloscope measure the same frequencies.</br></br> | + | If the algorithm is right, the curve should follow the equation x=y, which means that Arduino and the oscilloscope measure the same frequencies.</br></br></p> |
| - | <img src="https://static.igem.org/mediawiki/2013/3/31/Arduino_mode1.png" alt="Arduino Mode1" width=" | + | <p style="align:center"><img src="https://static.igem.org/mediawiki/2013/3/31/Arduino_mode1.png" alt="Arduino Mode1" width="500px"></br> |
| - | <img src="https://static.igem.org/mediawiki/2013/8/86/Arduino_mode2.png" alt="Arduino Mode2" width=" | + | <img src="https://static.igem.org/mediawiki/2013/8/86/Arduino_mode2.png" alt="Arduino Mode2" width="500px"></br> |
| - | <img src="https://static.igem.org/mediawiki/2013/4/40/Arduino_std.png" alt="Arduino Mode2 standard deviation" width=" | + | <img src="https://static.igem.org/mediawiki/2013/4/40/Arduino_std.png" alt="Arduino Mode2 standard deviation" width="500px"> |
| - | </br></br> | + | </br></br></p> |
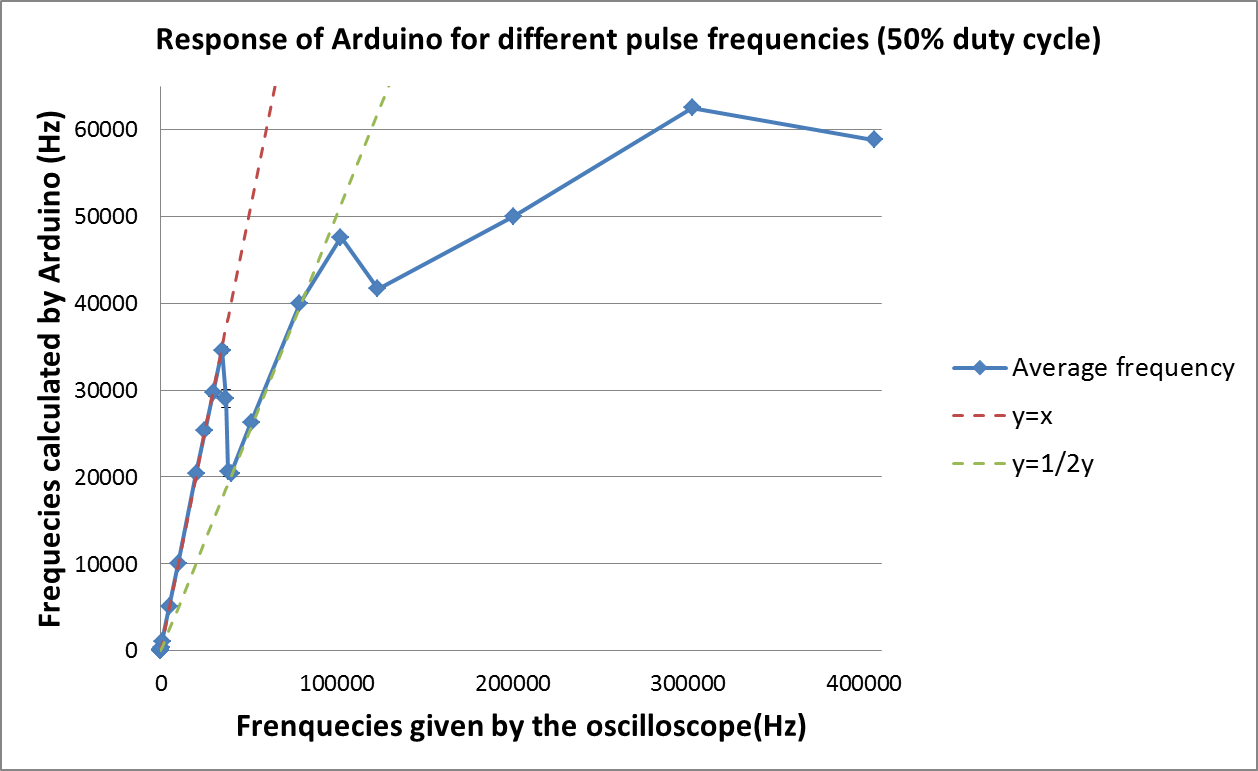
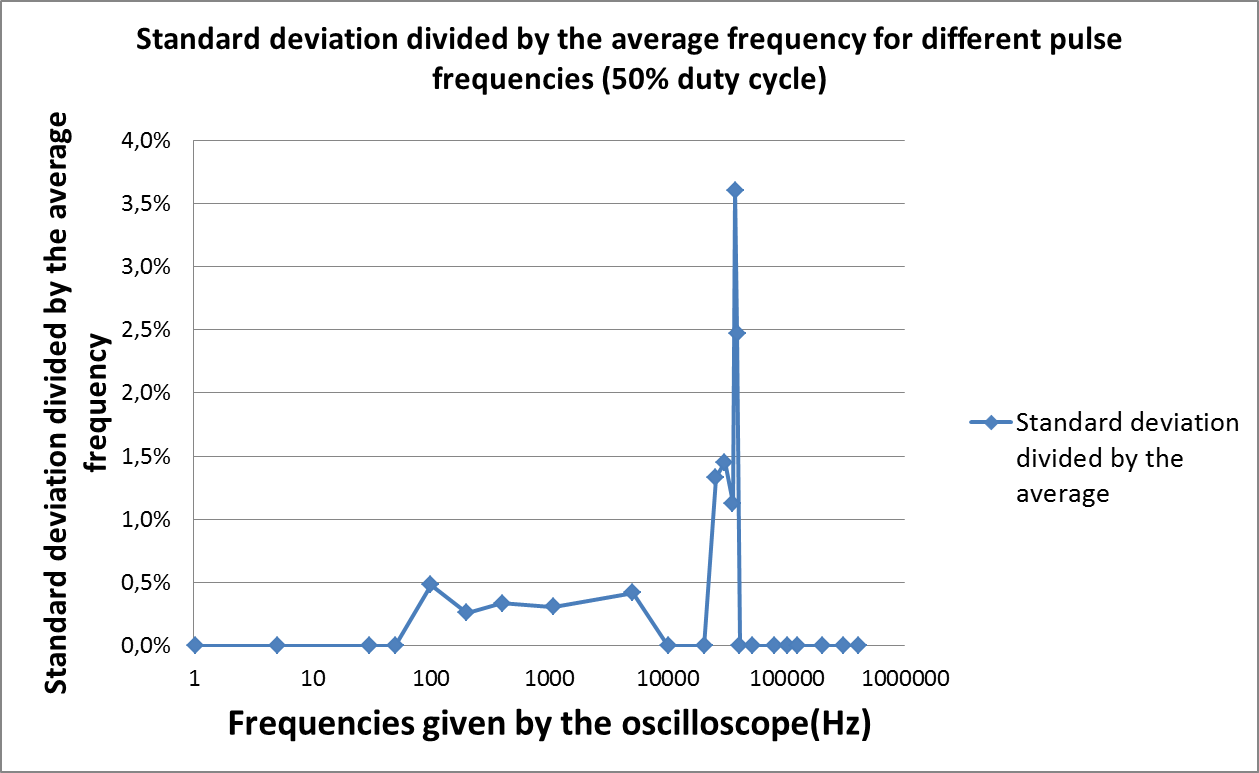
| - | According to the experience, the pulse train is not a good option since the curve doesn’t follow at all the x=y curve. Only three points are shown here because the others are worst. On the other hand, the 50% duty cycle seems to work better, at least for the low frequency. For frequencies under 35kHz the curve fits the equation y=x. However after these critical frequency, the algorithm seems to break down and follows the equation y=1/2x before being useless for frequencies over 100kHz. This phenomenon may be explain by the time of the while loop. In the end of this loop the program needs to get back to the beginning of the loop, it is fast but since the frequency is higher it may be not fast enough that’s why the program misses one pulse out of two and shed light on the curves y=1/2x. The curve of the standard deviation divided by the average shows us that around the critical frequency the program is not efficient at all, that makes us believe this is the right explanation. But this graph displays something else, the program for low frequencies and afterwards for low light intensities is very precise. The errors are under 0.5%. And the number of pulse measured is 100. That means that the device can make a measure every 5 min and this is absolutely enough for measuring a biological system. | + | |
| + | <p>According to the experience, the pulse train is not a good option since the curve doesn’t follow at all the x=y curve. Only three points are shown here because the others are worst. On the other hand, the 50% duty cycle seems to work better, at least for the low frequency. For frequencies under 35kHz the curve fits the equation y=x. However after these critical frequency, the algorithm seems to break down and follows the equation y=1/2x before being useless for frequencies over 100kHz. This phenomenon may be explain by the time of the while loop. In the end of this loop the program needs to get back to the beginning of the loop, it is fast but since the frequency is higher it may be not fast enough that’s why the program misses one pulse out of two and shed light on the curves y=1/2x. The curve of the standard deviation divided by the average shows us that around the critical frequency the program is not efficient at all, that makes us believe this is the right explanation. But this graph displays something else, the program for low frequencies and afterwards for low light intensities is very precise. The errors are under 0.5%. And the number of pulse measured is 100. That means that the device can make a measure every 5 min and this is absolutely enough for measuring a biological system. | ||
Now we need to know if the device is efficient enough to measure low light intensity like fluorescence. | Now we need to know if the device is efficient enough to measure low light intensity like fluorescence. | ||
</p> | </p> | ||
Revision as of 20:27, 15 September 2013