"
"
Team:Grenoble-EMSE-LSU/Project/Monitoring/Cell2Machine
From 2013.igem.org
(Difference between revisions)
| Line 41: | Line 41: | ||
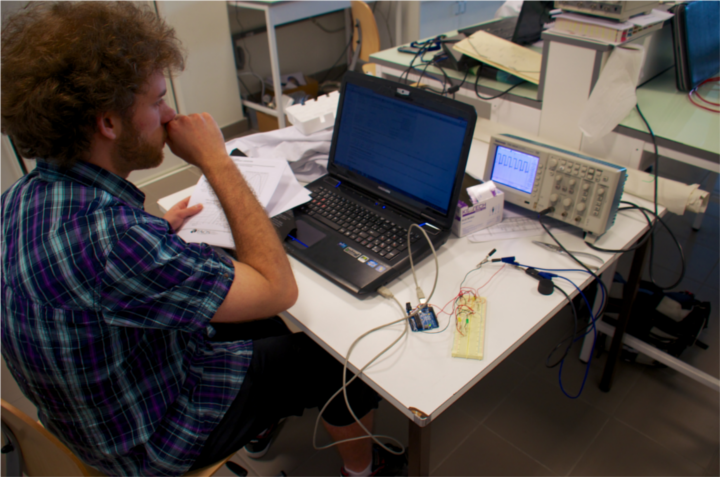
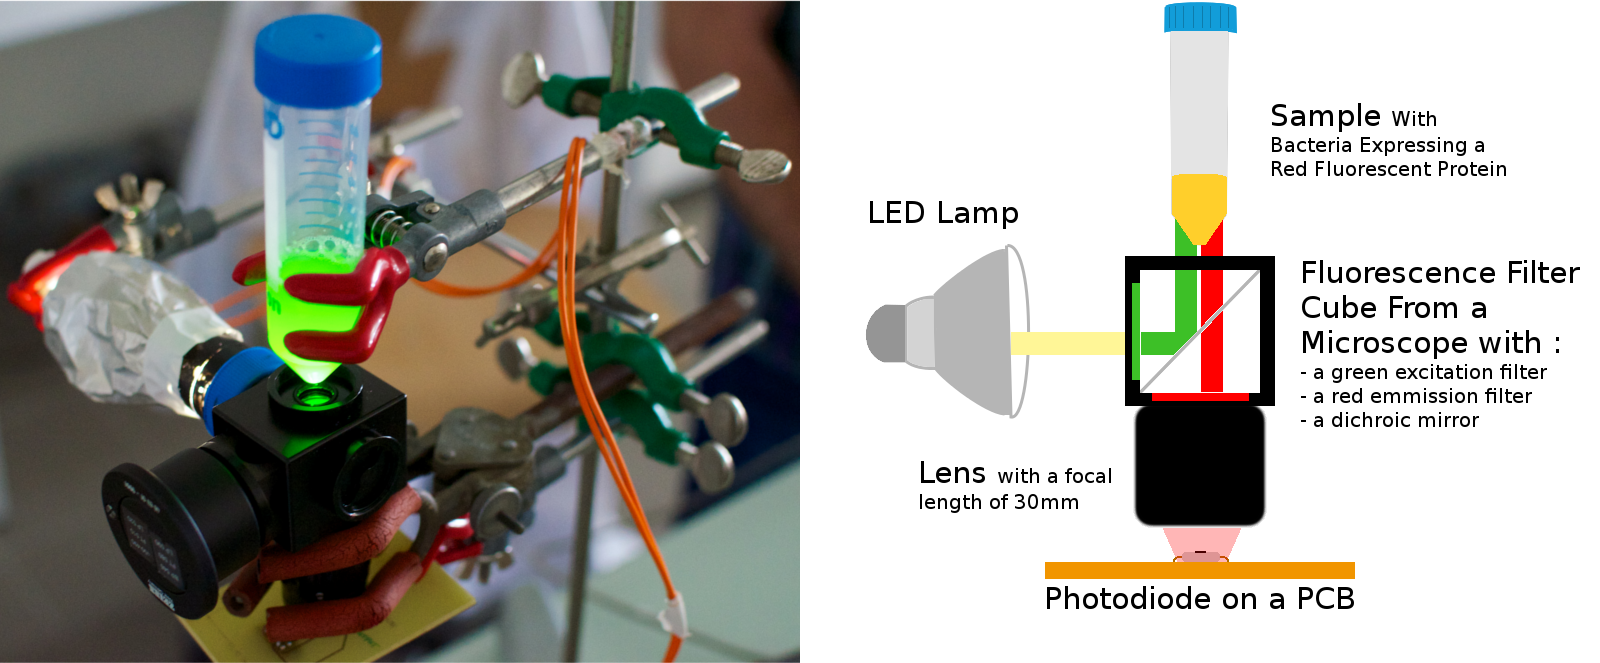
<p align="center", style="margin:20px"><img src="https://static.igem.org/mediawiki/2013/5/5f/IGEMerworkphotodiode.png" alt="memberworkingonphotodiode" width="500px"></p> | <p align="center", style="margin:20px"><img src="https://static.igem.org/mediawiki/2013/5/5f/IGEMerworkphotodiode.png" alt="memberworkingonphotodiode" width="500px"></p> | ||
| - | <p id="legend"><strong><em>A member of the team working on the photodiode</em></strong><br></p> | + | <p id="legend"><strong><em>A member of the team working on the photodiode</em></strong></br></p> |
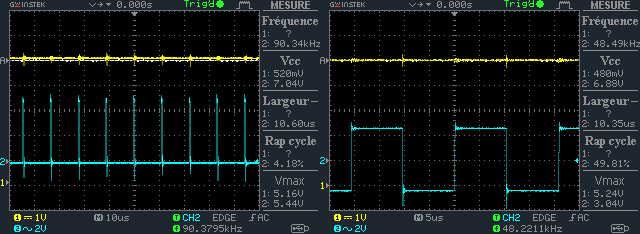
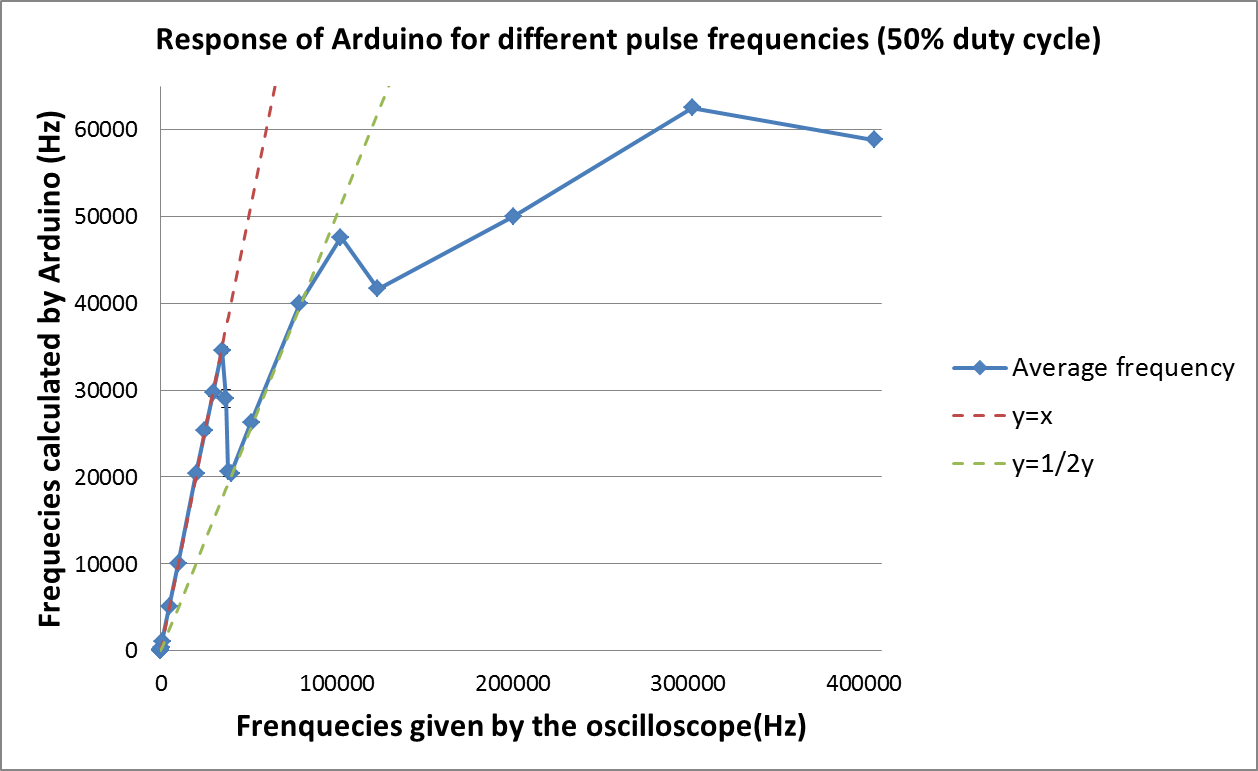
<p>For the same amount of light, we measure the frequency at the output of the photodiode for a pulse train or a square wave (50% duty cycle). According to the datasheet, when using a pulse train the linear relation between the frequency and the irrandiance is given by 1kHz=1µW/cm². When using a square wave (50% duty cycle) it is 1kHz=2µW/cm². This is what we can see on the figure #. | <p>For the same amount of light, we measure the frequency at the output of the photodiode for a pulse train or a square wave (50% duty cycle). According to the datasheet, when using a pulse train the linear relation between the frequency and the irrandiance is given by 1kHz=1µW/cm². When using a square wave (50% duty cycle) it is 1kHz=2µW/cm². This is what we can see on the figure #. | ||
</p> | </p> | ||
<p align="center"><img src="https://static.igem.org/mediawiki/2013/5/51/Oscilloscope.png" alt="Oscillogram" width="650px" /></p> | <p align="center"><img src="https://static.igem.org/mediawiki/2013/5/51/Oscilloscope.png" alt="Oscillogram" width="650px" /></p> | ||
| - | <p id="legend"><strong><em>Oscillograms showing the two different mode of the photodiode.</em></strong>The first oscillogramm shows the pulse train mode and the second the 50% duty cycle mode<br></p> | + | <p id="legend"><strong><em>Oscillograms showing the two different mode of the photodiode.</em></strong></br>The first oscillogramm shows the pulse train mode and the second the 50% duty cycle mode</br></p> |
<p></br>Since this frequency will be calculated by the Arduino controller, it may cause some trouble to the program to use a pulse train because the duration of the pulse is always 500ns and can be missed by the controller. The square wave (50% duty cycle) seems to be a better solution because of the 50% duty cycle. It means that the pulse duration depend on the frequency. Its duration is equal to 1/2f and since the light intensity we want to measure will be low this type of signal can be easily detected by Arduino.</p> | <p></br>Since this frequency will be calculated by the Arduino controller, it may cause some trouble to the program to use a pulse train because the duration of the pulse is always 500ns and can be missed by the controller. The square wave (50% duty cycle) seems to be a better solution because of the 50% duty cycle. It means that the pulse duration depend on the frequency. Its duration is equal to 1/2f and since the light intensity we want to measure will be low this type of signal can be easily detected by Arduino.</p> | ||
Revision as of 07:48, 16 September 2013