"
"
Team:Grenoble-EMSE-LSU/Project/Monitoring/Cell2Machine
From 2013.igem.org
(Difference between revisions)
| (12 intermediate revisions not shown) | |||
| Line 18: | Line 18: | ||
<li id="titre"> | <li id="titre"> | ||
<h1>Cell to Machine Communication</h1> | <h1>Cell to Machine Communication</h1> | ||
| - | <p>To create a means of communication from cell to machine, we chose the red fluorescence protein KillerRed as a reporter protein. The first condition that our device needs to fulfill is to record light intensity. Then it needs to generate fluorescence thanks to a light source and a couple of excitation and emission filters. | + | <p>To create a means of communication from cell to machine, we chose the red fluorescence protein KillerRed as a reporter protein. The first condition that our device needs to fulfill is to record light intensity. Then it needs to generate fluorescence thanks to a light source and a couple of excitation and emission filters. First we will explain how we chose<a href="#Component">the different components</a>, then the experiments we did to find the most accurate parameters for each part of the device – <a href="#Photodiode">the photodiode</a>, <a href="#Arduino">Arduino</a> and <a href="#Optic">the optical components</a>.</p> |
</li> | </li> | ||
<li> | <li> | ||
<h2 id="Component">The components</h2> | <h2 id="Component">The components</h2> | ||
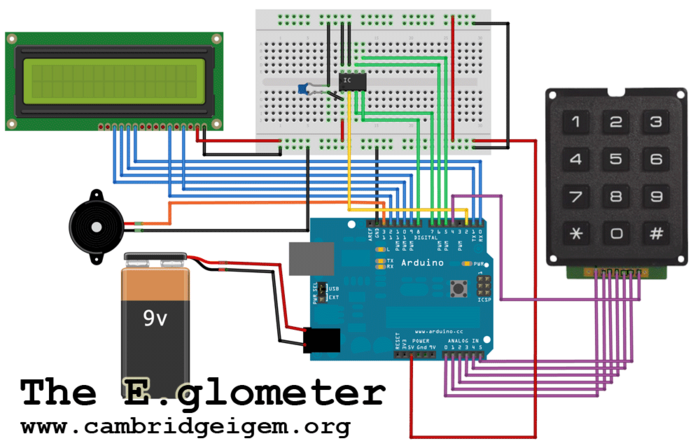
| - | <p>To record light intensity, we were inspired by the E. glometer of the | + | <p>To record light intensity, we were inspired by the E. glometer of the Cambridge team of iGEM 2010.<br> |
<p align="center"><img src="https://static.igem.org/mediawiki/2013/a/a7/Eglometer.png" alt="The Eglometer" width="500px" /></p> | <p align="center"><img src="https://static.igem.org/mediawiki/2013/a/a7/Eglometer.png" alt="The Eglometer" width="500px" /></p> | ||
| Line 33: | Line 33: | ||
<br> | <br> | ||
<p> | <p> | ||
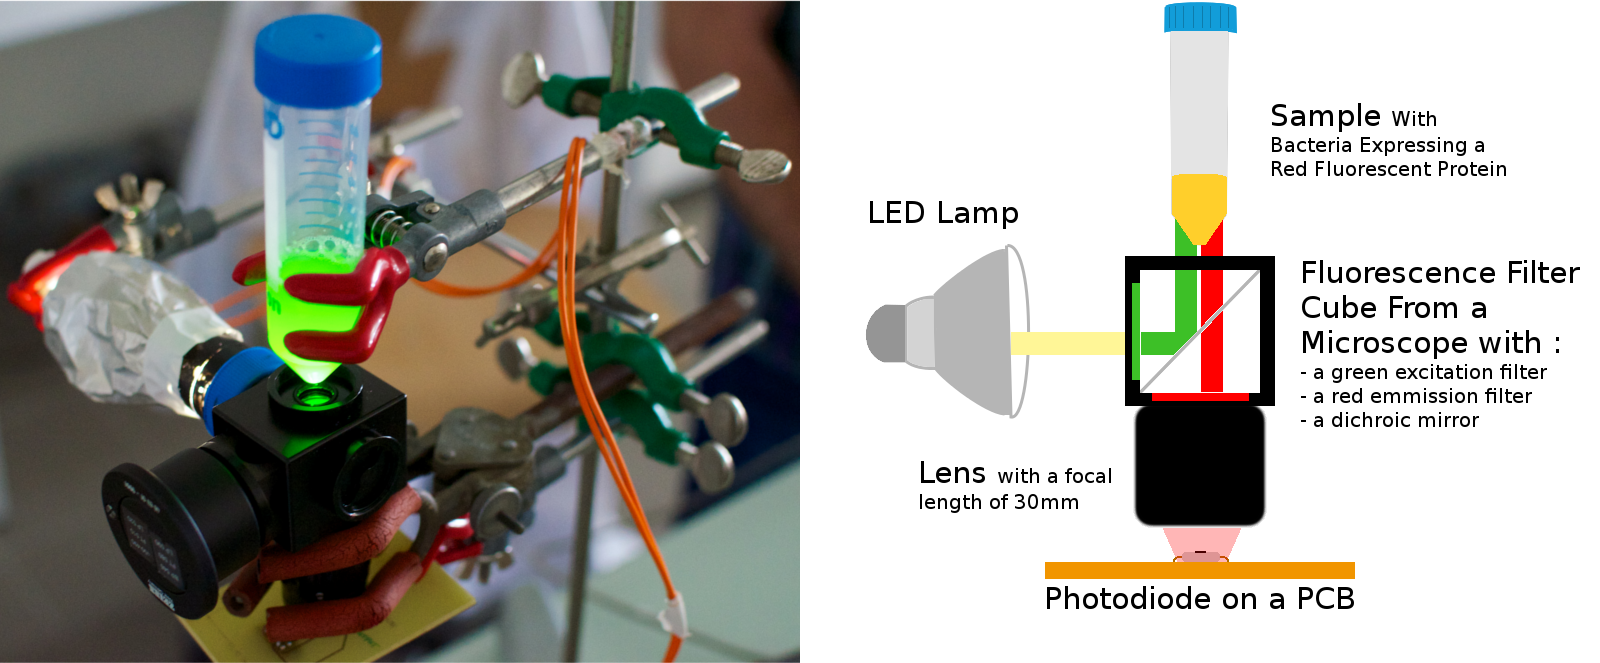
| - | We use | + | We use a similar photodiode (TSL230RD) – the same as the TSL230RP-LF but as a surface mounted device (SMD) – and an Arduino Uno. Arduino is a single-board microcontroller created to make electronics more accessible. The main asset of the photodiode is that the output can be either a pulse train or a square wave (50% duty cycle) with its frequency directly proportional to light intensity. Since we are using a microcontroller, it is easy to calculate the frequency with the digital input of the microchip thanks to high or low level detection and we will have a better resolution because low frequencies are easier to measure than low voltages at low light levels. For the optical part we use a LED lamp and a cube filter from a fluorescence microscope with excitation and emission filters and an adjustable lens. The LED lamp was chosen so that e didn't have to buy high-power LEDS and build a card with heat sinks. This lamp illuminates with 520 lumens in a 40° cone under 12V and 6W. The low voltage was chosen as a safety measure and the small angle to avoid losing too much light. The excitation filter is a green interferential filter to excite the red fluorescent protein and the red emission filter is only a colored filter to collect all the red light in order to have a more precise measure. In the cube there is also a dichroic mirror that reflects all the green light and transmits all the red light. This mirror enables us to separate the photodiode from the light source completely. |
</p> | </p> | ||
</li> | </li> | ||
<li> | <li> | ||
<h2 id="Photodiode">The photodiode</h2> | <h2 id="Photodiode">The photodiode</h2> | ||
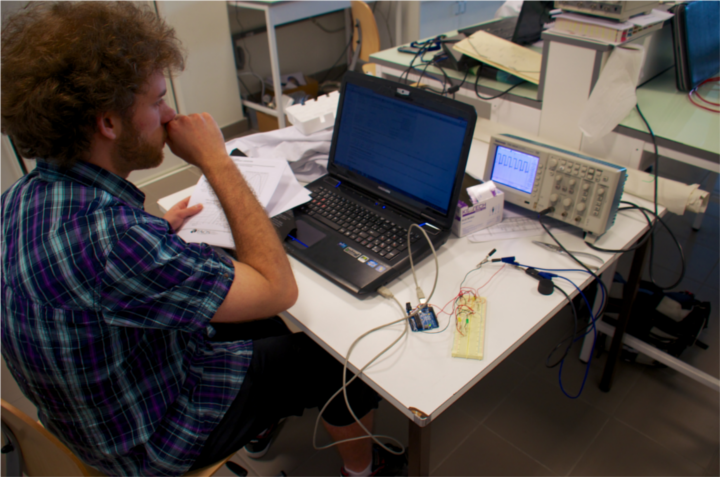
| - | <p>Before measuring with the photodiode, we need to know if the photodiode works as indicated in the datasheet. The photodiode was | + | <p>Before measuring with the photodiode, we need to know if the photodiode works as indicated in the datasheet. The photodiode was plugged in on a 5V stabilized power supply.</br></p> |
| - | </ | + | |
| - | < | + | <p align="center", style="margin:20px"><img src="https://static.igem.org/mediawiki/2013/5/5f/IGEMerworkphotodiode.png" alt="memberworkingonphotodiode" width="500px"></p> |
| - | <p align="center"><img src="https://static.igem.org/mediawiki/2013/5/51/Oscilloscope.png" alt=" | + | <p id="legend"><strong><em>A member of the team working on the photodiode</em></strong></br></p> |
| - | <br> | + | |
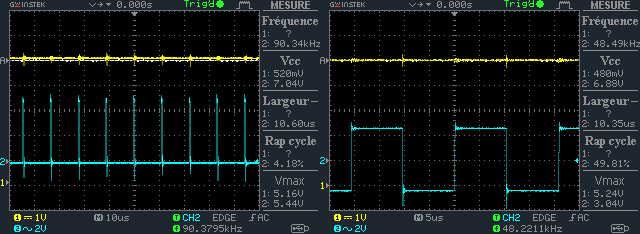
| - | <p>Since this frequency will be calculated by the Arduino controller, it may cause some trouble to the program to use a pulse train because the duration of the pulse is always 500ns and can be missed by the controller. The square wave (50% duty cycle) seems to be a better solution because of the 50% duty cycle. It means that the pulse duration depend on the frequency. Its duration is equal to 1/2f and since the light intensity we want to measure will be low this type of signal can be easily detected by Arduino.</p> | + | <p>For the same amount of light, we measure the frequency at the output of the photodiode for a pulse train or a square wave (50% duty cycle). According to the datasheet, when using a pulse train the linear relation between the frequency and the irrandiance is given by 1kHz=1µW/cm². When using a square wave (50% duty cycle) it is 1kHz=2µW/cm². This is what we can see on the figure #. |
| + | </br></p> | ||
| + | <p align="center"><img src="https://static.igem.org/mediawiki/2013/5/51/Oscilloscope.png" alt="Oscillogram" width="650px" /></p> | ||
| + | <p id="legend"><strong><em>Oscillograms showing the two different mode of the photodiode.</em></strong></br>The first oscillogramm shows the pulse train mode and the second the 50% duty cycle mode</br></p> | ||
| + | |||
| + | <p></br>Since this frequency will be calculated by the Arduino controller, it may cause some trouble to the program to use a pulse train because the duration of the pulse is always 500ns and can be missed by the controller. The square wave (50% duty cycle) seems to be a better solution because of the 50% duty cycle. It means that the pulse duration depend on the frequency. Its duration is equal to 1/2f and since the light intensity we want to measure will be low this type of signal can be easily detected by Arduino.</p> | ||
</li> | </li> | ||
<li> | <li> | ||
| Line 54: | Line 59: | ||
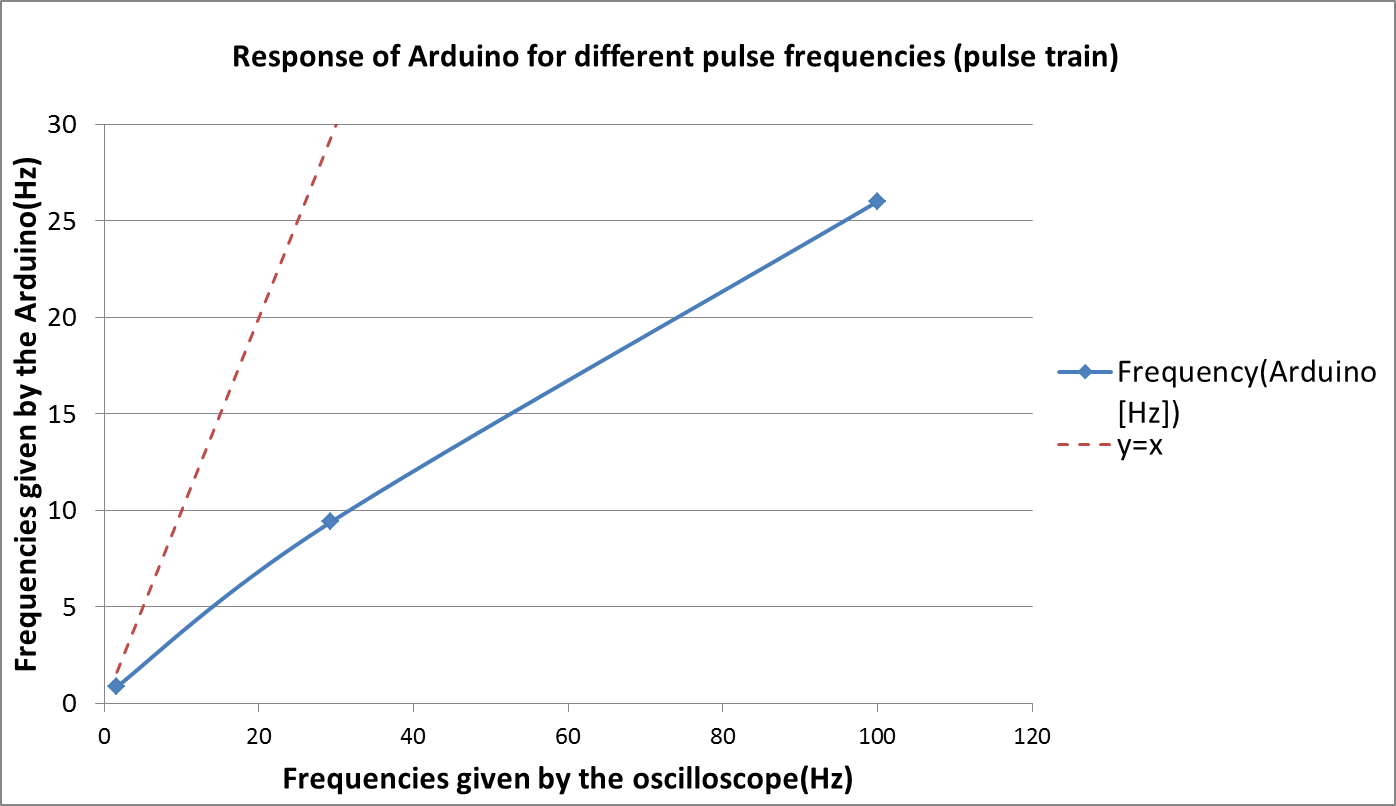
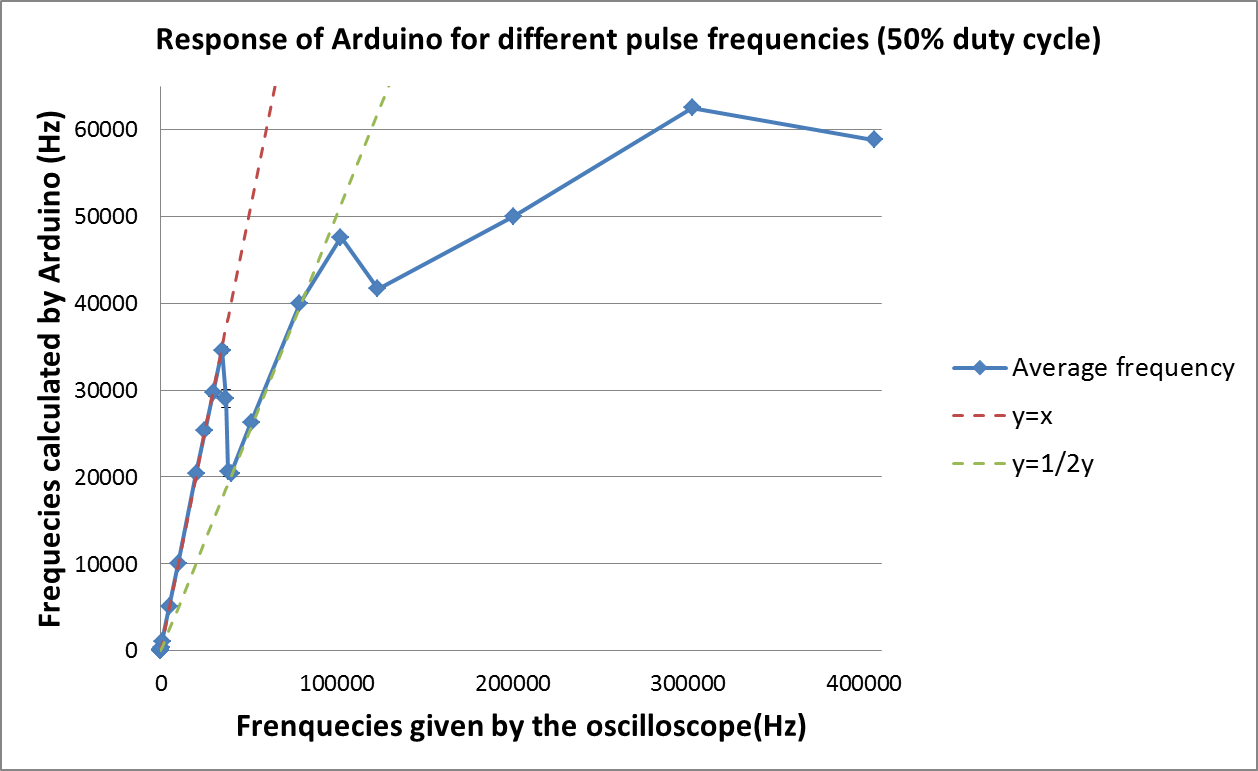
If the algorithm is right, the curve should follow the equation x=y, which means that Arduino and the oscilloscope measure the same frequencies.</br></p> | If the algorithm is right, the curve should follow the equation x=y, which means that Arduino and the oscilloscope measure the same frequencies.</br></p> | ||
| - | <p align="center"><img src="https://static.igem.org/mediawiki/2013/3/31/Arduino_mode1.png" alt="Arduino Mode1" width="700px"> | + | <p align="center", style="margin:30px"><img src="https://static.igem.org/mediawiki/2013/3/31/Arduino_mode1.png" alt="Arduino Mode1" width="700px"> |
<img src="https://static.igem.org/mediawiki/2013/8/86/Arduino_mode2.png" alt="Arduino Mode2" width="700px"> | <img src="https://static.igem.org/mediawiki/2013/8/86/Arduino_mode2.png" alt="Arduino Mode2" width="700px"> | ||
<img src="https://static.igem.org/mediawiki/2013/4/40/Arduino_std.png" alt="Arduino Mode2 standard deviation" width="700px"> | <img src="https://static.igem.org/mediawiki/2013/4/40/Arduino_std.png" alt="Arduino Mode2 standard deviation" width="700px"> | ||
| Line 60: | Line 65: | ||
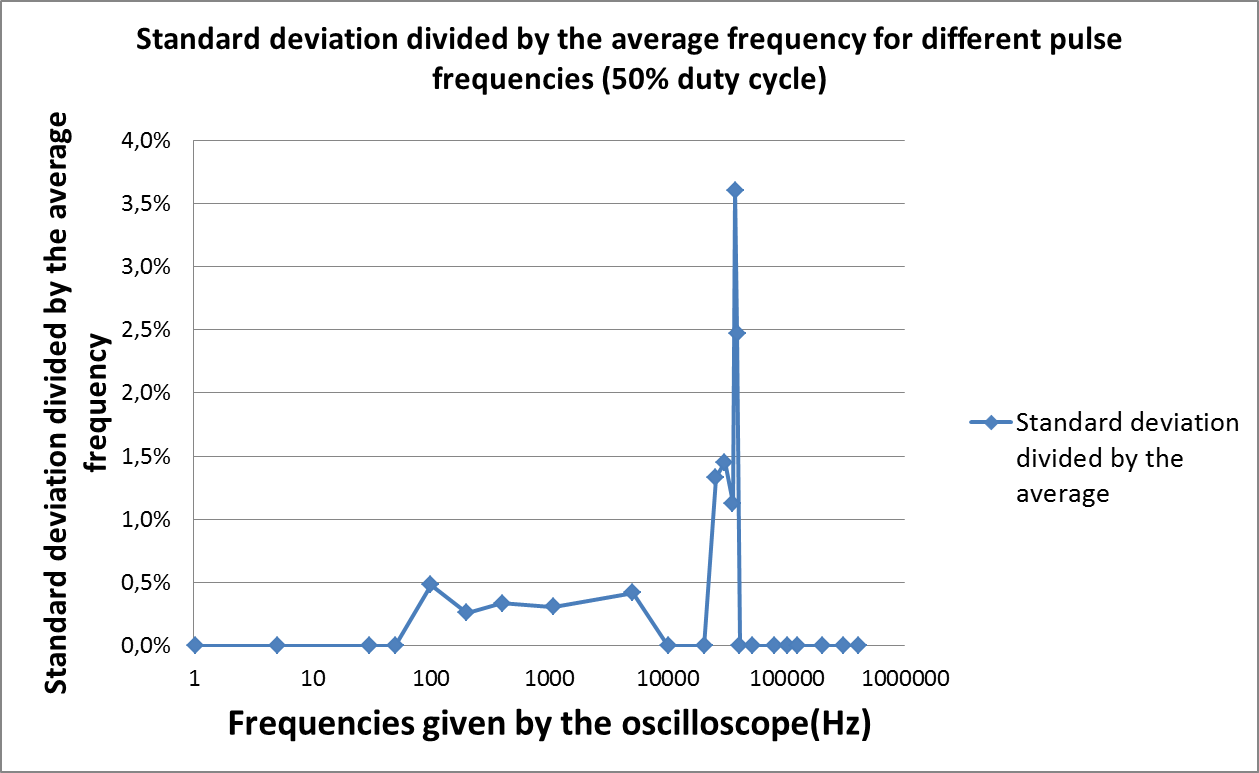
<p id="legend"><strong><em>Characterization of the algorithm in Arduino</em></strong><br> | <p id="legend"><strong><em>Characterization of the algorithm in Arduino</em></strong><br> | ||
| - | The first graph shows us the reponse of Arduino in pulse train mode, the second one shows us the response of Arduino in 50% duty circle mode, and the last one gives us the standard deviation of the 50% duty circle mode | + | The first graph shows us the reponse of Arduino in pulse train mode, the second one shows us the response of Arduino in 50% duty circle mode, and the last one gives us the standard deviation of the 50% duty circle mode</p> |
| - | <p>According to the experience, the pulse train is not a good option since the curve doesn’t follow at all the x=y curve. Only three points are shown here because the others are worst. On the other hand, the 50% duty cycle seems to work better, at least for the low frequency. For frequencies under 35kHz the curve fits the equation y=x. However after this critical frequency, the algorithm seems to break down and follows the equation y=1/2x before being useless for frequencies over 100kHz. This phenomenon may be explain by the time of the while loop. In the end of this loop the program needs to get back to the beginning of the loop, it is fast but since the frequency is higher it may be not fast enough that’s why the program misses one pulse out of two and shed light on the curves y=1/2x. The curve of the standard deviation divided by the average shows us that around the critical frequency the program is not efficient at all, that makes us believe this is the right explanation. But this graph displays something else, the program for low frequencies and afterwards for low light intensities is very precise. The errors are under 0.5%. And the number of pulse measured is 100. That means that the device can make a measure every 5 min and this is absolutely enough for measuring a biological system. | + | <p></br>According to the experience, the pulse train is not a good option since the curve doesn’t follow at all the x=y curve. Only three points are shown here because the others are worst. On the other hand, the 50% duty cycle seems to work better, at least for the low frequency. For frequencies under 35kHz the curve fits the equation y=x. However after this critical frequency, the algorithm seems to break down and follows the equation y=1/2x before being useless for frequencies over 100kHz. This phenomenon may be explain by the time of the while loop. In the end of this loop the program needs to get back to the beginning of the loop, it is fast but since the frequency is higher it may be not fast enough that’s why the program misses one pulse out of two and shed light on the curves y=1/2x. The curve of the standard deviation divided by the average shows us that around the critical frequency the program is not efficient at all, that makes us believe this is the right explanation. But this graph displays something else, the program for low frequencies and afterwards for low light intensities is very precise. The errors are under 0.5%. And the number of pulse measured is 100. That means that the device can make a measure every 5 min and this is absolutely enough for measuring a biological system. |
Now we need to know if the device is efficient enough to measure low light intensity like fluorescence. | Now we need to know if the device is efficient enough to measure low light intensity like fluorescence. | ||
</p> | </p> | ||
Latest revision as of 20:13, 16 September 2013